Sample Category Title
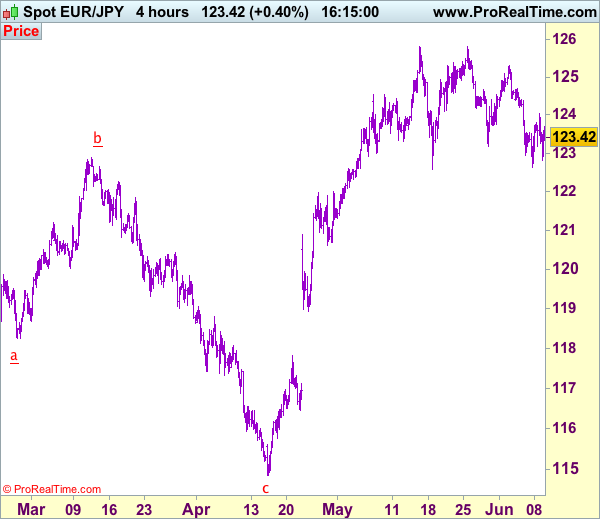
EUR/JPY Elliott Wave Analysis
EUR/JPY - 123.57
EUR/JPY: Wave v as well as larger degree wave (C) ended at 94.11 and first leg of larger degree wave C upmove has possibly ended at 149.79 and wave 2 correction has possibly ended at 109.49.
The single currency met resistance at 125.31 late last week and has slipped again, suggesting consolidation below recent high of 125.82 would be seen and initial downside risk is for weakness to 122.56-63 and possibly towards 122.00-10, however, reckon 121.60-65 (38.2% Fibonacci retracement of 114.85-125.82) would limit downside and bring another rise later, above 124.70-75 would bring test of 125.31 but only break of said recent high at 125.82 is needed to confirm recent upmove from 109.49 low has resumed and extend gain to resistance at 126.47 and possibly 127.50-60, however, reckon upside would be limited to 128.17 resistance and price should falter well below 129.00 (61.8% Fibonacci retracement of 141.06-109.49).
The daily chart is labeled as attached, early selloff from 169.97 (July 2008) to 112.08 is wave (A) of B instead of end of entire wave B and then the rebound from there to 139.26 is wave (B), hence, wave (C) has possibly ended at 94.12 with a diagonal triangle as labeled in the daily chart, hence upside bias is seen for further gain. Recent rally above indicated retracement level at 116.69 (50% Fibonacci retracement of the intermediate fall from 139.26-94.12) adds credence to this view and signal major reversal has commenced but first leg of this wave C has possibly ended at 149.79, hence wave 2 has commenced with wave A ended at 126.09, followed by wave B at 141.06, wave C commenced and could have ended at 109.49, above 125.00 would add credence to this view.
On the downside, whilst initial pullback to 122.56-63 and possibly 122.10 cannot be ruled out, reckon downside would be limited and 121.60-65 (38.2% Fibonacci retracement of 114.85-125.82) should hold, bring another rise later. A daily close below 121.60-65 would defer and suggest top is formed instead, risk correction to 121.00 and possibly towards support at 120.60 but reckon 120.30-35 (50% Fibonacci retracement) would limit downside and psychological level at 120.00 should hold.
Recommendation: Buy at 121.60 for 124.50 with stop below 120.60.
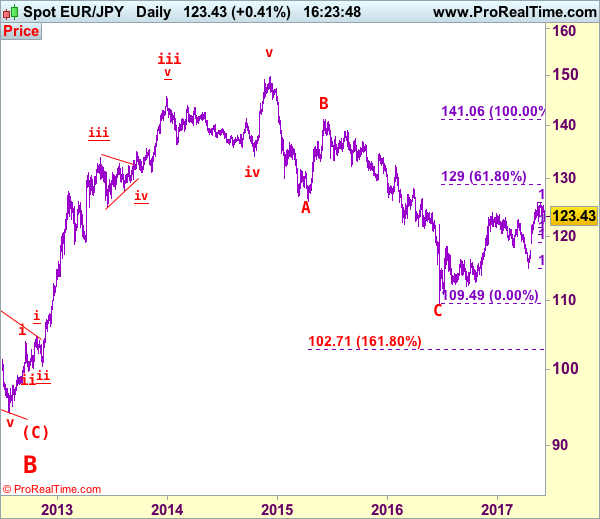
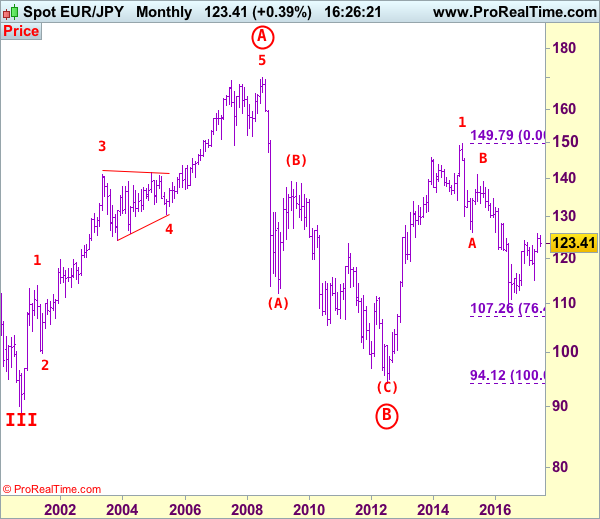
To re-cap the corrective upmove from the record low of 88.93 (18 Oct 2000), the wave A from there is subdivided as: 1:88.93-113.72, 2:99.88 (1 Jun 2001), 3:140.91 (30 May 2003), 4:124.17 (10 Nov 2003) and 5 ended at record high of 169.97 (21 Jul 2008). The brief but sharp selloff to 112.08 is viewed as a-b-c x a-b-c wave (A) of B. The subsequent rebound to 139.26 is (B) of B and (C) of (B) has possibly ended at 94.12 and in any case price should stay well above previous chart support at 88.93, bring rally in larger degree wave C towards 150.00.
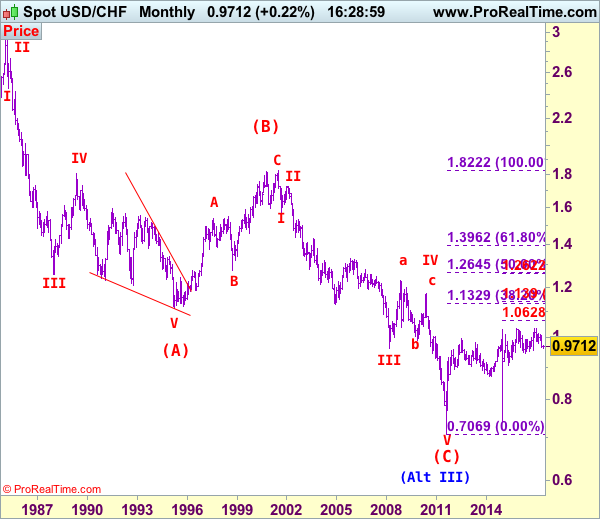
USD/CHF Elliott Wave Analysis
USD/CHF – 0.9673
USD/CHF – Wave IV ended at 1.1730 and wave V has possibly ended at 0.7068
The greenback did meet renewed selling interest at 0.9808 late last month and has fallen again (we recommended in our previous update to sell at 0.9800 and a short position was entered there), adding credence to our bearish view that the decline from 1.0344 top is still in progress, hence downside bias remains for this move to extend further weakness to 0.9600, however, near term oversold condition should prevent sharp fall below previous chart support at 0.9550 (Nov 2016 low) and price should stay well above another chart point at 0.944 (2016 low), risk from there is seen for a rebound to take place later.
Our preferred count on the daily chart is that early selloff to 0.9630 is an end of the larger degree wave III and major correction is unfolding from there with a leg ended at 1.2298 (Nov 2008 with (a): 1.0625, (b):1.0011 and (c):1.2298), wave b ended at 0.9910 with (a): 1.0370, (b): 1.1967, (c): 0.9910. The rise from there to 1.1730 is the wave c which also marked the end of wave IV and wave V has possibly ended at 0.7068.
On the upside, whilst initial recovery to 0.9720 cannot be ruled out, said resistance at 0.9808 should remain intact and bring another decline later. A daily close above this level would defer and suggest a temporary low is possibly formed instead, risk rebound to previous support at 0.9859m break there would add credence to this view, bring retracement of recent decline to 0.9900 but price should falter below 0.9955-60.
Recommendation: Hold short entered at 0.9800 for 0.9600 with stop above 0.9830
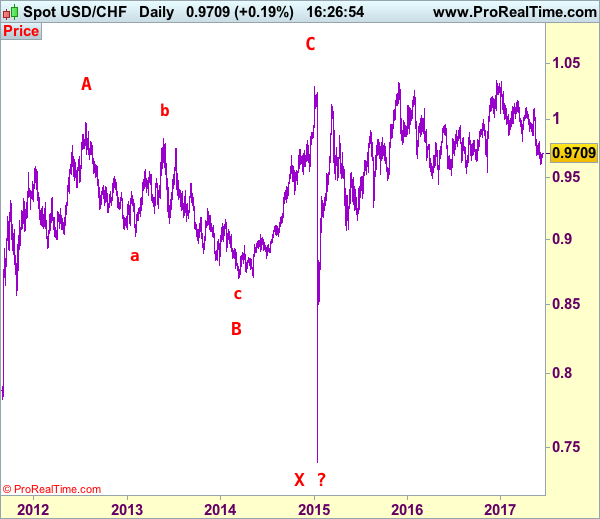
Dollar's long-term downtrend started from 2.9343 (Feb 1995) and it was unfolding as a (A)-(B)-(C) with (A): 1.1100, (B): 1.8310 (26 Oct 2000), then followed by another impulsive wave (C) with wave III ended at 0.9630 (Mar 2008). Under this count, correction in wave IV has possibly ended at 1.1730 and wave V already broke below support at 0.9630 and met indicated downside target at 0.7500 and 0.7400. The reversal from 0.7068 suggests the wave V has possibly ended and the breach of resistance at 0.9595 add credence to this view and indicated upside target at 1.0000 had been met, however, the sharp retreat from 1.0296 to 0.7401 suggests choppy trading would be seen but price should stay above said record low at 0.7068.
U.K. Parliament Is Hung, Drawn And Quartered
A disastrous night for the Conservatives as an electoral swing sees them lose their parliament majority with a hung House of Commons.
The headline says it all really, with GBP/USD falling 2.0 % in the Asia session with just about the worst outcome possible with Brexit negotiations to start next week. P.M. Theresa May is due to speak at 10 am London time this morning with speculation that she will resign becoming one of Britains shortest serving Prime Ministers.
One could say it is the Conservatives who have been hung drawn and quartered with Labour in a jubilant mood. Those readers who may be unfamiliar with the hung drawn and quartered term, it was a particularly gruesome way of being executed in the Middle Ages in Britain.
It is slightly surprising we are only lower by some 250 points on the day as yet again British electorate has surprised the Conservative incumbents within one year. The market may well be waiting to see if the Tories can form a minority government, although their potential partners, the Democratic Unionist Party (DUP) and the Scottish National Party (SNP) would demand a very soft Brexit as their price. It will probably be untenable to the Tories. In short, it's all a bit of a mess.
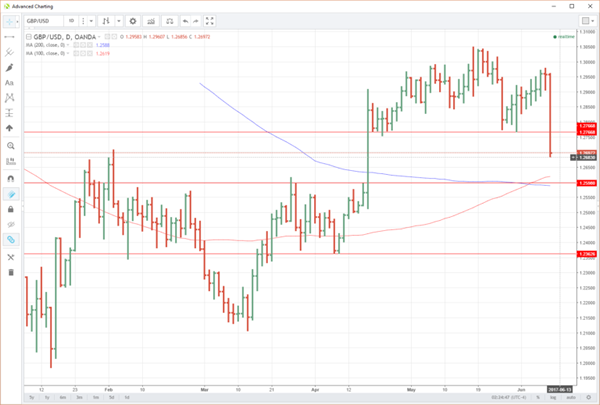
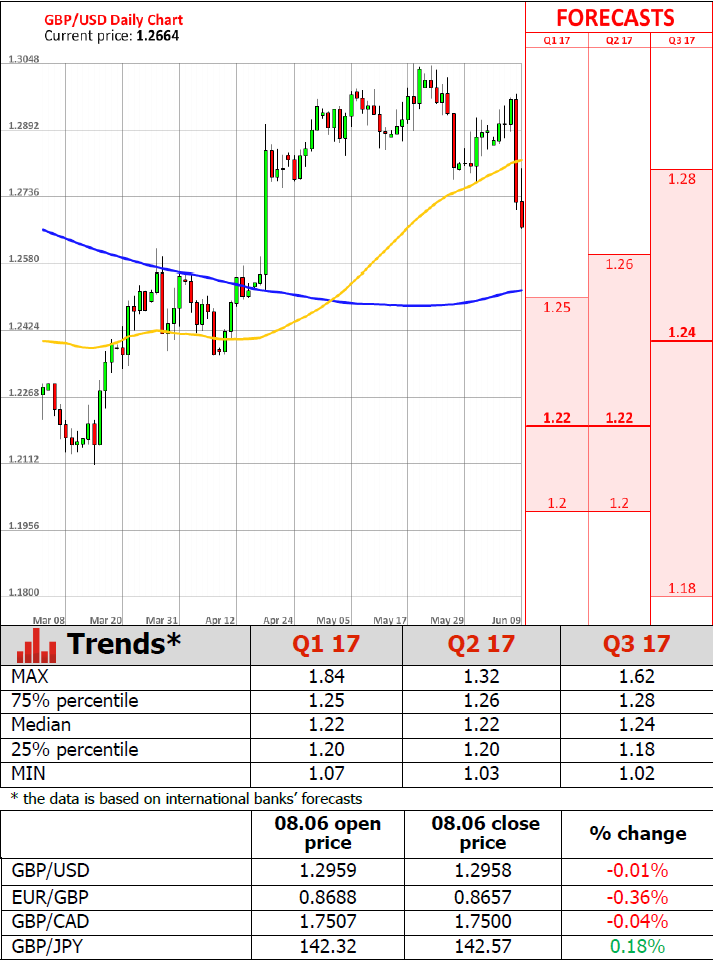
GBP/USD
The connotations will play out in due course starting with the Prime Minister's press conference at 10 am London. GBP/USD is flirting with support at 1.2700 into early European trading. The next support zone lies in the 1.2588/1.2619 area. It contains the 100-day moving average at 1.2619, a previous double top at 1.2600 and the 200-day moving average at 1.2588.
Resistance is at 1.2770 followed by 1.2960, which for the time being, will remain a distant memory.
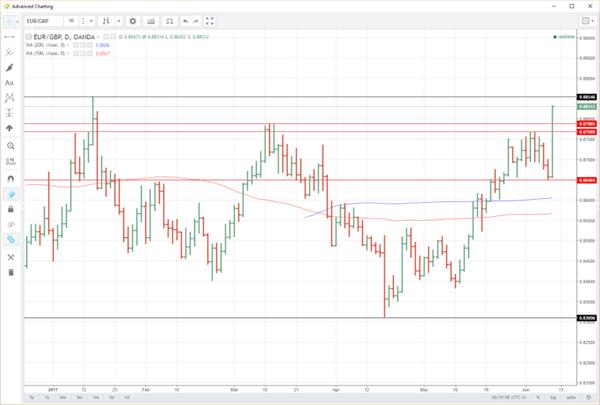
EUR/GBP
The halls of power in Europe must be rubbing their hands with glee this morning. The ECB's quantitative easing programme is increasingly showing it is working, dragging Eurozone growth and inflation of the floor. Now the Europeans will be able to turn off their game theory negotiating models as the British effectively yellow card themselves from the Brexit negotiations before they even start. The European's biggest worry right now will be if anyone from the other side will actually show up to the first session and who will that be?
The EUR/GBP has rocketed from 8650 to 8830 over the day moving through a series of previous daily highs which now become technical support.
EUR/GBP has support at 8790 and 8770, the March and June highs. After this, we see 8650 which will most likely remain a distant memory for now.
The next resistance is at 8855, the post-Brexit high. The charts, of course, look constructive, but we could possibly pause up here for a while as we have come a long way in a short time. Although, like the Conservatives, I do have a famous last word feeling about that call.
Summary
The United Kingdom's voters have answered Prime Minister Theresa's Mayday but turning around and sailing away. Her tenure must now be called into question there is no doubt, as will the makeup of the next government and the start of Brexit negotiations. Britain may well find itself back at the polls much sooner rather than later. Whichever way you look at it the uncertainty could see GBP bre-maining under pressure for some time to come.
UK Election, Exit Polls Suggest Theresa May Failed To Get Enough Votes
Market movers today
Focus today will be on the UK elect ion result and the many questions that have arisen after the election led to a 'hung parliament ' according to the polls, see Research UK: Hung parliament adds government risk premium to GBP.
There are only few economic data releases, with a range of trade balance figures published in the UK, Germany and Denmark. In the UK, manufacturing product ion for April and the NIESR GDP estimate for May are due out , which is usually a good predictor of actual GDP growth).
In Scandinavia, focus will be on the Norwegian core inflation print, which we estimate fell to 1.5% in May. Household consumpt ion data for Sweden is also due out , see next page.
Selected market news
In the UK election, exit polls suggest Theresa May failed to get enough votes to form a majority government. Instead, the UK is facing a 'hung parliament ' in which neither the Conservatives nor Labour has enough seats to rule a majority government . May's aim to get a stronger man date has backfired and the UK has been thrown into political turmoil shortly before Brexit negotiations with the EU start. The latestpoll showed the Conservatives getting 318 seats while 326 seats are needed for a majority.
GBP has weakened overnight and we should expect more depreciation pressure and volatility in the near term as uncertainty prevails (see next page). EUR/USD is slightly lower while other markets are fairly calm with little movement in Asian stocks or bond markets.
Many questions are still up in the air that markets will focus on today. (1) Will Theresa May resign or not? It seems like she might step down but that the Conservatives will hold on to power. If May steps down, who is going to be the new Tory leader? (A possible Tory leadership contestwhile the Brexit clock is ticking). (2) Will the new government changes its view on Brexit? Was the election a dismissal of hard Brexit or have Britons just moved on to domestic issues like austerity, social care and so forth? The new government has some thinking to do. (3) How stable will a new government be?
Overnight, Chinese inflation data showed a further drop in PPI inflation in May from 6.4% y/y to 5.5% y/y. On an m/m basis, PPI dropped for the second consecutive month after rising for nine straight months. The data highlights that China is again turning into a deflationary force after the reflation lastyear and in early 2017. CPI inflation showed a small rise to 1.5% from 1.2%.
At ye sterday's meeting, the ECB changed forward guidance on policy rates as it no longer expects these to go to 'lower l evels'. The rest of the forward guidance was left unchanged, implying that the ECB now expects policy rates 'to remain at their present levels for an extended period of time, and well past the horizon of the net asset purchases'. See ECB Review: Slightly less dovish forward guidance, 8 June.
Trade Idea: EUR/JPY – Stand aside
EUR/JPY - 123.39
Recent wave: wave v of (C) ended at 94.12 and major correction in wave A has ended at 149.79
Trend: Near term up
New strategy :
Stand aside
Position: -
Target: -
Stop:-
Despite falling to 122.63 earlier this week, the subsequent rebound after holding above previous support at 122.56 has retained our view that further consolidation would be seen and recovery to 124.10-20 cannot be ruled out, however, break of 124.70-75 is needed to signal the retreat from 125.81 has ended, bring a stronger rebound to 125.00 but resistance at 125.31 should remain intact, bring retreat later.
On the downside, below said support at 122.56-63 would signal another leg of corrective decline from 125.82 top is underway for retracement of early upmove to 122.00, then towards 121.25-30 but oversold condition should limit downside and reckon latter level would remain intact, bring rebound later.
Our latest preferred count is that wave (ii) is ABC-X-ABC which ended at 123.33 and wave (iii) is unfolding with wave iii ended at 100.77, followed by wave iv at 111.57 and wave v as well as the wave (iii) has ended at 97.04, followed by wave (iv) at 111.43 and wave (v) has ended at 94.12 which is also the end of the larger degree v, this also implied the major wave (C) has also ended there, hence major correction has commenced from there with (A) leg unfolding in its lower degree wave c which has possibly ended at 145.69. Under this count, A-B-C wave (B) has commenced with A leg ended at 136.23, wave B at 143.79 and wave C has possibly ended at 149.79.
Our larger degree count is that the decline from 139.26 is wave (C) and is sub-divided into a diagonal triangle i-ii-iii-iv-v with wave i - 105.44, wave ii- 123.33, wave iii - 97.03, wave iv - 111.43, followed by the final wave v as well as the end of wave (C) at 94.12, this also mark the bottom of larger degree wave B. Under this count, major rise in wave C has commenced as an impulsive wave with minor wave III ended at 145.69, wave V is still in progress for further gain to 150.00. Having said that, this so-called wave V could well be the first leg of larger degree 5-waver wave C and this wave C should bring at least a retest of wave A top at 169.97 (July 2008).
Trade Idea: AUD/USD – Buy at 0.7500
AUD/USD – 0.7541
Recent wave: Wave 5 ended at 1.1081 and major correction has commenced for fall to 0.7000 and then towards 0.6500-10
Trend: Near term down
Original strategy :
Buy at 0.7500, Target: 0.7650, Stop: 0.7440
Position: -
Target: -
Stop: -
New strategy :
Buy at 0.7500, Target: 0.7650, Stop: 0.7440
Position: -
Target: -
Stop:-
Aussie’s retreat after rising to 0.7567 earlier this week suggests consolidation below this level would be seen and pullback to previous resistance at 0.7518 is likely, however,r reckon 0.7500 would limit downside and bring another rise later, above said resistance would extend the rise from 0.7329 low towards 0.7592, then test of resistance at 0.7611 but break of latter level is needed add credence to this bullish count and encourage for subsequent upmove towards resistance at 0.7680 but price should falter below chart point at 0.7750.
In view of this, we are looking to buy aussie on dips as 0.7500 should limit downside and bring another rise. Below support at 0.7457 would abort and suggest top is possibly formed, bring weakness to 0.7415-20 but price should stay well above key support at 0.7372, bring another rebound later.
On the 4-hour chart, the move from 0.8066 is the wave 5 with i: 0.8860, ii: 0.8315, wave iii is an extended move ended at 1.0183, iv: 0.9706 and wave v has ended at 1.1081 (also the top of entire wave 5). The subsequent selloff is the major correction which is unfolding as ABC-X-ABC and 2nd A leg has ended at 0.8848, followed by a-b-c wave B which ended at 0.9758, hence, 2nd C wave is now in progress and indicated downside target at 0.7000 and 0.6950 had been met, so further fall to 0.6710-20 cannot be ruled out.

British Prime Minister Theresa May’s Conservatives Lose Majority
'We have seen two dramatic political miscalculations by two conservative (UK) PMs in a short time span, it's incredible.' - Heather Conley, Center for Strategic and International Studies
The preliminary results of the UK General Election held on June 8 showed that the ruling Conservative Party led by the British Prime Minister Theresa May gained 297 seats, whereas its closest rival – the Labour Party led by Jeremy Corbyn – won 252 seats. In the meantime, the Scottish National Party gained 34 seats, the Liberal Democrats – 11 seats, and the Democratic Unionist Party – 10 seats. According to the BBC, the voter turnout rate was at 68.6%. In order to secure a parliamentary majority, it is necessary to gain at least 326 seats. An exit poll release on Thursday showed that the Tories would win the largest number of seats but lose its majority. According to analysts, the following outcome is set to hurt badly the upcoming Brexit negotiation. The BBS estimated that Theresa May's Conservatives would get 318 seats, whereas the Labour Party – 262. Thus, Britain is on course for a hung parliament, meaning that if no party secures a majority, the Labour and the Conservatives will need to make deals with the smaller parties to form a coalition. The Sterling dropped markedly, briefly hitting its one-month low of $1.72.
European Central Bank Signals No More Rate Cuts
'There was really no justification for the ECB to keep on holding on to that reference of the possibility of lower rates.' — Vasileios Gkionakis, UniCredit SpA
As markets expected, the European Central Bank left its interest rates and monetary policy unchanged at its Thursday meeting; however, it signalled that further rate cuts were highly unlikely. Policymakers acknowledged that the 19-country currency bloc was performing strong economically but inflation remained growth remained subdued, forcing the Bank to keep rates and policy on hold. However, policymakers gave a balanced view on the Euro zone economy. Still, the ECB did not even consider an option of lowering its 2.3T euro asset purchases. Even though policymakers predicted solid economic growth, they revised down its inflation forecast for the current year to 1.5%, down from the originally predicted 1.7% rate. Moreover, according to the Bank's forecasts, inflation is unlikely to rise above 1.6% in 2019. Meanwhile, the Euro zone economy is expected to grow 1.9% in 2017. Back in the Q1 of 2017, the region's economy expanded 0.6% on a quarterly basis and 1.9% on a yearly basis. In September, policymakers will need to decide whether to extend the QE programme or not.
Initial Jobless Claims Fall Less Than Expected Last Week
'Labor market supply constraints are expected to bite into job creation but should also help to keep a lid on jobless claims as employers focus on retaining talent, so long as the economy continues to chug along.' — Jim Baird, Plante Moran Financial Advisors
The number of Americans filing for unemployment aid dropped less than expected in the week ended June 2. The Labour Department reported on Thursday that initial jobless claims fell 10K to 245K last week, following the preceding week's upwardly revised figure of 255K. Meanwhile, market analysts anticipated a bigger decrease to 241K during the reported week. Nevertheless, claims remained below the 300K level for the 118th consecutive week, the longest streak since 1973. The four-week moving average of claims, considered a better measure of the existing labour market trends, rose 2.25K to 242K during the reported week. Earlier this week, the Labour Department reported that job openings hit their new high in April, whereas the NFP report released last Friday showed a slowdown in job growth. It may be suggested that employers are facing difficulty of finding suitable workers. Thursday's data also showed that continuous claims dropped 2K to 1.92M in the week ending May 27, whereas their four-week moving average declined 750 to 1.91M, the lowest level since January 1974.
Foreign Exchange Market Commentary: EUR/USD, USD/JPY, GBP/USD, GOLD, WTI CRUDE, DJIA, FTSE100, DAX
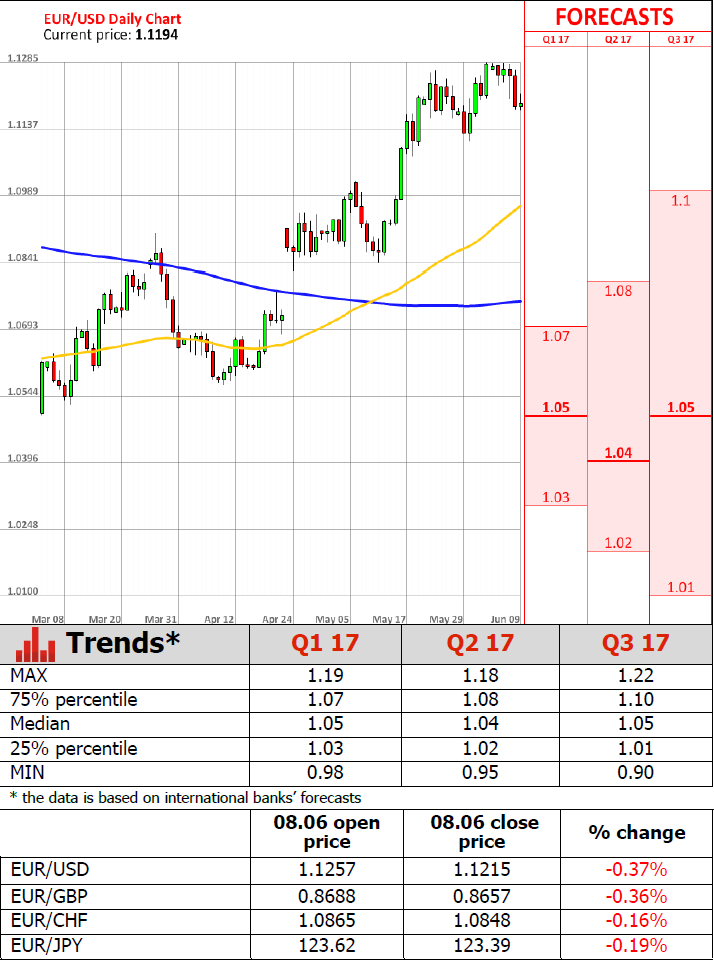
EUR/USD
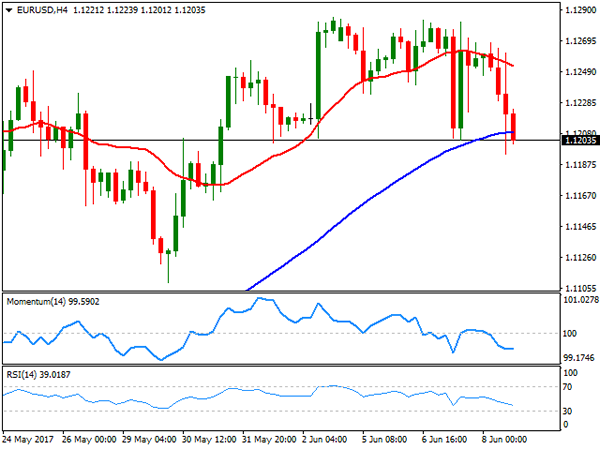
The EUR/USD pair closed the day a couple of pips above the 1.1200 level and having traded as low as 1.1194, weighed mostly by a disappointing ECB, and after Comey's testimony before a US Senate special committee brought nothing new. The European Central Bank left its benchmark interest rate unchanged as largely expected, accompanying the decision with a mixed statement, less hawkish, however, than what markets were expecting. Despite saying that the risk in the region is now broadly balance, while removing references to lower rates, policymakers left doors opened for further QE, and downgraded inflation projections for the this year and the next, with 2017 inflation now seen at 1.5% from previous 1.7%.
Former FBI director Comey repeatedly called liar US President Trump, saying that's not his place to determinate whether there was obstruction of justice or not, but also said that he perceived Trump's request to drop Flynn probe as an order. Most of what Comey said was already known by the country, with stocks rallying on relief, and the greenback benefiting from the move, albeit so far, dollar's advance seems barely corrective.
From a technical point of view, and in the short term, the pair is poised to fall further, as in the 4 hours chart, a bearish 20 SMA contained advances, whilst the price battles around a bullish 100 SMA, and the RSI indicator heads south around 40. In the wider view, however, the risk of a stepper decline remains limited, as only below 1.1080 an interim top would be confirmed.
Support levels: 1.1160 1.1120 1.1080
Resistance levels1.1250 1.1300 1.1345
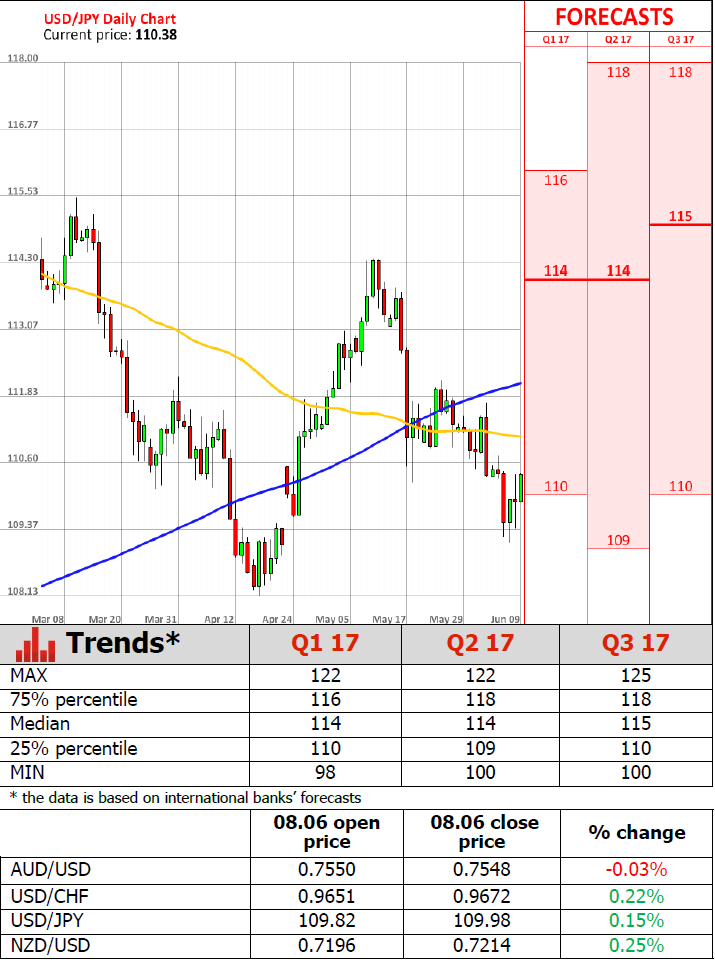
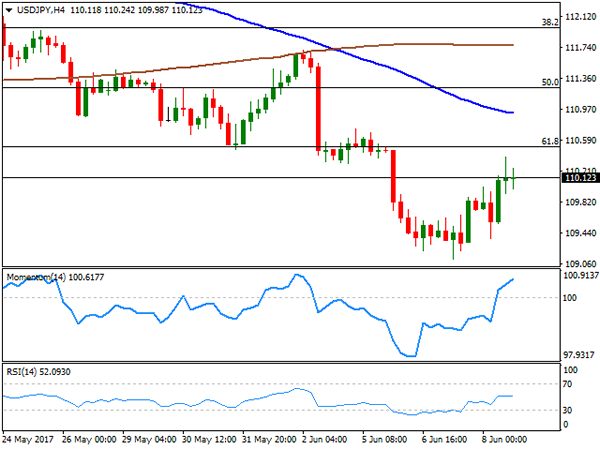
USD/JPY
The USD/JPY pair advanced for a second consecutive day, up intraday to 110.38, level that reached ahead of US opening, and from where it retreated after the release of US soft employment data. Weekly unemployment claims in the US came in at 245K, worse than the 240K expected for the week ended June 2nd, capping dollar's intraday advance. Weighing on the Japanese currency was a strong downward revision to Q1 GDP, down to 1.0% from an initial estimate of 2.2% and well below the expected 2.4%. Higher US yields, also helped the pair holding above 110.00. The positive tone seen over the past two days is far from enough to call for an interim bottom, as the recovery stalled short from the key resistance at 110.50, the 61.8% retracement of the latest daily bullish run. Furthermore, the 4 hours chart shows that the 100 SMA maintains its bearish slope well above the mentioned Fibo level, while the RSI indicator turned flat around 51, and the Momentum losses upward strength, but remains within positive territory. Beyond the mentioned static resistance, the pair can extend its upward corrective movement up to 111.60, but would take an unlikely weekly close beyond 112.00 to consider a bullish extension for next week.
Support levels: 109.50 109.10 108.85
Resistance levels: 110.50 111.00 111.60
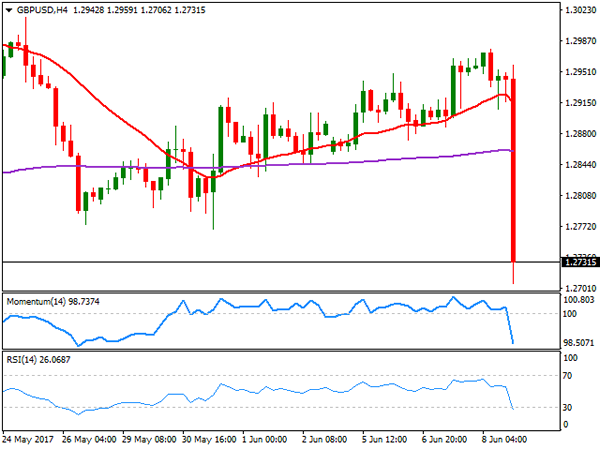
GBP/USD
The GBP/USD pair plunged over 200 pips after the UK election's exit polls suggest the kingdom will end with a hung Parliament. The pair tumbled after the initial results showed that Conservatives are likely to get 314 seats, 12 short of majority, and down from current 330, whilst opposition Labor is now at 266 seats, up from previous 229 before the election. It's going to be a long night in the UK as the results are preliminary estimates, but the harm is done. Despite keeping the lead, this is a defeat for PM May ahead of Brexit negotiations, which will start on June 19th, as she was looking for popular support with this election, and clearly she didn't get it. If the final results confirm a hung parliament, PM May may have to resign. Technically speaking, and initial bounce after bottoming at 1.2706 was contained by selling interest at 1.2756, the lowest the pair traded ever since May called for the snap election, quite significantly bearish. In the 4 hours chart, the price has broken clearly below all of its moving averages, whilst technical indicators head south almost vertically after the large slide, entering oversold territory. 1.2705 is February 's high, the immediate support for the upcoming hours, and the level to surpass to confirm additional declines that can extend down to 1.2500 this Friday.
Support levels: 1.2705 1.2660 1.2620
Resistance levels: 1.2756 1.2800 1.2840
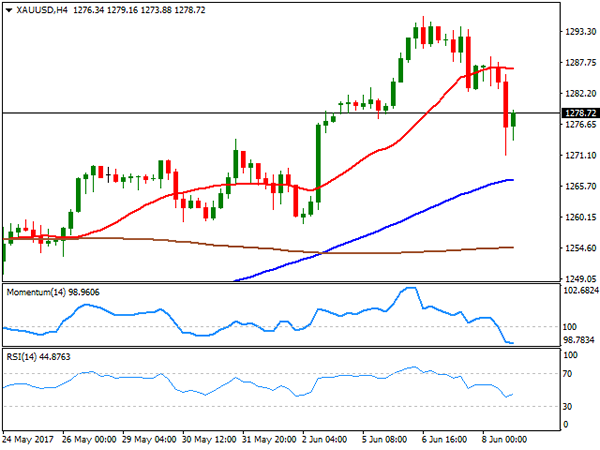
GOLD
Gold prices edged sharply lower, with spot settling at $1,278.40 a troy ounce, its lowest close for the week after trading as low as 1,271.25. The dollar edged higher against most of its major rivals following ECB's monetary policy announcement, which fell short from indicating normalization is on the Central Bank agenda. The ECB partially dropped its easing bias, by removing the reference to lowering rates, but maintained QE alive and kicking, while downgrading inflation forecasts for this year and the coming ones. The daily chart shows that the commodity held above a still bullish 20 DMA, currently at 1,267.20, while technical indicators retreated within positive territory, but with limited downward momentum. In the 4 hours chart, however, the technical outlook is bearish, as the metal trades below a flat 20 SMA, whilst the RSI indicator consolidates around 45 and the Momentum indicator heads south at fresh one month low, supporting additional declines for this Friday.
Support levels: 1,271.25 1,259.00 1,249.80
Resistance levels: 1,282.60 1,295.90 1,303.10
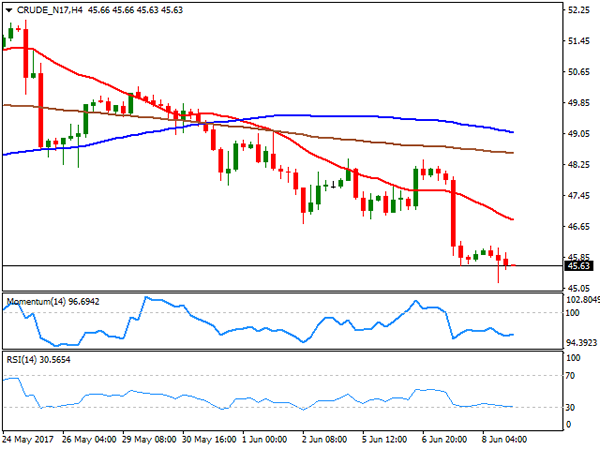
WTI CRUDE OIL
Crude oil prices remained under selling pressure with West Texas Intermediate futures settling at $45.63 a barrel, still weighed by concerns about an oversupplied market. OPEC's efforts to trim production are being overshadow by a continued increase in US production, fueled by latest US stockpiles data showing a large surge in US inventories. Dollar's intraday strength added to the bearish case of the commodity, which is now poised to extend its decline according to technical readings, as in the daily chart, technical indicators maintain their sharp bearish slopes within negative territory, whilst the 20 DMA gains bearish strength far above the current level. In the 4 hours chart, the 20 SMA has accelerated its decline below the largest, presenting a strong bearish slope, whilst technical indicators hold near oversold territory, with limited downward strength at the time being, but still supporting a downward extension for this last day of the month.
Support levels: 45.20 44.60 44.00
Resistance levels: 46.35 47.10 47.90
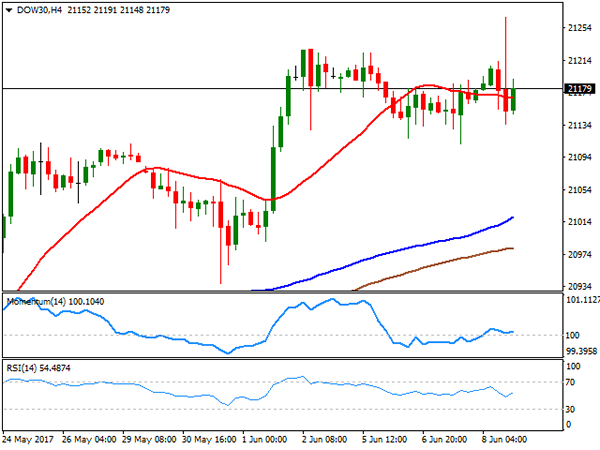
DJIA
US indexes closed with modest gains and off their daily highs, with the Dow Jones Industrial Average up roughly 9 points, to close at 21,182.53, while the Nasdaq Composite ended at 6,321.76, up by 24 points, a new record close. The S&P ended pretty much flat at 2,433.79, up 0.03%. The Dow peaked at 21,267 intraday, a record high, following former FBI director Comey statement, as despite critiquing President Trump, his tone was extremely cautious, and not enough to revive impeachment speculations. Supporting the advance in US stocks was Alibaba that soared 13% after forecasting sales growth of nearly 50%. Within the DJIA, Goldman Sachs led advancers with a 1.55% gain, followed by Caterpillar that added 1.50%. Walt Disney was the worst performer, down 1.48%. The technical stance is little changed due to the limited intraday range, with the index holding above its moving averages in the daily chart, and technical indicators holding within positive territory. Shorter term, and according to the 4 hours chart, the neutral stance persist, with the index hovering around a flat 20 SMA the Momentum heading nowhere around its 100 level, and the RSI aiming higher around 54.
Support levels: 21,125 20,080 20,041
Resistance levels: 21,228 21,267 21,300
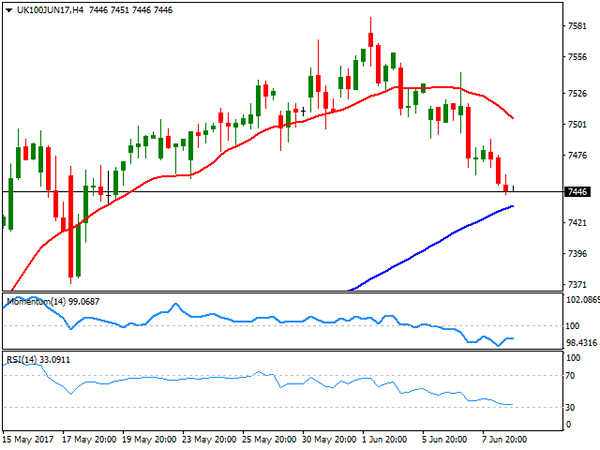
FTSE100
The FTSE 100 settled at 7,449.98, down 28 points this Thursday, weighed by a stronger Pound and as the UK went to polls. Uncertainty over the result of the election weighed on investors' mood, while the absence of corporate news help maintaining the index within a limited range. Ashtead Group was the best performer, up 3.02%, followed by Glencore which added 2.08%. Imperial Brands led decliners with a2.19% lost, followed by Diageo that shed 1.93%. Randgold Resources also edged lower amid falling gold prices, shedding 1.90%. Ahead of the result of elections, the daily chart for the index seems poised to decline, as technical indicators head south around their mid-lines, whilst the index remained contained by its 20 DMA. In the 4 hours chart, the technical bias is also towards the downside, as the 20 SMA accelerated its decline above the current level, whilst technical indicators have barely managed to recover within negative territory, not enough to support further recoveries. Nevertheless, Friday's direction will depend solely on the outcome of the election, and how PM May ends poised to deal with the Brexit.
Support levels: 7,445 7,405 7,368
Resistance levels: 7,508 7,541 7,588
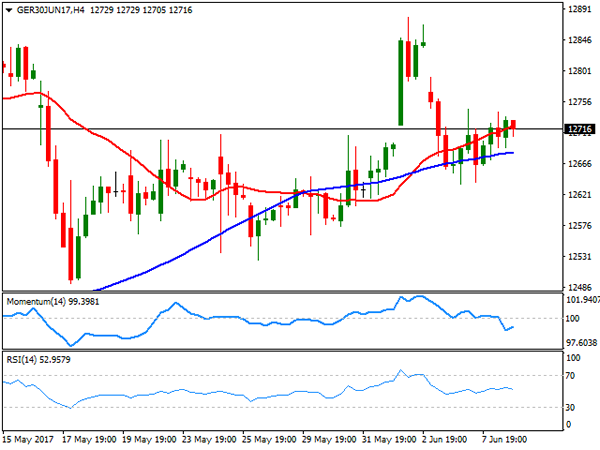
DAX
European equities closed modestly higher, but little changed with the German DAX settling at 12,713.58, up by 41 points or 0.32% higher. A weaker EUR also helped local shares advance, whilst particularly the German benchmark benefited from strong local data, as Industrial Production surged in April by more than expected, up 0.8% when compared to March and by 2.9% from a year earlier. Within the DAX, ThyssenKrupp was the best performer that closed up 3.66%, followed by E.ON that added 3.53%. Adidas topped losers' list with a 1.6% decline, followed by Vonovia that closed 1.49% lower. Technically, the index maintains a neutral stance, with the index above a horizontal 20 DMA, and technical indicators hovering above their mid-lines, with no directional strength. In the 4 hours chart, the index keeps hovering around its 20 and 100 SMAs, both within a tight range, whilst the Momentum indicator heading marginally higher within positive territory and the RSI indicator consolidating around 53, failing to provide clear directional clues.
Support levels: 12,671 12,620 12,575
Resistance levels: 12,745 12,791 12,834