Sample Category Title
EUR/JPY Monitoring Support At 122.56, EUR/GBP Sharp Increase, EUR/CHF Continued Weakness.
EUR/JPY Monitoring support at 122.56.
EUR/JPY is trading lower. Hourly support is given at 122.56 (18/05/2017 low). Hourly resistance can be found at 125.82 (16/05/2017 high). Major support is given at 114.90 (18/04/2017low).
In the longer term, the technical structure validates a medium-term succession of lower highs and lower lows. As a result, the resistance at 149.78 (08/12/2014 high) has likely marked the end of the rise that started in July 2012. Strong support at 94.12 (24/07/2012 low) looks nonetheless far away.
EUR/GBP Sharp increase.
EUR/GBP has broken resistance at 0.8787 (13/03/2017 high). The pair keeps on going lower. Strong support can be found at 0.8304 (05/12/2017 low).
In the long-term, the pair has largely recovered from recent lows in 2015. The technical structure suggests a growing upside momentum. The pair is trading above from its 200 DMA. Strong resistance can be found at 0.9500 psychological level.
EUR/CHF Continued weakness.
EUR/CHF is trading lower. The pair has broken support given at 1.0866 (18/05/2017 low). We believe that the medium-term pattern suggests us to see continued bearish pressures towards hourly support that can be found at 1.0792 (03/05/2017 low).
In the longer term, the technical structure is mixed. Resistance can be found at 1.1200 (04/02/2015 high). Yet,the ECB's QE programme is likely to cause persistent selling pressures on the euro, which should weigh on EUR/CHF. Supports can be found at 1.0184 (28/01/2015 low) and 1.0082 (27/01/2015 low).
USD/JPY Strengthening, USD/CAD Back Within Former Short-Term Uptrend Channel, AUD/USD Consolidating.
USD/JPY Strengthening.
USD/JPY is trading higher. The pair is bouncing back. Hourly support can be found at 109.12 (07/06/2017 high). Strong support is located at 108.13 (17/04/2017 low). Hourly resistance is given at 112.13 (24/05/2017 high). Other key supports lie at a distance 106.04 (11/11/2016 low). Wide-open for further increase.
We favor a long-term bearish bias. Support is now given at 96.57 (10/08/2013 low). A gradual rise towards the major resistance at 135.15 (01/02/2002 high) seems absolutely unlikely. Expected to decline further support at 93.79 (13/06/2013 low).
USD/CAD Back within former short-term uptrend channel.
USD/CAD is trading higher. Hourly support can be found at 1.3424 (28/05/2017 low) then 1.3388 (25/01/2017 high). Bullish pressures are set to continue.
In the longer term, there is now a death cross with the 50 dma crossing below the 200 dma indicating further downside pressures. Strong resistance is given at 1.4690 (22/01/2016 high). Long-term support can be found at 1.2461 (16/03/2015 low).
AUD/USD Consolidating.
AUD/USD is pushing higher since the pair has failed to reach hourly support given at 0.7329 (09/05/2017 low). As long as prices remain below resistance at 0.7608 (17/04/2017 high), there are nonetheless strong downside risks.
In the long-term, we are waiting for further signs that the current downtrend is ending. Key supports stand at 0.6009 (31/10/2008 low) . A break of the key resistance at 0.8295 (15/01/2015 high) is needed to invalidate our long-term bearish view.
EUR/USD Short-Term Weakness, GBP/USD Sharp Decline, USD/JPY Strengthening.
EUR/USD Short-term weakness.
EUR/USD is consolidating below strong resistance given at 1.1300 (09/11/2017 high). Hourly support is given at 1.1110 (22/05/2017 low) has been broken. Stronger support lies at 1.0842 (11/05/2017 low) and key support is given at 1.0494 (22/02/2017 low). Expected to show renewed bullish pressures.
In the longer term, the death cross late October indicated a further bearish bias. The pair has broken key support given at 1.0458 (16/03/2015 low). Key resistance holds at 1.1714 (24/08/2015 high). Expected to head towards parity.
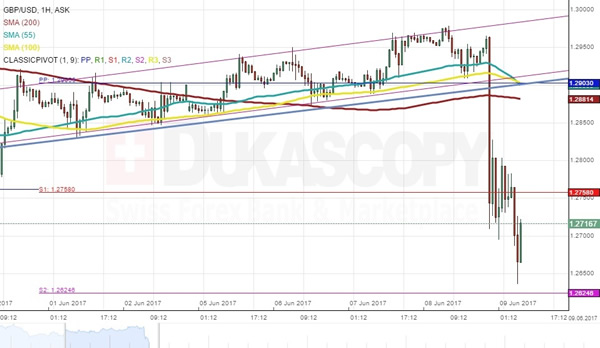
GBP/USD Sharp decline.
GBP/USD has broken sharply hourly support given at 1.2757 (21/04/2017 low). Hourly resistance lies at 1.3046 (18/05/2017 high). Expected to show further decline.
The long-term technical pattern is even more negative since the Brexit vote has paved the way for further decline. Long-term support given at 1.0520 (01/03/85) represents a decent target. Long-term resistance is given at 1.5018 (24/06/2015) and would indicate a long-term reversal in the negative trend. Yet, it is very unlikely at the moment.
USD/JPY Strengthening.
USD/JPY is trading higher. The pair is bouncing back. Hourly support can be found at 109.12 (07/06/2017 high). Strong support is located at 108.13 (17/04/2017 low). Hourly resistance is given at 112.13 (24/05/2017 high). Other key supports lie at a distance 106.04 (11/11/2016 low). Wide-open for further increase.
We favor a long-term bearish bias. Support is now given at 96.57 (10/08/2013 low). A gradual rise towards the major resistance at 135.15 (01/02/2002 high) seems absolutely unlikely. Expected to decline further support at 93.79 (13/06/2013 low).
Hung Parliament Shock Markets And Hit GBP
Updated seats breakdown of UK general election so far is: Conservatives 318, Labour 261, SNP 35, Liberal Democrats 12 other parties 23. The approval ratings for the Tories and Labour are around 42.4% and 40.1% respectively. The turnout ratio was 68.7%, up 2.6% from 2015 but down 3.5% on the Brexit referendum.
Although the calculation process is still ongoing the Conservative Party is expected to win 319 seats in the end.
The Tories have lost their majority in the House of Commons – this was an unexpected and disappointing outcome – with 318 seats currently. Labour have gained 32 more seats with 261 seats as of this report. Surprisingly the SNP lost 19 seats to the Tories and not Labour – this makes a second Scottish referendum highly unlikely. Not unsurprising was that UKIP lost all their seats.
Theresa May had hoped to increase her Governments majority by calling this snap election to ensure a stronger position in the Brexit negotiation process. Surprisingly the result means that, although the Conservative party is still the biggest party, a loss of seats has resulted in them losing their majority.
Theresa May's big gamble has, ironically, failed. Reasons for the failure will abound but many are referencing a poor campaign. Theresa May received criticism for not taking part in a televised debate and a manifesto pledge to cut social benefits whereas Jeremy Corbyn rallied the younger vote (18 to 34 year olds) with a Social Welfare biased manifesto.
Theresa May has stated that she will not resign, however, she is facing increased pressure to do so because of the disappointing result. If Theresa May does resign there is growing speculation that Boris Johnson, or Amber Rudd, may become the next Prime Minister. Regardless of who is Prime Minister the first task of the Tories will be to form a coalition, most likely with the Democratic Unionist Party who hold 10 seats.
Potential hurdles and disagreements caused by the lack of a majority in the Parliament are foreseeable and inevitable. It will likely result in the Brexit negotiation process being even more difficult.
Following the Exit Polls that were released at 22:00 BST last night GBP/USD marked the biggest intra-day fall of 250 pips (2.44%) since October 7th, dropping from above 1.29 and hitting a low of 1.2634. On Friday, in the early European session, Cable saw a moderate rebound and currently holding above 1.2700, where there is stronger support.
EUR/GBP marked the biggest intra-day gain of 2.4% since October 7th, hitting a high of 0.8858, last seen on November 9th. The price saw a moderate correction and currently trading around the psychological level at 0.8800.
GBP/JPY plunged 2%, hitting a low of 139.50, last seen on April 21. The downtrend was held above the support line at 139.50.
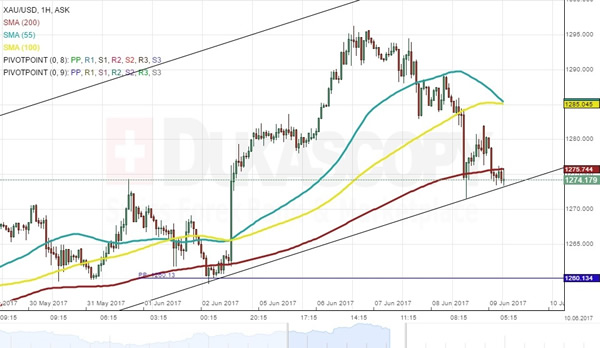
Gold Analysis: Reaches Significant Support
During the early hours of Friday's trading session the yellow metal was located near the lower trend line of the medium term ascending channel pattern near the 1,274 level. The metal was facing the resistance of the 200-hour SMA, which was pushing the commodity price into the support level. Due to that reason it is yet to be seen whether the pattern holds its ground. However, it is more likely that it will hold, as no significant fundamental changed have occurred in the world. Moreover, the recent political turmoil in the US has increased. Although, if the trend line is broken a fall down to the monthly PP at the 1,260.13 level will be a high probability. Meanwhile, in the case of breaking free from the 200-hour SMA the bullion might jump to the 1,285 mark.
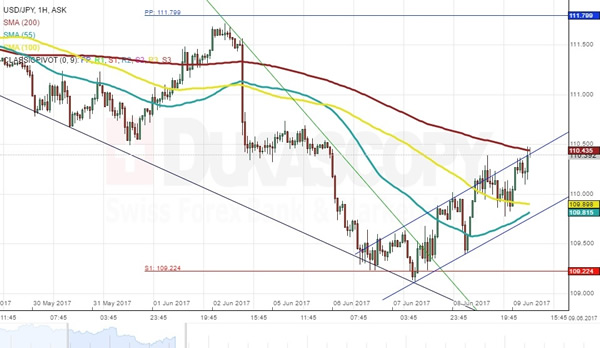
USD/JPY Analysis: To Slide Back To 110.00
The USD/JPY currency pair confirmed the ascending channel pattern with its recovery from the 109.40 area, with the exchange rate now continuing to test the upper boundary. The trend-line is now also coinciding with the 200-hour SMA, which altogether should cause the Buck to slightly weaken against the Yen, allowing the pair to slide back to 110.00, thus, retesting the pattern's support line. Technical indicators in all timeframes support this possibility, but before this scenario plays out temporary volatility breaches to the upside could occur, due to yesterday's excessive USD-buying. The majority, namely 62%, are still buying the Greenback, although it is still far from being overbought, which could mean bad news for the channel, as upside breakout risks emerge.
GBP/USD Analysis: Plummets After Election Results
The UK Parliamentary Election results had a devastating effect on the Pound, causing it to trim all previous month's gains against the Buck. Even though the bearish momentum should now persist, the Sterling still has a chance to undergo a corrective recovery. The RSI indicator is near its lower border, which suggests the bullish trend is about to return. However, no solid supports are present to help achieve this goal, the only nearest one being the monthly S1 at 1.2624. On a larger scale the bearish development is not a surprise, as the breach of the wedge's support line was anticipated. In case losses do continue to take place, a solid turnaround points are around 1.26 and 1.2550.
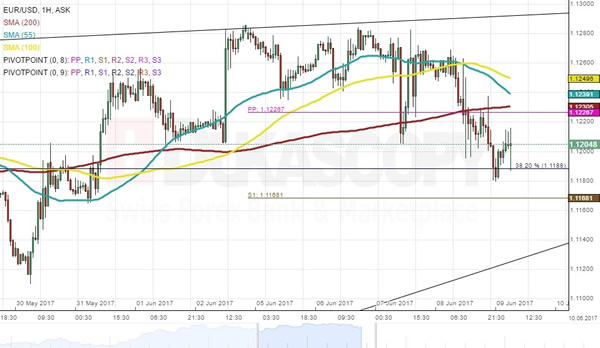
EUR/USD Analysis: Falls Below 1.12 Mark
The European Central Bank did not change its policy on Thursday. However, the release of the suspense was enough to cause the reveal of the future direction of the EUR/USD currency exchange rate. The pair began to move lower, as it passed the support of the weekly PP at 1.1227 until it reached the support of the 38.20% Fibonacci retracement level at the 1.1188 mark. By having a glance at the movements of the pair during the past few trading sessions it can be assumed that the rebound from the retracement level is a marking of the first point in a short term pattern. The pattern is most likely going to guide the pair lower to the medium term ascending channel's lower trend line, which on Friday was close to the 1.1140 level.
Technical Outlook: FTSE100 Bounced On Weaker Pound, Signals Of Correction End Turn Near-Term Focus Higher
FTSE100 bounced strongly on Friday, backed by significantly weaker pound after election results were out. The index spiked to session high at 7544 in early hours of European trading, on bounce from 7410 low, hit after market opening.
Today’s bounce retraced 76.4% of 0.7587/7410 pullback, signaling that correction may be over. Strong support at 7517 (Fibo 38.2% of 7143/7587 upleg) managed to contain dip as expected,
with fresh upside attempts seen after correction. Pullback from session high at 7544 found support at 7477 (4-hr cloud base / 50% retracement of today’s 7410/7544 rally), which is expected to hold and keep fresh near-term bulls intact.
Slow Stochastic on daily chart is emerging from oversold territory and supports scenario of fresh upside action for full retracement of 7587/7140 corrective phase and possible extension higher, as outlook for pound looks negative on rising political uncertainty after UK election.
Res: 7512, 7544, 7570, 7587
Sup: 7477, 7461, 7431, 7410
Technical Outlook: AUDUSD – Extended Consolidation Between 100/200SMA’s But Risk Of Deeper Pullback In Play
Strong four-day recovery from 0.7369 (02 June low) is showing initial signs of stall after rally peaked at 0.7566 on Wednesday and is holding in range between 200SMA (0.7527) and 100SMA (0.7556) for the second day. The Aussie is expected to maintain firm tone while 200SMA is holding that may result in prolonged consolidation. On the other side, increased risk of pullback is expected on firm break below 200SMA which may extend towards next significant supports at 0.7496/91 (55SM/Fibo 38.2% of 0.7369/0.7566 upleg). Slow stochastic is turning lower in overbought territory on daily chart and would support scenario on reversal.
Res: 0.7556, 0.7585, 0.7610, 0.7664
Sup: 0.7527, 0.7495, 0.7468, 0.7476