
Sample Category Title
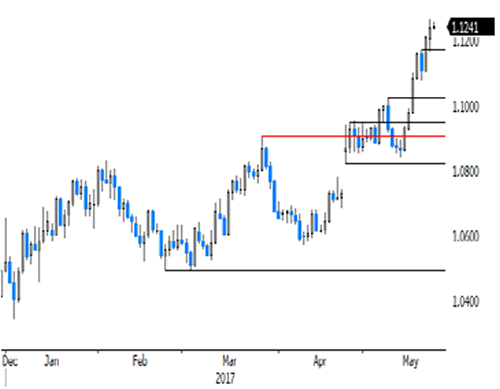
Dollar Continues To Slide As EURUSD Rises To A Fresh 6-Month High
The greenback continued to weaken against some of the major currencies yesterday amid a quiet trading day. The New Zealand dollar rose as much as 1% on the day, rising to a three-week high while the price action was a lot more subdued against the yen.
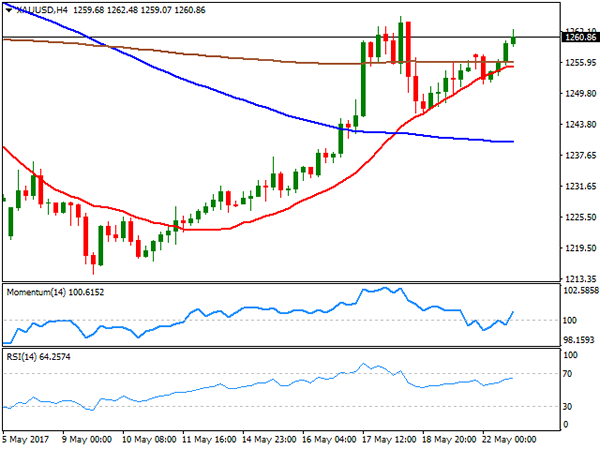
Gold prices were seen rallying back to test the previous highs at 1261, while crude oil prices managed to maintain the strong momentum, with prices supported above $50 handle.
Looking ahead, the economic data today includes flash manufacturing and services PMI from the eurozone and the US, due to be released by Markit. The BoE's inflation report hearings are also due today, while in the US trading session a number of Fed members are due to speak.
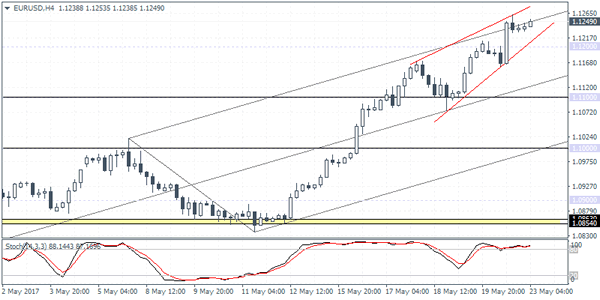
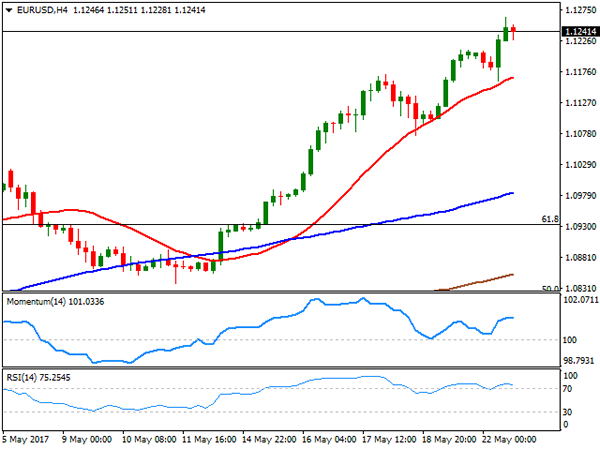
EURUSD intraday analysis
EURUSD (1.1249): The euro got a boost unexpectedly yesterday as the German chancellor, Angela Merkel said that the "euro was too weak" blaming the ECB's monetary policies.
The euro jumped higher on the day as a result and comfortably closed above the $1.1200 handle yesterday. Immediate support is seen at 1.1200 with further upside likely to see price consolidate near the 1.1250 handle. However, a break down below 1.1200 will trigger the next support level at 1.1100 region.
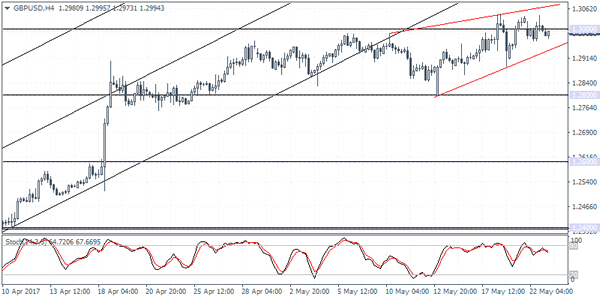
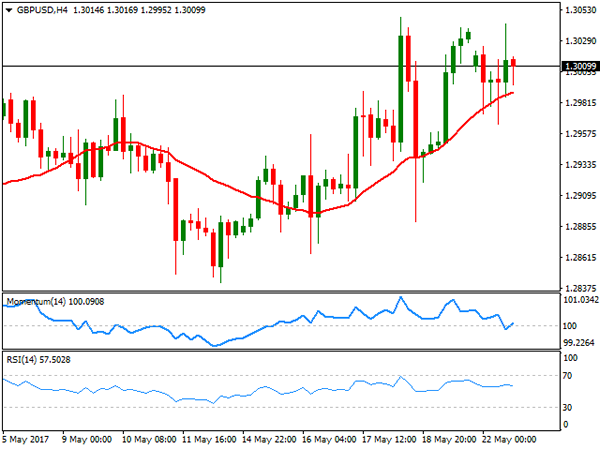
GBPUSD intraday analysis
GBPUSD (1.2994): The British pound close in a doji yesterday near 1.3000 handle. A bearish close today is required for price action to push lower.
There is a strong chance that the GBPUSD will signal a correction towards the long pending test of support at 1.2600. On the 4-hour chart, watch for the possible rising wedge pattern that is being formed. A breakout to the downside will signal an initial decline towards 1.2800 support. The Bank of England's inflation report hearings will be held today where Gov. Carney's comments could bring some volatility to the British pound.
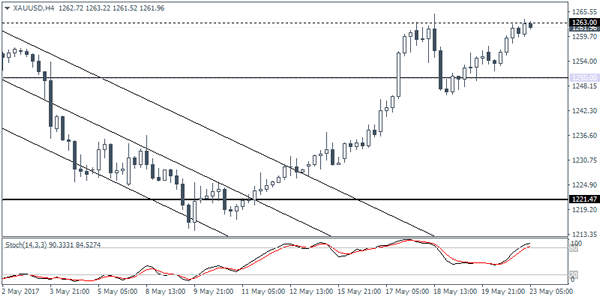
XAUUSD intraday analysis
XAUUSD (1261.96): Gold prices have rallied back to test the resistance level that was formed at 1263.00 that was only tested last week.
However, the 4-hour Stochastics is currently showing a lower high at this level which could indicate a downside move. Price action remains flat within 1263.00 and 1250.00 levels. On the daily chart, there is also a potential head and shoulders pattern that is likely to be still emerging with the current rally posting the right shoulder. A reversal at 1263 with a decline to 1250.00 is needed to confirm the downside in price.
Currencies: Euro Extends Rebound. Dollar Still Fighting An Uphill Battle
Sunrise Market Commentary
- Rates: More range-trading?
After yesterday's data-poor session, data are plentiful today. In addition, several central bankers will speak. The Manchester attack might help core bonds to a good start. Data are expected to be narrowly mixed, while Fed speakers probably won't reveal much new info. That makes us think that range-trading may continue, but today maybe with upward bias. - Currencies: Euro extends rebound. Dollar still fighting an uphill battle
Yesterday, euro strength dominated. This morning sentiment on risk turns slightly less positive. Uncertainty on Trump and investor caution slow the risk-on trade, but doesn't help the dollar. The eco data might be mixed for USD trading. The dollar correction has been substantial, but for new there is no trigger for a ST reversal
The Sunrise Headlines
- Wall Street is getting its swagger back. The S&P, up 0.6% yesterday, is close to its pre-selloff levels as investors shrugged off ongoing political controversies in Washington to focus on the bounce-back in oil and on the arms and investment deals struck between the US and Gulf states over the weekend. Asian equities trade mixed overnight.
- Manchester Police said they were treating the explosion that rocked Arena as a terrorist incident until proved otherwise. Market reaction was minimal with US Treasuries marginally up and sterling slightly lower.
- Oil prices were pulling back in Asia after almost a fortnight of solid gains. Prices were buoyed last week after Russia and Saudi Arabia announced they planned to push for the extension of production cuts.
- Japanese manufacturing growth slipped to a six-month low in May as output and job creation fell to multi-month lows. The headline PMI reading dipped to 52 from 52.7 in April, but remained above the 50-point threshold.
- Greece's creditors failed to reach a deal on debt relief during seven hours of talks on Monday, leaving the eurozone locked in a race to finish negotiations before Athens faces crippling debt repayments in July. Germany and the IMF clashed over how to ease the debt burden after 2018.
- MSCI will on June 20 announce whether it would include China's domestic A-shares in its global indices. The US index provider already delayed for three straight years the A-shares' inclusion into its benchmark $1.5tn EM stock index
Currencies: Euro Extends Rebound. Dollar Still Fighting An Uphill Battle
Euro strength and USD softness persist
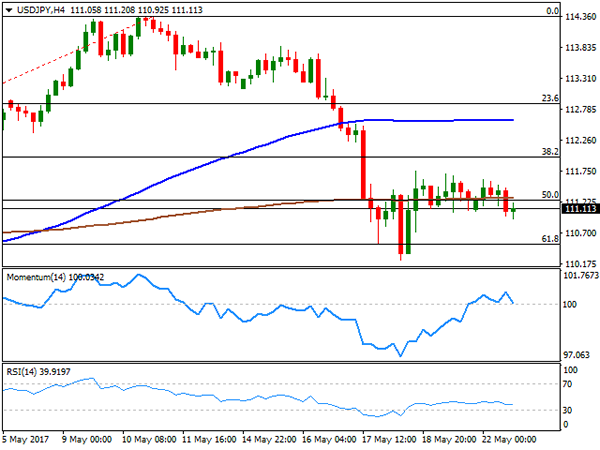
On Monday, the euro dropped temporary early in Europe, but the dip was shortlived. The euro even set new highs after German Chancellor Merkel said that the euro is too weak. EUR/USD touched a correction top in the 1.1264 area and closed the day at 1.1237. The dollar also continued a mediocre performance against the majors including the yen even as US equities extended the rebound. USD/JPY closed at 111.30.
Overnight, the terrorist attack in Manchester and articles in the Washington Post on Trump trying to influence the communication of the intelligence services on the links of its campaign with Russia, are dominating the headlines of the financial press. However, the impact on the markets is modest. Asian equities are trading mixed. The yen is trading marginally stronger (USD/JPY 111.00). EUR/USD (1.1250 area) is holding near the recent highs even as negotiations on a solution for the Greek debt involving the IMF, broke down.
Today, the eco calendar heats up with the US & EMU PMI business sentiment and Ifo business survey. EMU business sentiment is expected marginally lower in May (56.7). We see slight downside risks for the PMI's. At the same time, the German IFO might go higher again. The US service and manufacturing PMI's might modestly rebound. US new home sales growth might ease after two strong months. We don't expect today's data to be game changers for euro or USD trading. The dollar might remain vulnerable to negative surprises. We also keep an eye on US equities. Will the rally continue or will some Trump uncertainty resurface. If the equity rebound slows, USD/JPY might drift below the 111 barrier. The impact of the less positive risk sentiment on the euro is a bit ambiguous. A decline in core yields recently weighed more on the dollar than on the euro, but this might change especially if European equities would continue to underperform. So, we look out whether/when the euro rally has run its course. For now, there is no such s signal. We keep a close eye on the EUR/JPY performance.
At the end of last week, we assumed that an easing of the Trump-crisis could slow the decline of the dollar. For now, core yields and the dollar hardly profited from the rebound of equities. The euro (EUR/USD) remains strong going into the June 08 ECB meeting. However, the mediocre performance of USD/JPY also suggests USD softness. We think that the EUR/USD rebound has gone far enough, but it remains dangerous to row against the EUR/USD rally as long as interest rate differentials move (slightly) in favour of the euro. Investors are also cautious to be short euro going into the ECB meeting. For now we don't row against the euro positive tight
Technical picture.
The USD/JPY rebound ran into resistance two weeks ago. Wednesday's sell-off/rebreak below the 112.20 previous top aborted the uptrend and made the short-term picture negative. Return action lower in the 108.13/114.37 range is possible. Earlier this month, it looked that EUR/USD could revisit the 1.0821/1.0778 support (gap). However, poor US data and political upheaval finally propelled EUR/USD north the 1.1023 range top. The correction tops at 1.1300/1.1366 is the next resistance. We think that USD sentiment will have to be extremely negative to clear this hurdle short-term. Further ST EUR/USD gains might become tougher. A return below 1.1023 would indicate that the upside momentum has eased.
EUR/USD: continues on euro strength and USD weakness
EUR/GBP
EUR/GBP uptrend continues
Yesterday, euro strength was also the dominant factor for EUR/GBP trading. The Merkel comments on a weak euro pushed EUR/GBP further beyond the 0.86 big figure. The pair closed the session at 0.8643. At the same time, sterling also tried to regain ground against an overall weak dollar. The pair returned to the 1.30 area, but Friday's top (1.3040/50 area) just wasn't reached. Some factors weighed also on sterling . The lead of the conservative party over labour in the polls for the Parliamentary election is still big, but declining. The EU rubberstamped its Brexit negotiation position and still wants an agreement on the UK financial commitments first. At least for now, this uncertainty weighs more on the sterling than on the euro
Overnight, the headlines of the Manchester terrorist attack weighed slightly on sterling, but the impact remains modest. Later today, the UK public finance data and the CBI retail sales data will be published. The CBI data are interesting, especially as retail activity was under pressure in the first quarter. However, the market reaction is often limited. An easing (10 from 38) after strong April data is expected. Uncertainty in the wake of the Manchester attack and an easing in retail sentiment might keep a soft sterling sentiment in place.
Of late, the positive sterling sentiment faded and euro strength prevailed in EUR/GBP trading. The pair bottomed out with 0.84/0.8330 as a solid bottom. The breach of 0.8509/31 (previous ST tops) improved the technical picture. For now, we stick to the EUR/GBP uptrend even as the euro rebound might slow short-term. Longer term, Brexit remains potentially negative for sterling
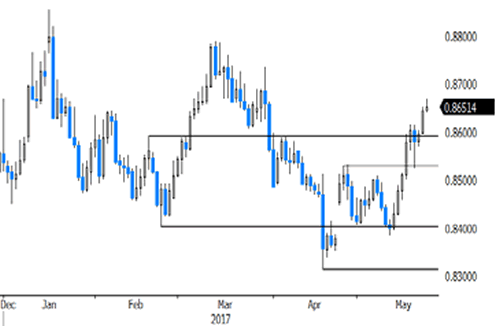
EUR/GBP: euro strength dominates
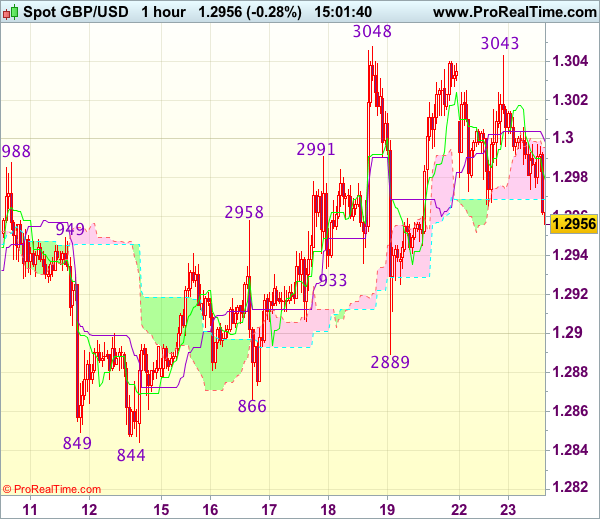
Trade Idea : GBP/USD – Stand aside
GBP/USD - 1.2984
Most recent candlesticks pattern : N/A
Trend : Near term up
Tenkan-Sen level : 1.2979
Kijun-Sen level : 1.2998
Ichimoku cloud top : 1.2996
Ichimoku cloud bottom : 1.2969
New strategy :
Stand aside
Position : -
Target : -
Stop : -
Despite yesterday’s rise to 1.3043, as cable has retreated after faltering below indicated resistance at 1.3048 (last week’s high), retaining our view that further choppy trading below this level would be seen and pullback to 1.2950 cannot be ruled out, however, reckon downside would be limited to 1.2920-25 and said support at 1.2889 should remain intact, bring another rebound later.
On the upside, only a break of said resistance at 1.3048 would confirm recent upmove has resumed an extend further gain to 1.3075-80 and possibly towards 1.3100-10 later. As near term outlook is mixed, would be prudent to stand aside in the meantime.
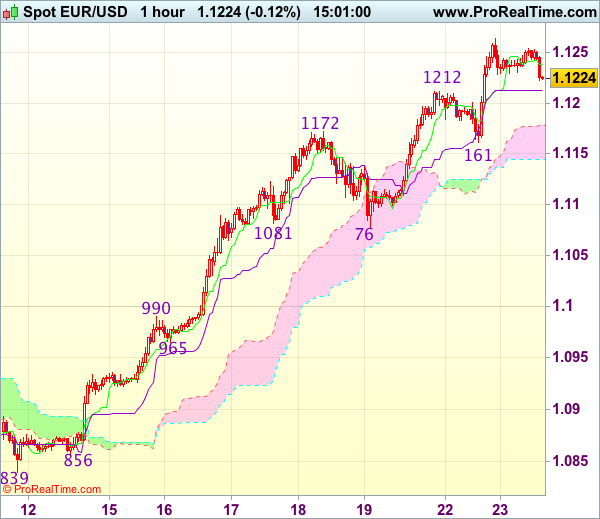
Trade Idea : EUR/USD – Stand aside
EUR/USD - 1.1247
Most recent candlesticks pattern : N/A
Trend : Up
Tenkan-Sen level : 1.1240
Kijun-Sen level : 1.1213
Ichimoku cloud top : 1.1179
Ichimoku cloud bottom : 1.1144
New strategy :
Stand aside
Position : -
Target : -
Stop : -
Although the single currency has maintained a firm undertone after recent rally and near term bullishness remains for recent upmove to extend gain to 1.1260-65, reckon upside would be limited to 1.1280-85 (61.8% projection of 1.0839-1.1172 measuring from 1.1076) and loss of near term upward momentum should prevent sharp move beyond 1.1300-10, risk from there is seen for a retreat later.
In view of this, would not chase this rise here and would be prudent to stand aside in the meantime. Below the Kijun-Sen (now at 1.1213) would bring pullback towards support at 1.1161 but break there is needed to signal top is formed, bring retracement of recent rise to 1.1125-30 first.
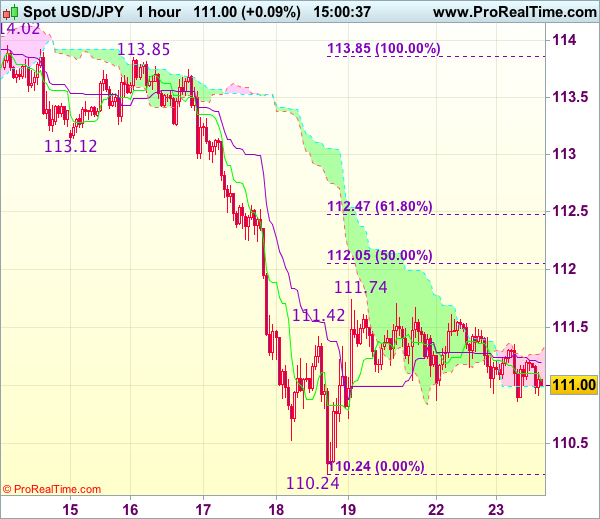
Trade Idea : USD/JPY – Sell at 112.05
USD/JPY - 111.16
Most recent candlesticks pattern : N/A
Trend : Near term down
Tenkan-Sen level : 111.04
Kijun-Sen level : 111.20
Ichimoku cloud top : 111.30
Ichimoku cloud bottom : 110.99
Original strategy :
Sell at 112.05, Target: 110.85, Stop: 112.40
Position : -
Target : -
Stop : -
New strategy :
Sell at 112.05, Target: 110.85, Stop: 112.40
Position : -
Target : -
Stop : -
The greenback has remained confined within near term established range and further sideways trading within this familiar range would be seen and another corrective bounce to resistance at 111.74 is likely, however, reckon upside would be limited to 112.00-05 (50% Fibonacci retracement of 113.85-110.24) and bring another decline later, below 110.70-75 would suggest the rebound from 110.24 has ended, bring retest of this level first.
In view of this, would be prudent to sell dollar on further subsequent recovery as 112.05-10 should limit upside and bring another decline. Above 112.35-40 would defer and signal low is formed instead, risk a stronger rebound to 112.65-70.
Foreign Exchange Market Commentary: EUR/USD, USD/JPY, GBP/USD, GOLD, WTI CRUDE, DJIA, FTSE100, DAX
EUR/USD
The EUR/USD pair keeps rallying to fresh 2017, pretty much daily basis, trading this Monday as high as 1.1263, before settling around 1.1240. The absence of macroeconomic data in the EU maintained the pair ranging early London, but buyers seize their chances after comments from German's Chancellor Angela Merkel hit the wires, blaming the ECB on EUR's weakness, when referring to the country's trade surplus. The headline was enough to bring buyers back. There were no relevant news in the US either, with a couple of Fed's member speaking in different events that had nothing to do with economic policies, with only Kaplan referring to rates, reiterating the usual stance that three rate hikes are appropriated. This Tuesday, focus will be on May´s preliminary Markit PMIs, for the EU and the US, whilst this last will also release New Home Sales and the Richmond manufacturing index.
Technically, the bullish tone persists, although due to the limited intraday range and the late retracement in the US afternoon, indicators in the 4 hours chart have lost upward strength, although the RSI remains within overbought territory. In the same chart and early decline was reverted on an approach to a bullish 20 SMA, currently providing support at 1.1165. Beyond the daily high, the pair has room to extend its advance up to 1.1300, where it topped early November as an immediate reaction to US election, while further gains will likely see the pair reaching the 1.1340 region this Tuesday. A deeper correction could take place on a break below 1.1160, with scope then to revisit the 1.1080 region.
Support levels: 1.1200 1.1160 1.1120
Resistance levels: 1.1260 1.1300 1.1340
USD/JPY
The USD/JPY pair advanced modestly at the beginning of the day, following the release of Japanese trade balance figures, which missed expectations but anyway showed economic progress in the country. Exports were up in April by 7.5%, missing expectations of 7.8%, while imports rose by 15.1%, surpassing market's estimates of 14.8%. The final surplus in the mentioned month, shrank to ¥481.7B. The early advance was contained by selling interest around 111.60, with the pair later trapped between the positive tone of equities and dollar's weakness, falling down to 110.92, but regaining the 111.00 level ahead of the close. During the upcoming Asian session, the country will release the final revisions of March leading indexes, alongside with the May preliminary Markit PMI, expected at 52.9 from a previously revised 52.7. The pair settled a couple of pips below a key static resistance, the 111.20 region where in the 4 hours chart, the 200 SMA converges with the 50% retracement of the latest bullish run. In the same chart, the Momentum indicator has turned south around its 100 level, while the RSI indicator consolidates around 40, all of which supports additional declines on another downward acceleration below the 111.00 figure.
Support levels: 111.00 110.50 109.90
Resistance levels: 111.60 112.00 112.45
GBP/USD
The Pound started the week with a negative footing, but persistent dollar's weakness helped the GBP/USD pair to regain the 1.3000 level, in spite of Brexit turmoil. The pair gapped lower at the opening, undermined by Brexit's minister Davis, who said that the UK can leave the negotiation's table should the EU insist on the payment of a Brexit bill of around €100 billion. The pair fell to 1.2965 before stabilizing, regaining the upside ahead of Wall Street's opening as the market resumed dollar's selling. The issue, however, remains as a Damocles' sword pending above Pound, as EU's chief Brexit negotiator, Michel Barnier, reiterated this Monday that there won't be any trading arrangement discussion until the accounts are settled. From a technical point of view, the pair holds a neutral stance, with the price barely above its 20 SMA, and the Momentum indicator heading nowhere around its mid-line, while the RSI also consolidates but around 56. The pair will likely retain the neutral stance ahead of the UK election, with a limited downward scope on persistent dollar's weakness.
Support levels: 1.2995 1.2960 1.2920
Resistance levels: 1.3060 1.3100 1.3135
GOLD
Gold prices regained the upside this Monday, with spot settling at $1,260.15 a troy ounce, its highest settlement in almost three weeks. Speculative interest continued dumping USD-related assets, favoring an advance in the safe-haven commodity, despite improved market sentiment. The dollar index fell to a fresh 2017 low of 96.65, reaching levels last seen in November and barely bouncing at the end of the day. Gold managed to shrug off Fed's rate hikes rhetoric, as Kaplan hit the wires by saying that three hikes remain appropriated. From a technical point of view, the daily chart shows that the index advanced above still directionless moving averages, although held below last week's peak of 1,264.95, while technical indicators have partially lost their upward strength, but remain well above their mid-lines. In the 4 hours chart, technical readings point to further gains, with the price now above its moving averages, and technical indicators heading north within positive territory.
Support levels: 1,251.45 1,245.40 1,237.40
Resistance levels: 1,264.95 1,273.10 1,282.40
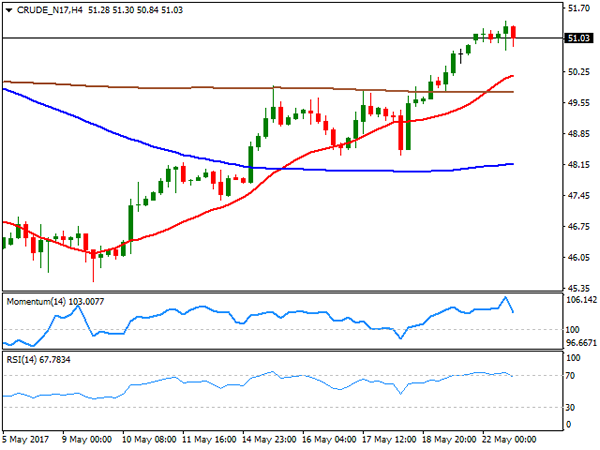
WTI CRUDE OIL
Crude oil prices ended the day pretty much unchanged, with West Texas Intermediate futures settling at $51.02 a barrel after peaking at a fresh 5-week high of 51.41. Ahead of the OPEC Vienna summit to take place this week, market has already priced in an extension on the output cut deal, although for how long remains as the big question. Saudi Arabia and Iraq together back a nine-month extension, but news hit the wires earlier today that Iraq and Kuwait will be more comfortable with just a six-month extension. The black gold maintains the positive tone from a technical perspective, with the commodity ending the day right above its 100 DMA for the first time in over a month, while technical indicators have barely eased but remain near overbought levels. Shorter term, the 4 hours chart shows that technical indicators have corrected overbought readings before turning flat within positive territory, whilst the price remains well above its moving averages, suggesting that the risk remains towards the upside, despite the absence of upward momentum.
Support levels: 50.45 49.80 49.30
Resistance levels: 51.40 51.90 52.60
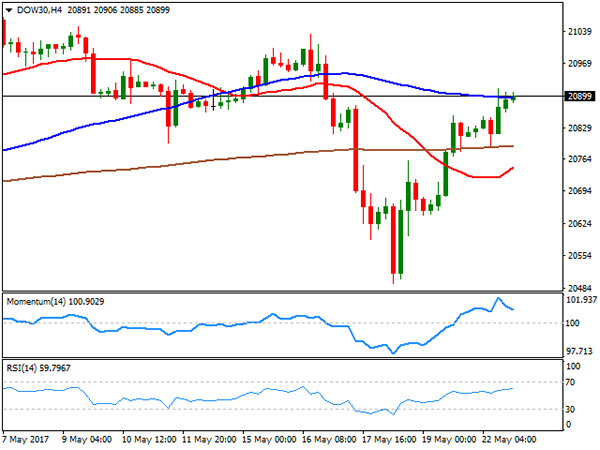
DJIA
Wall Street extended its rally this Monday, with the Dow Jones Industrial Average adding 90 points to end at 20,894.83, fully erasing last week's losses. The Nasdaq Composite added 59 points to 6,133.62, while the S&P settled at 2,394.02, up 0.52%. Almost all sectors advanced, with the energy one being a clear exception. Within the Dow, Boeing led advancers with a 1.55% gain, followed by Cisco Systems that added 1.38$. Pfizer was the worst performer, down 0.99%, followed by El du Pont that shed 0.57% and Chevron which lost 0.38%. DJIA's recovery was not enough to put it back in the bullish track, according to the daily chart, as the index stalled its recovery right below a modestly bearish 20 DMA, whilst the Momentum indicator turned flat below its 100 level, and the RSI indicator lost upward strength, now consolidating around 53. Shorter term, the 4 hours chart shows that the index held once again above the 20 and 200 SMAs, now struggling around a horizontal 100 SMA, while the RSI indicator heads north around 59 and the Momentum indicator retreats within positive territory.
Support levels: 20,770 20,718 20,641
Resistance levels: 20,857 20,905 20,960
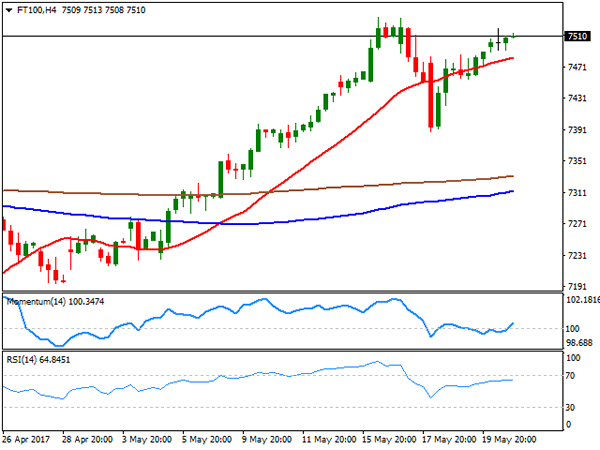
FTSE100
The Footsie managed to add 25 points or 0.34% and close the day at 7,496.34, helped by the soft tone of the British Pound. Also, backing UK´s shares were the latest polls ahead of the election, which clearly show that Theresa May's Conservative Party is the favorite. Marks& Spencer led the way higher by rising 2.75% ahead of on Wednesday, and followed by Burberry Group that added 2.45%. Hikma Pharmaceuticals was the worst performer, ending the day down 4.61%. Commodity-related shares closed mixed, with Rio Tinto up 1.37% and Anglo American ending the day down 0.69%. Up for a second consecutive day, the index holds near record highs, and still bullish according to technical readings in the daily chart, as its also standing far above its moving averages, whilst the RSI indicator heads north around 66, as the Momentum consolidates near overbought levels. In the 4 hours chart, the upside is also favored, despite technical indicators lack directional strength within positive territory, as declines towards a bullish 20 SMA continue to attract buying interest.
Support levels: 7,495 7,462 7,435
Resistance levels: 7,534 7,570 7,605
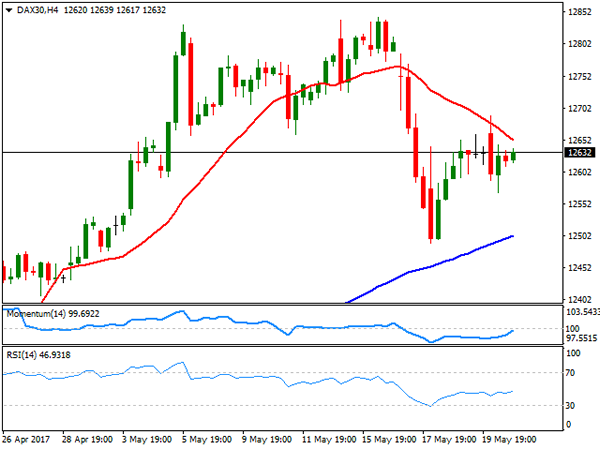
DAX
European equities closed generally lower this Monday, reverting early gains after German Chancellor Merkel said that the common currency is 'too weak,' prompting a rally in the EUR against all of its major rivals. The German DAX ended at 12,619.46, down by 19 points or 0.15%, with RWE AG, a supplier of electricity and natural gas, leading advancers with a 3.11% gain. The worst performer was Merck, down 1.17%, while banks closed pretty much unchanged, with Deutsche Bank down 0.30% and Commerzbank adding 0.07%. The daily chart for the index shows that it held once again a few points above a bullish 20 DMA, while technical indicators have lost their upward strength, and turned modestly lower within neutral territory, indicating an increasing risk of an upcoming downward move. In the 4 hours chart, the index remains below a bearish 20 SMA, while technical indicators aim modestly higher within negative territory, hardly enough to support an upward move.
Support levels: 12,598 12,557 12,490
Resistance levels: 12,685 12,729 12,781
Daily Technical Analysis: EURUSD, GBPUSD, USDJPY, USDCHF
EURUSD
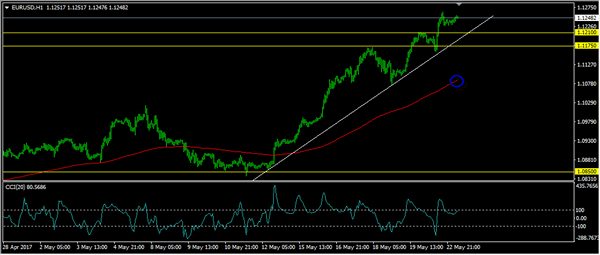
The EURUSD continued its bullish momentum yesterday topped at 1.1263. The bias remains bullish in nearest term testing 1.1300 – 1.1350 area. Immediate support is seen around 1.1210. A clear break below that area could lead price to neutral zone in nearest term testing 1.1175 support area but overall I remain bullish and any downside pullback should be seen as a good opportunity to buy. On the upside, a clear break and daily close above 1.1350 could trigger further bullish pressure testing 1.1600 region this week (weekly EMA 200).
GBPUSD
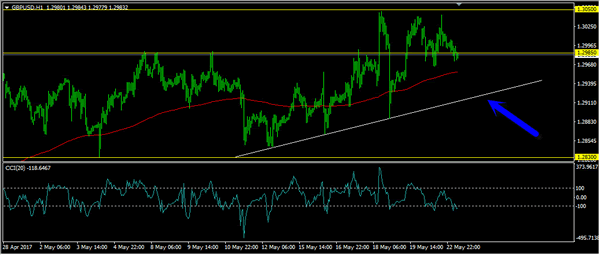
The GBPUSD was indecisive yesterday. The bias remains neutral in nearest term but overall I remain bullish. Immediate support is seen around 1.2950. A clear break below that area could trigger further bearish pressure testing 1.2900 and the trend line support as you can see on my H1 chart below, which is a good place to buy with a tight stop loss. On the upside, we need a clear break and daily close above 1.3050 to continue the bullish scenario testing 1.3185 area.
USDJPY
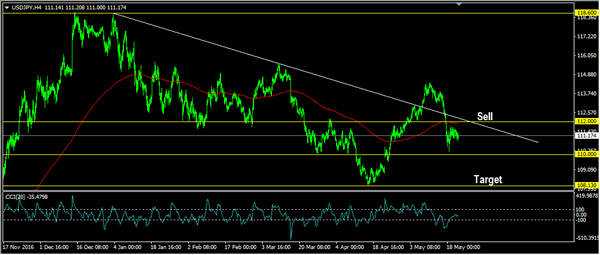
The USDJPY was indecisive yesterday. The bias is neutral in nearest term. As you can see on my H4 chart below, the trend line resistance and H4 EMA 200 are still being respected, keeps the false breakout bearish scenario remains valid targeting 108.00 region. Immediate support is seen around 111.00. A clear break below that area could trigger further bearish pressure testing 110.50 area. On the upside, a clear break back above the trend line resistance and 112.00 area would activate my wait and see mode as direction would become unclear.
USDCHF
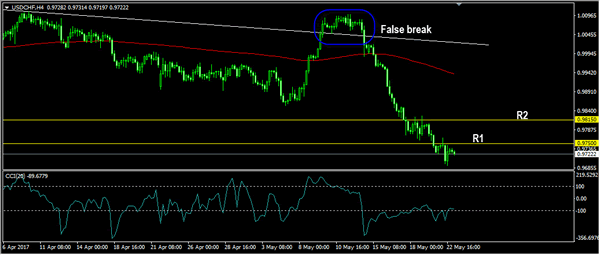
The USDCHF was indecisive yesterday but overall still able to maintain its bearish bias. The bias remains bearish in nearest term testing 0.9650 as a part of the false breakout bearish scenario as you can see on my H4 chart below. Immediate resistance is seen around 0.9750/65 area. A clear break above that area could lead price to neutral zone in nearest term testing 0.9815 resistance area which is a good place to sell with a tight stop loss.
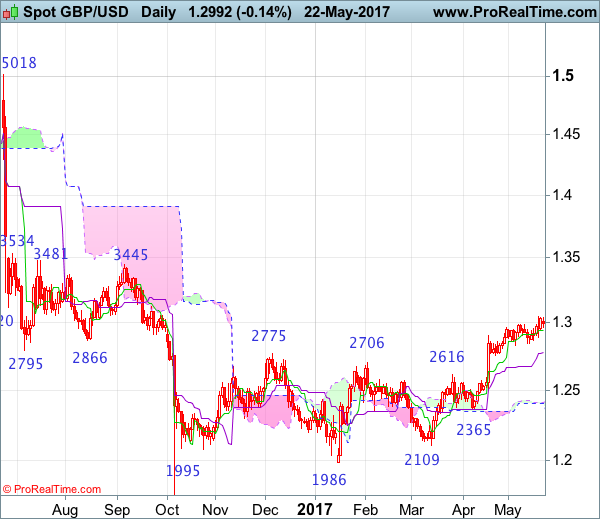
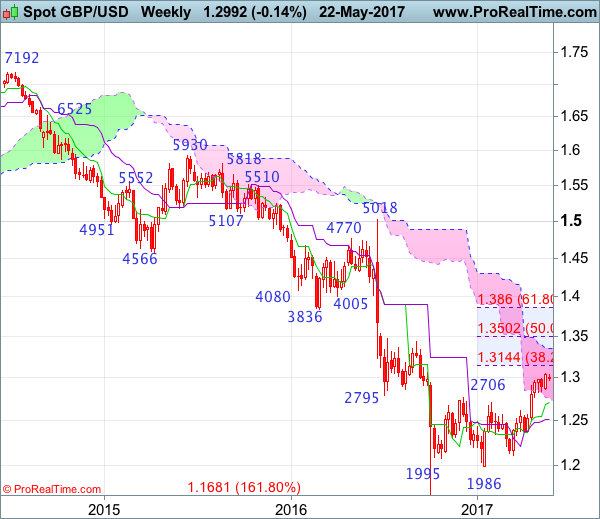
GBP/USD Candlesticks and Ichimoku Analysis
Weekly
• Last Candlesticks pattern: Long white candlestick
• Time of formation: 16 Jan 2017
• Trend bias: Down
Daily
• Last Candlesticks pattern: Long white candlestick
• Time of formation: 18 Apr 2017
• Trend bias: Near term up
GBP/USD – 1.3003
Cable found renewed buying interest at 1.2844 earlier and has resumed recent upmove as the pair broke above previous resistance at 1.2991, confirming recent upmove from 1.1986 low (Jan low) is still in progress and bullishness remains for this move to bring retracement of early downtrend, hence further gain to 1.3050-60, then 1.3100 would be seen, however, loss of near term upward momentum should prevent sharp move beyond 1.3140-50 (38.2% Fibonacci retracement of 1.5018-1.1986) and reckon 1.3200 would hold on first testing, risk from there is seen for a retreat to take place later.
On the downside, whilst initial pullback to the Tenkan-Sen (now at 1.2946) is likely, reckon downside would be limited to support at 1.2889 and bring another rise to aforesaid upside targets. Only a drop below support at 1.2844 would abort and suggest top is possibly formed, bring correction to 1.2800, then towards previous support at 1.2757 which is likely to hold from here, bring another rise later. A daily close below support at 1.2757 would provide confirmation, bring weakness to 1.2700-10 and then towards 1.2650-60 but previous resistance at 1.2616 should remain intact.
Recommendation: Buy at 1.2900 for 1.3100 with stop below 1.2800.
On the weekly chart, as cable has maintained a firm undertone after recent rise, adding credence to our view that the erratic upmove from 1.1986 low (2017 low) is still in progress and bullishness remains for this move to bring retracement of early decline to 1.3090-00, however, reckon upside would be limited to 1.3140-50 (38.2% Fibonacci retracement of 1.5018-1.1986) and price should falter well below 1.3200-10, risk from there is seen for a retreat to take place later this month.
On the downside, although initial pullback to 1.2940-50 cannot be ruled out, reckon downside would be limited to 1.2900 and bring another rise later. Below support at 1.2844 would defer and risk pullback to 1.2800 but only break of support at 1.2757 would provide confirmation, bring further fall to previous resistance at 1.2706, once this level is penetrated, this would provide confirmation, bring subsequent retreat to 1.2640-50. Looking ahead, a drop below another previous resistance at 1.2616 suggest the erratic rise from 1.1986 has ended instead, bring weakness to 1.2550-60 but reckon support at 1.2515 would remain intact.
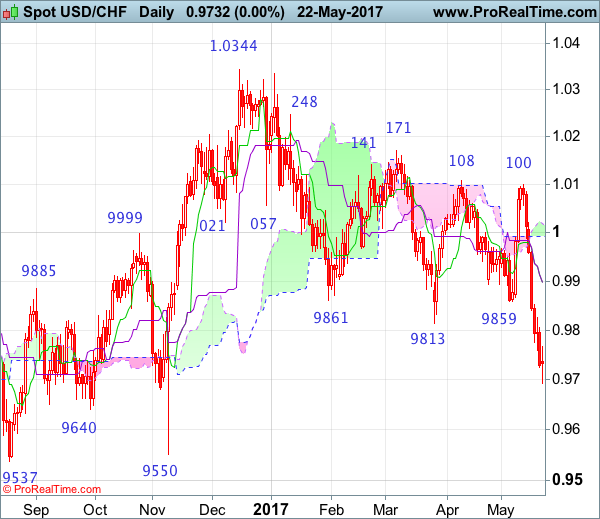
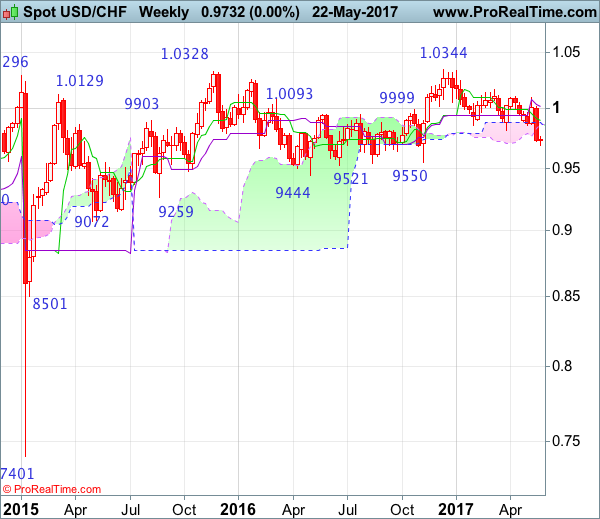
USD/CHF Candlesticks and Ichimoku Analysis
Weekly
• Last Candlesticks pattern: Shooting star
• Time of formation: 7 Mar 2017
• Trend bias: Sideways
Daily
• Last Candlesticks pattern: Morning star
• Time of formation: 9 May 2017
• Trend bias: Near term up
USD/CHF – 0.9944
The greenback met heavy selling interest at 1.0100 earlier this month and has tumbled from there, the subsequent breach of previous support at 0.9813 confirms early decline from 1.0344 top (2016 high) has resumed and bearishness is seen for this move to extend further weakness to 0.9650, then towards 0.9600, however, near term oversold condition should prevent sharp fall below latter level and price should stay above 0.9550 support, bring rebound later.
On the upside, whilst initial recovery to 0.9800 is likely, reckon upside would be limited to 0.9850 and renewed selling interest should emerge around 0.9880-85, bring another decline later. A daily close above the Kijun-Sen (now at 0.9896) would defer and suggest a temporary low is formed instead, bring a stronger rebound to 0.9960 but reckon upside would be limited to the Ichimoku cloud (now at 0.9992-1.0018) and price should falter well below said resistance at 1.0100, bring another selloff.
Recommendation: Sell at 0.9885 for 0.9685 with stop above 0.9985
On the weekly chart, last week’s selloff formed a long black candlestick and the breach of previous support at 0.9813 confirms early erratic fall from 1.0344 top is still in progress, hence bearishness is seen for this move to bring retracement of early upmove to 0.9640-50, then 0.9600 but reckon downside would be limited to previous support at 0.9550 and price should stay above 0.9500, risk from there has increased for a strong rebound later.
On the upside, although initial recovery to 0.9825 and then 0.9850-55 would be seen, reckon upside would be limited to the Tenkan-Sen (now at 0.9900) and bring another decline later. Only above the Kijun-Sen (now at 1.0018) would abort and suggest a temporary low is formed instead, bring test of previous resistance at 1.0100 but a weekly close above there is needed to retain bullishness and signal the aforesaid decline from 1.0344 has ended, bring test of 1.0171 resistance next.
The UK Government Has Announced That Election Campaigning Is Suspended Today
Market movers today
In the euro area, focus will be on the PMI figures and whether they can continue upwards, in cont rast to the weakness in manufacturing PMIs observed in the US and China in recent months. We expect a minor slowdown in the euro area PMIs, but note that the figures should remain at a high level and still show continued expansion.
The German ifo business confidence will also at tract attention today. Ifo estimates fell slightly in April to 105.2 from 105.7 in March. We may see a further small decline in German business expectations to 104.9 due to a softening of the business cycle indicators in the US and China, although there could be tailwind from the outcome of the French election.
In the UK, focus will be on the nature and impact of the terrorist at tack in Manchester. The UK government has announced that election campaigning is suspended today.
In the US, the Markit PMI (composite) is expected to show a modest increase as the current level only reflects around 1% GDP growth, which is below our expectation of a current underlying growth rate of around 2%. This would justify a modest rise in Markit PMI. US new home sales are estimated to show a small decline in April after some strong months in early 2017.
The Trump administ ration is expected to release its full budget today, which is expected to contain big cuts to safety net , tax cuts and USD100bn infrastructure projects over the next decade. One major assumption is that real GDP growth will increase to 3% due to supply side effects from the tax cuts, which in our view is doubt ful. We see difficulties in passing the budget given a divided Republican party in Congress.
In the Scandies, it is time for unemployment in Sweden, where we look for a small increase in unemployment.
Selected market news
The Asian equity markets are seeing small gains this morning following a terrorist at tack in Manchester that is said to have killed 19 and wound 50 people. Prime Minister Theresa May and her government have decided to suspend election campaigning today. The cautious risk sent iment follows a rather strong session in US equity markets as some of the concerns about the political upheaval in the US have faded. Furthermore, oil prices continued their recovery as markets are expect ing an extension of the OPEC deal on Thursday.
On Brexit , EU ministers endorsed t he EU's negotiation stance towards the UK yesterday. The EU maintained the maximum demands on the UK in terms of the financial liabilities and legacy obligations for EU citizens in the 'divorce' phase of the negotiations. The EU's lead Brexit negotiator Michel Barnier announced yesterday that the preferred strategy is to start the Brexit negotiations during the week of 19 June. Germany warned that the reality of Brexit had yet to 'break through' in London.
On Greece, euro area finance ministers failed to break an impasse on debt relief for Greece yesterday in Brussels. Talks will continue over the next few weeks with the objective of reaching an agreement in June. Meanwhile, the EU Commission announced yesterday that it recommends closing the Excessive Deficit Procedure for Portugal six years after its bailout , raising the prospect of a rat ing upgrade when Fitch reviews the country's rating on 16 June.