Sample Category Title
GBP/USD Bulls Retreat Ahead Of BoE Statement
Thursday May 11th is a crucial day for GBP traders with the release of a series of UK economic data at 09:30 BST. Followed by the Bank of England's (BoE) interest rate decision and monetary policy minutes at 12:00 BST and the NIESR GDP estimate (Feb to April) at 13:00 BST.
Recent UK economic data has been soft, lowering market expectations for a rate hike. The general election will be held on June 8 and, with the Brexit procedure ongoing, the BoE is unlikely to take any actions at least before the election result; therefore, they are likely to keep policies steady until the Brexit negotiation deal has a clear outline.
GBP/USD has rallied approximately 3% since Theresa May's announcement of a snap general election on April 18. On Monday May 8 GBP/USD hit a 7-month high of 1.2988, trading just below the significant psychological level at 1.3000.
This morning, during early European session, GBP/USD retraced around 50 points, as it was nearing the level at 1.3000, where there is heavy selling pressure.
The BoE's announcement will likely cause a move to GBP and GBP crosses. With a hawkish comment GBP/USD will likely test the level at 1.3000 again. Conversely, with a dovish comment, we will likely see a correction downward.
On the 4-hourly chart, the 10 SMA has crossed over the 20 SMA, suggesting the bullish momentum has been waning.
The daily Stochastic Oscillator reading is around 70, suggesting a pullback.
The resistance level is at 1.2960, followed by 1.2985 and 1.3000.
The support line is at 1.2935, followed by 1.2920 and 1.2900.


GOLD Consolidating Below $1230, SILVER Weakening Towards $16.00, CRUDE OIL Consolidating Around $46.
GOLD Consolidating below $1230.
Gold continues its decline after the yellow metal has faded near the hourly resistance at 1295 (18/04/2017 high). Hourly support is now located at 1195 (10/03/2017 low). The road is wide-open for further decline.
In the long-term, the technical structure suggests that there is a growing upside momentum. A break of 1392 (17/03/2014) is necessary ton confirm it, A major support can be found at 1045 (05/02/2010 low).
SILVER Weakening towards $16.00.
Silver's bearish pressures are still lively. Strong support is given at 15.63 (20/12/2017 low). Closest support is given at 16.20 (04/05/2017 low). Key resistance is given at a distance at 19.00 (09/11/2017 high). Expected to see continued bearish pressures until at least $16.
In the long-term, the death cross indicates that further downsides are very likely. Resistance is located at 25.11 (28/08/2013 high). Strong support can be found at 11.75 (20/04/2009).
CRUDE OIL Consolidating around $46.
Crude oil is bouncing back on short-squeeze move. The commodity has bounced from a level below $44. Strong support is given at 42.20 (14/11/2017 low). Expected to see renewed bearish pressures.
In the long-term, crude oil has recovered after its sharp decline last year. However, we consider that further weakness are very likely. Strong support lies at 24.82 (13/11/2002) while resistance can now be found at 55.24 (03/01/2017 high).
EUR/JPY Trading Well Above 200-DMA, EUR/GBP Continued Weakness, EUR/CHF Fading Below 1.1000.
EUR/JPY Trading well above 200-DMA
EUR/JPY's buying pressures are there. Hourly resistance at 124.10 (15/12/2016 low) has been broken. Major support is given at 114.90 (18/04/2017low). Expected to see further renewed buying pressures towards 125.00.
In the longer term, the technical structure validates a medium-term succession of lower highs and lower lows. As a result, the resistance at 149.78 (08/12/2014 high) has likely marked the end of the rise that started in July 2012. Strong support at 94.12 (24/07/2012 low) looks nonetheless far away.
EUR/GBP Continued weakness.
EUR/GBP is trading lower. The technical structure remains negative as long as the resistance at 0.8530 (25/04/2017 low) holds. Expected to show continued weakness until support given at 0.8304 (05/12/2017 low).
In the long-term, the pair has largely recovered from recent lows in 2015. The technical structure suggests a growing upside momentum. The pair is trading above from its 200 DMA. Strong resistance can be found at 0.9500 psychological level.
EUR/CHF Fading below 1.1000.
EUR/CHF's volatility is getting stronger. Resistance given at has been broken 1.0898 (08/12/2017 high). Despite the sharp increase and the recent bullish breakout which is very likely psychological, we believe that the medium-term pattern suggests us to see at some point renewed bearish pressures towards key support that can be found at 1.0623 (24/06/2016 low).
In the longer term, the technical structure is mixed. Resistance can be found at 1.1200 (04/02/2015 high). Yet,the ECB's QE programme is likely to cause persistent selling pressures on the euro, which should weigh on EUR/CHF. Supports can be found at 1.0184 (28/01/2015 low) and 1.0082 (27/01/2015 low).
Trade Idea: GBP/USD – Hold short entered at 1.2955
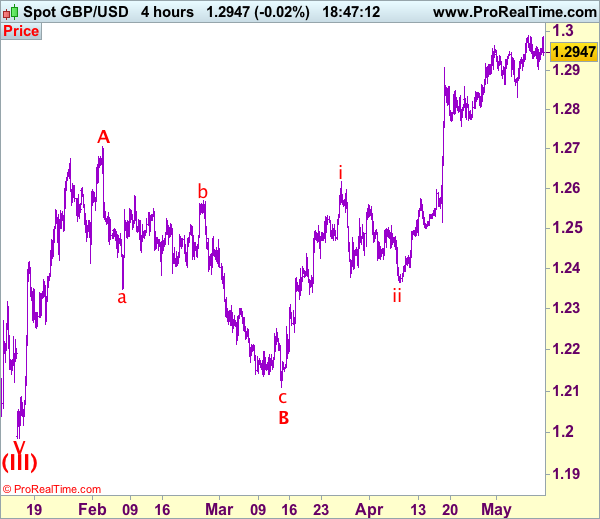
GBP/USD – 1.2941
Recent wave: Wave V of larger degree wave (III) has ended at 1.1986 and major correction has commenced from there for gain to 1.3000 and 1.3140-50
Trend: Near term up
Original strategy :
Sold at 1.2955, Target: 1.2775, Stop: 1.3015
Position: - Short at 1.2955
Target: - 1.2775
Stop: - 1.3015
New strategy :
Hold short entered at 1.2955, Target: 1.2775, Stop: 1.3000
Position: - Short at 1.2955
Target: - 1.2775
Stop:- 1.3000
Although cable rebounded after finding support at 1.2903 yesterday, as long as indicated resistance at 1.2991-00 holds, further consolidation would be seen with mild downside bias for another test of 1.2900-03 support, break there would suggest a temporary top is possibly formed, bring weakness to 1.2831 support, however, a break below this level is needed to add credence to this view, bring retracement of recent rise to 1.2770-75 but previous support at 1.2757 should hold from here. We are keeping our view that the wave c as well as larger degree wave B has ended at 1.2109, hence impulsive wave C has commenced from there with wave i of C ended at 1.2616, follow by a correction to 1.2365 (end of wave ii) and wave iii rally is unfolding.
Our preferred count on the daily chart is that cable's rebound from 1.3500 (wave (A) trough) is unfolding as a wave (B) with A ended at 1.7043, followed by triangle wave B and wave C as well as wave (B) has ended at 1.7192, the subsequent selloff is the larger degree wave (C) which is still unfolding with minor wave (III) of larger degree wave 3 ended at 1.1986, hence wave (IV) correction is in progress which could either be a triangle wave (IV) of a complex formation but upside should be limited to 1.3500 and price should falter well below 1.4000, bring another decline in wave (V) of 3 for weakness to 1.1500, then 1.1200.
On the upside, expect recovery to be limited to 1.2980 and bring another retreat later. Above said resistance at 1.2995 would extend recent upmove to 1.3040-50 but overbought condition should limit upside to 1.3075-80 and price should falter below 1.3100.
USD/CHF Trading Mixed Around Parity, USD/CAD Pushing Slightly Higher, AUD/USD On The Road Toward Key Support 0.7145.
USD/CHF Trading mixed around parity.
USD/CHF is trading mixed. The technical structure has invalidated the short-term negative momentum. Hourly resistance is given at 1.0107 (10/04/2017 high).
In the long-term, the pair is still trading in range since 2011 despite some turmoil when the SNB unpegged the CHF. Key support can be found 0.8986 (30/01/2015 low). The technical structure favours nonetheless a long term bullish bias since the unpeg in January 2015.
USD/CAD Pushing slightly higher.
USD/CAD has declined after failing to reach 1.3800 before bouncing back. Hourly support can be found at 1.3411 (24/04/2017 high) then 1.3353 (20/01/2017 high). Expected to show renewed bullish pressures as long as the pair remains above 1.3530 (27/04/2017 low).
In the longer term, there is a golden cross with the 50 dma crossing the 200 dma indicating further upside pressures. Strong resistance is given at 1.4690 (22/01/2016 high). Long-term support can be found at 1.2461 (16/03/2015 low).
AUD/USD On the road toward key support 0.7145.
AUD/USD is trading below 0.7500. As long as prices remain below the resistance at 0.7608 (17/04/2017 high), the short-term technical structure is negative. Key resistance stands at 0.7681 (30/03/2017 high). Expected to show further weakness.
In the long-term, we are waiting for further signs that the current downtrend is ending. Key supports stand at 0.6009 (31/10/2008 low) . A break of the key resistance at 0.8295 (15/01/2015 high) is needed to invalidate our long-term bearish view.
EUR/USD Short-Term Weakness, GBP/USD Pushing Higher Towards 1.3000, USD/JPY Bullish!!
EUR/USD Short-term weakness.
EUR/USD is trading lower. Hourly support is given at 1.0852 (27/04/2017 low) then 1.0682 (21/04/2017 base). Stronger support can be found at 1.0494 (22/02/2017 low). Expected to show another leg higher towards 1.10.
In the longer term, the death cross late October indicated a further bearish bias. The pair has broken key support given at 1.0458 (16/03/2015 low). Key resistance holds at 1.1714 (24/08/2015 high). Expected to head towards parity.
GBP/USD Pushing higher towards 1.3000.
GBP/USD is trading mixed. The pair is trading around former hourly resistance given at 1.2966 (30/04/2017 high). Hourly support can be found at 1.2757 (21/04/2017 low). An unlikely break of this support would indicate further weakness. Expected to push higher.
The long-term technical pattern is even more negative since the Brexit vote has paved the way for further decline. Long-term support given at 1.0520 (01/03/85) represents a decent target. Long-term resistance is given at 1.5018 (24/06/2015) and would indicate a long-term reversal in the negative trend. Yet, it is very unlikely at the moment.
USD/JPY Bullish!!
USD/JPY is pushing higher since the pair broke resistance given at 112.20 (31/03/2017 high). Hourly support can be found at 110.88 (26/04/2017 low). Stronger support is located at 108.13 (17/04/2017 low). Other key supports lie at a distant 106.04 (11/11/2016 low). Expected to show continued bullish pressures.
We favor a long-term bearish bias. Support is now given at 96.57 (10/08/2013 low). A gradual rise towards the major resistance at 135.15 (01/02/2002 high) seems absolutely unlikely. Expected to decline further support at 93.79 (13/06/2013 low).
Trade Idea: GBP/JPY – Buy at 145.75
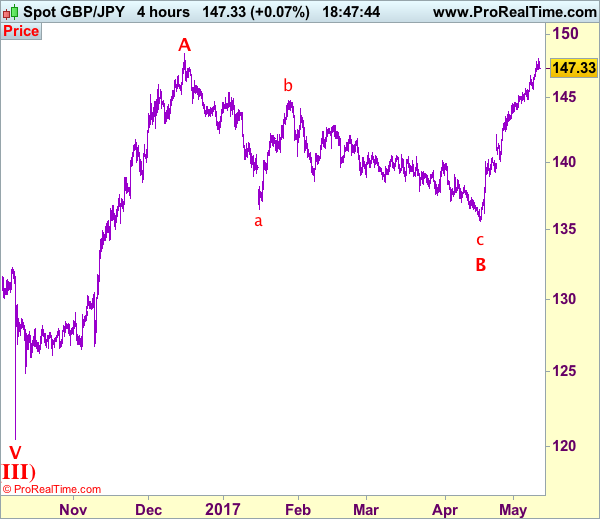
GBP/JPY - 147.25
Recent wave: Medium term low formed at 120.50 and (A)-(B)-(C) major correction has commenced with (A) leg ended at 148.45, hence wave (B) is unfolding for retreat to 131.00-10.
Trend: Near term up
Original strategy:
Buy at 146.20, Target: 148.20, Stop: 145.60
Position: -
Target: -
Stop: -
New strategy :
Buy at 145.75, Target: 148.75, Stop: 145.15
Position: -
Target: -
Stop:-
As sterling has eased after rising to 148.10, suggesting consolidation below this level would be seen and pullback to 146.50-60 cannot be ruled out, however, reckon downside would be limited to 145.70-75 and bring another upmove later, above said resistance at 148.10 would extend recent upmove from 135.60 to previous chart resistance at 148.45, then towards 148.90-00 but near term overbought condition should prevent sharp move beyond 149.50, bring retreat later.
In view of this, would not chase this rise here and would be prudent to buy sterling on subsequent pullback as 145.65-70 should limit downside, bring another rise later. Below said support at 145.15-20 would defer and suggest a temporary top is possibly formed, bring correction to 144.80-85 but only break there would provide confirmation, bring correction to 144.50 first.
Our preferred count is that larger degree wave V with circle is unfolding from 251.12 with wave (I) 219.34, (II): 241.38 and wave (III) is subdivided into 1: 192.60, 2: 215.89 (23 Jul 2008) and wave 3 ended at 118.87 earlier in 2009. The correction from there to 162.60 is wave 4 which itself is a double three and is labeled as first a-b-c ended at 151.53, followed by wave x at 139.03, 2nd a ended at 162.60, 2nd b at 146.75 and 2nd c leg of wave 4 ended at 163.00. Therefore, the decline from 163.00 to 116.85 is now treated as wave 5 which also marked the end of larger degree wave (III), hence wave (IV) major correction has commenced for retracement of the wave (III) from 241.38 and upside target at 183.95-00 (50% Fibonacci retracement of the wave (II) from 241.38) had been met, a drop below 160.00 would suggest wave (IV) has ended at 195.85, bring decline in wave (V) for initial weakness to 130 (already met) and 120.
Market Update – European Session: Quiet EU Session Despite Earnings Barrage
Notes/Observations
Emerging Europe inflation moves off multi-year highs (Czech and Hungary CPI below forecasts)
Overnight:
Asia:
China Apr CPI YoY reading hits a 3-month high (Y/Y: 1.2% v 1.1%e); PPI misses (Y/Y: 6.4% v 6.7%e)
BoJ summary of opinions from April 26-27th meeting. Should pursue easing as Japan needs more time than US to hit inflation target. Risks are balanced to downside due to risks posed by EU politics and US economic policy and geopolitical risks
BoJ Gov Kuroda reiterated there's still distance to hit 2% inflation and continue current ‘powerful' monetary easing. Yield Control (YCC) is main focus of BoJ monetary policy. JGB purchase amount and monetary base are merely guidelines; pace of JGB buys is now around ¥60T (official target is around ¥80T)
Europe:
Germany Fin Min Schaeuble predicted that ECB policy normalization would begin shortly; could assume that based on recent remarks of the ECB
IMF reiterated view that wants Germany to increase capital spending and infrastructure spending to strengthen inclusive growth and fight inequalities (**Note: comments following Germany Current Account Balance which hit a fresh record high at €30.2B)
National Institute of Economic and Social Research (NIESR) maintains 2017 GDP growth forecast at 1.7%. Reiterated view of expecting the first BOE rate hike in mid-2019. BOE probably won't raise rates before Brexit negotiations were concluded
Americas:
President Trump fired FBI Director Comey
Fed's Kaplan (moderate, voter): reiterates baseline expectation is still for 3 rate hikes this year
Fed's Rosengren (moderate, non-voter): a drop below 4% in unemployment would overheat the economy and prompt higher rates
Fed's George (hawk, non-voter): supports gradual interest rate increases; Fed should start reducing balance sheet this yea
Energy:
Weekly API Oil Inventories: Crude: -5.8M v -4.2M prior; 2nd straight draw and largest draw since Jan 4th
Economic Data
(JP) Japan Mar Preliminary Leading Index: 105.5 v 105.5e ior; Coincident Index: 114.6 v 114.7e
(NO) Norway Apr CPI M/M: 0.2 v 0.5%e; Y/Y: 2.2% v 2.5%e
(NO) Norway Apr CPI Underlying M/M: 0.3% v 0.5%e; Y/Y: 1.7% v 1.9%e
(SE) Sweden Apr PES Unemployment Rate: 3.8% v 3.9% prior
(FR) France Mar Trade Balance: -€5.4B v -€6.0Be
(FR) France Mar Industrial Production M/M: 2.0% v 1.0%e; Y/Y: 2.0% v +0.6%e
(FR) France Mar Manufacturing Production M/M: 2.5% v 0.9%e; Y/Y: 3.5% v 1.2%e
(CZ) Czech Apr CPI M/M: 0.0% v 0.3%e; Y/Y: 2.0% v 2.3%e
(CZ) Czech Apr Unemployment Rate: 4.4% v 4.4%e (lowest Since 2008)
(HU) Hungary Apr CPI M/M: 0.4% v 0.4%e; Y/Y: 2.2% v 2.3%e
(DK) Denmark Apr CPI M/M: 0.2% v 0.2%e; Y/Y: 1.1% v 1.1%e (highest annual pace since Feb 2013)
(IT) Italy Mar Industrial Production M/M: 0.4% v 0.3%e; Y/Y: +7.6% v -1.9% prior; Industrial Production WDA Y/Y: 2.8% v 2.5%e v 1.9% prior
Fixed Income Issuance:
(SE) Sweden sold SEK10B vs. SEK10B indicated in 3-month bills; Avg Yield: % v -0.6795% prior; bid-to-cover: 2.17x v 2.75x prior
(NO) Norway sold NOK3.0B vs. NOK3.0B indicated in 2026 bonds; Avg Yield: 1.56% v 1.36% prior; Bid-to-cover: 2.20x v 1.79x prior
(IT) Italy Debt Agency (Tesoro) sold €6.5B vs. €6.5B indicated in 12-month Bills; Avg Yield: -0.304% v -0.239% prior; Bid-to-cover: 1.73x v 1.76x prior
(EU) ECB allotted $35M in 7-day USD Liquidity Tender at fixed 1.41% vs $35M prior
SPEAKERS/FIXED INCOME/FX/COMMODITIES/ERRATUM
Equities
Indices [Stoxx50 -0.3% at 3640, FTSE +0.1% at 7347, DAX -0.1% at 12742, CAC-40 -0.2% at 5388, IBEX-35 -0.6% at 10985, FTSE MIB -0.4% at 21398, SMI -0.8% at 9047, S&P 500 Futures -0.2%]
Market Focal Points/Key Themes European indices trade mixed this morning with notable weakness in the Swiss SMI and out-performance in the FTSE. Insurance heavyweight AXA reported inline revenue and potential IPO of US unit helping lift shares, Hannover Re reported results which came light of views and as a result shares are trading lower. TalkTalk is one of the leading decliners in Europe after missing on Rev and cutting dividend. Earnings look set to continue as we approach the US morning with notable earnings from Coty, Time and Norweigen Cruise line.
Equities
Consumer discretionary [Just Eat [JE.UK] -1.0% (Hungryhouse acquisition referred to phase to by CMA), ITV [ITV.UK] -1.6% (Earnings)]
Consumer Staples [Compass [CPG.UK] flat (Earnings, Special div), Ahold Delhaize [AD.NL] +1.3% (Earnings), Air France [AF.FR] +3.0% (April Metrics)]
Industrials: [Barratt Developments [BDEV.UK] +3.9% (trading update), HeidebergCement [HEI.DE] -2.5% (Earnings)]
Financials: [Axa [CS.FR] +0.8% (Earnings, Intention to IPO US Unit), ING [INGA.NL] +1.8% (Earnings)]
Telecom: [TalkTalk [TALK.UK] -10% (Earnings, cuts div)]
Healthcare: [Roche [ROG.CH] -2.0% (Tecentriq Cancer drug fails to meet primary endpoint), Ion Beam [IBAB.BE] -11% (Earnings)]
Energy: [EDF [EDF.FR] -0.7% (Earnings)]
Speakers
Sweden Central Bank (Riksbank) Apr Minutes: Board in agreement on outlook for inflation; agreed that expansionary policy was still needed
Sweden Central Bank Gov Ingves noted that it was too early to change direction of policy. Economic activity continued to strengthen, but the political situation abroad was creating risks to economic development going forward. Inflation in Sweden had shown a rising trend for a few years, but was now expected to take slightly longer before stabilizing around 2%. Would continue to monitor the SEK currency (Krona)
Riksbank member Jansson: Inflation picture has deteriorated since Feb; possible to make a further rate cut; will wait-and-see if needed
Riksbank member Skingsley saw no convincing arguments for extending QE
Riksbank member Floden was opposed to more bond buying as current monetary policy was working
Greece Parliamentary speaker Voutsis: To table bailout prior actions bill by Sat, May 13th
UAE Oil Min Mazrouei: Optimistic about next OPEC meeting. To review several options at next OPEC meeting
Currencies
The FX markets saw little volatility in the session. A slightly softer USD was attributed to President Trump's firing of his FBI director.
The EUR/USD was hovering just under the 1.09 area. Dealers noted that the Greek 10-year govt bond yield was at its lowest since 2012 debt restructuring
GBP was firmer in the session with dealers attributing the strength to potential M&A flows. GBP/USD was approaching the 1.30 level which was last tested back in late Sept.
Fixed Income
Bund futures trade at 160.53 up 13 ticks, after North Korea's stated they will move ahead with a 6th nuclear test. A break of 160.15 support level could see lows target 159.01 followed by 157.50. Resistance lies at 160.81 level followed by 162.10.
Gilt futures trade at 127.08 modestly higher by 10 ticks, after a late gains from Treasuries and North Korea's comment. A continuation of the pullback from the 129.14 April 18th high has price eyeing the 126.41 support level. An acceleration lower could test the 125.80 region. Resistance stands at 128.01 then 128.51 followed by 129.14.
Wednesday's liquidity report showed Tuesday's excess liquidity surged to €1.654T a gain of €11B from €1.643T prior. Use of the marginal lending facility rose to €342M from €291M prior.
Corporate issuance saw over $10.3B come to market via 6 issues headlined by Costco Wholesale Corp $3.8B in a 4-part senior unsecured note offering and CK Hutchison Holdings $1.0B subordinated perpetual non-call five. In Europe, General Electric announced a 4-part euro-denominated bond offering.
Looking Ahead
(MX) Mexico Apr ANTAD Same-Store Sales Y/Y: 3.2%e v 4.0% prior
(MX) Mexico May Nominal Wages: No est v 4.7% prior
(UR) Ukraine Apr CPI M/M: 0.7%e v 1.8% prior; Y/Y: 12.5%e v 15.1% prior
05:30 (DE) Germany to sell €3.0B in 0% Apr 2022 BOBL
05:30 (PT) Portugal Debt Agency (IGCP) to sell €1.0-1.25B in 2022 and 2027 OT bonds
06:00 (PT) Portugal Q1 Unemployment Rate: No est v 10.5% prior
06:00 (PT) Portugal Mar Trade Balance: No est v -€0.8B prior
06:00 (IE) Ireland Mar Property Prices M/M: No est v 1.5% prior; Y/Y: No est v 10.7% prior
06:45 (US) Daily Libor Fixing
07:00 (RU) Russia weekly OFZ bond auction
07:00 (US) MBA Mortgage Applications w/e May 5th: No est v -0.1% prior
07:00 (UK) PM May weekly question Time in House of Commons
07:30 (CL) Chile Central Bank's Traders Survey
07:30 (CL) Chile Central Bank Economist Survey
08:00 (BR) Brazil Apr IBGE Inflation IPCA M/M: 0.2%e v 0.3% prior; Y/Y: 4.1%e v 4.6% prior
08:00 (HU) Hungary Central Bank (NBH) Apr Minutes
08:00 (EU) ECB's Draghi in Dutch Parliament
08:15 (UK) Baltic Dry Bulk Index
08:30 (US) Apr Import Price Index M/M: +0.1%e v -0.2% prior; Y/Y: 3.6%e v 4.2% prior
08:30 (US) Apr Export Price Index M/M: 0.2%e v 0.2% prior; Y/Y: No est v 3.6% prior
09:00 (RU) Russia Apr Official Reserve Assets: $400.5Be v $397.9B prior
10:30 (US) Weekly DOE Crude Oil Inventories
12:00 (US) USDA World Agricultural Supply and Demand Estimates (WASDE) Crop Report
12:00 (CA) Canada to sell 2-Year Bonds - 13:00 (US) Treasury to sell 10-Year Notes
14:00 (US) Apr Monthly Budget Statement: +$179.0Be v -$176.2B prior
15:00 (AR) Argentina Apr National CPI M/M: 2.0%e v 2.4% prior
17:00 (NZ) New Zealand Central Bank (RBNZ) Interest Rate Decision: Expected to leave Official Cash Rate unchanged at 1.75%
Oil Inventories Eyed After API Reports Large Drawdown
- Equity rally stalling at record highs again;
- USD pares gains but rebounds again early in European session;
- EIA inventory numbers key after oil decline as API reports large decline.
Small losses in equity markets in Europe look like being replicated in the US ahead of the open on Wednesday, as indices continue to struggle at their highs.
The rally in US equity markets has stalled over the last couple of months as the Trump reflation trade began to run out of steam. The last few weeks though has seen the bullish momentum pick up, sending the S&P and Dow back towards their record highs but once again we seem to be stalling at these levels. As long as we stay above 20,850 in the Dow and 2,380 in the S&P 500, then momentum will appear to remain with the bulls but a break below would suggest the trading range of the last couple of months remains intact.
The US dollar pared gains overnight following two positive days at the start of the week but it has rebounded again at the start of the European session. The rebound came just as GBPUSD was testing 1.30, an important technical level for the pair. With the pair having now come off its highs and the dollar appearing to gain momentum, the next test may come from below, with 1.29 being a potentially important level.
Oil is trading around 1% higher today as we await inventory data from EIA. Brent and WTI sold off heavily towards the back end of last week, breaking below $50 and $47.50, respectively, in the process, in a sign that efforts by OPEC and non-OPEC producers to cut output are proving insufficient. With both having now stabilised just below these technically important levels, it will be interesting to see whether today’s EIA release will be the catalyst for a move back above or the trigger for further another move lower.
On Tuesday, API reported a larger than expected inventory drawdown of 5.78 million barrels, confirmation of which by EIA today would be well above the 1.786 million that markets are expecting. With the reaction to Tuesday’s API data being relatively mild, there is there potential for upside if EIA confirms the numbers but with markets showing a reluctance to do so on Tuesday, I wonder whether it would be enough to break $50 in Brent.
EUR/CHF Elliott Wave Analysis
EUR/CHF : 1.0947
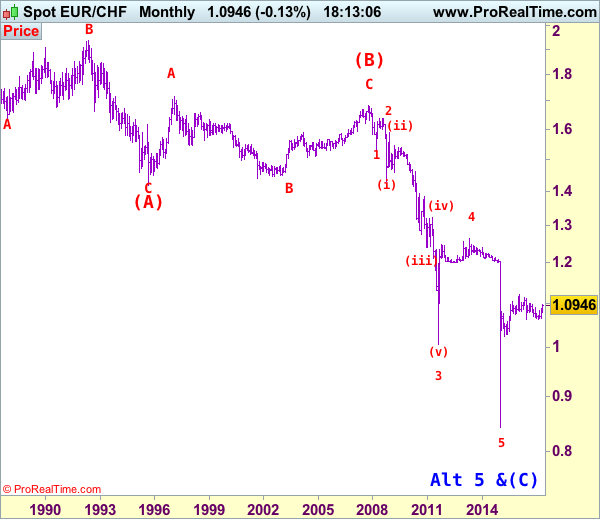
EUR/CHF: Major wave 5 trough ended at 0.8426 and correction has commenced from there for subsequent gain towards 1.1400-1.1500.
As the single currency has surged again after brief pullback to 1.0792 and broke above indicated previous resistance at 1.0899, adding credence to our view that low has been formed at 1.0631 (Feb low) and consolidation with upside bias remains for the rebound from 1.0631 to extend further gain to another previous resistance at 1.1001, break there would provide confirmation and extend the rise from 1.0622 low (2016 low) to 1.1018, then 1.1050 but reckon resistance at 1.1107 would limit upside and price should falter well below 2016 high at 1.1129.
To recap our preferred count, the decline from 1.6828 (end wave (B)) is labeled as the beginning of wave (C) which should unfold as an impulsive move with 1: 1.5326, 2: 1.6377 and wave 3 is sub-divided into (i): 1.4300, (ii): 1.5880 and wave (iii) is still unfolding with (1): 1.4577, (2): 1.5448 and wave (3) is an extended 3rd with i: 1.5006, ii: 1.5383, wave iii: 1.3073, then wave iv ended at 1.3925 and wave v at 1.3073, wave (4) ended at 1.3925 and wave (5) has ended at 1.2765 which also marked the low of wave (iii) and wave (iv) has ended at 1.3835 and wave (v) as well as larger degree wave 3 has ended at 1.0075. The selloff from 1.2650 signals wave 4 has ended there and we are taking a view that the wave 5 could also have ended 0.8426, hence consolidation is seen with mild upside bias for rebound to 1.1000 first, then towards 1.1400.
On the downside, whilst initial pullback to 1.0900-05 cannot be ruled out, reckon downside would be limited to 1.0870-75 and bring another rise later. Below 1.0825-30 would defer and suggest top is possibly formed, bring weakness to said support at 1.0792 but only a daily close below there would add credence to this view, then further fall to 1.0780 and possibly previous minor resistance at 1.0720 would follow. Looking ahead, only a drop below 1.0720 would suggest top is formed instead, risk weakness towards said support at 1.0656 first.
Recommendation: Buy euro at 1.0905 for 1.1105 with stop below 1.0805.
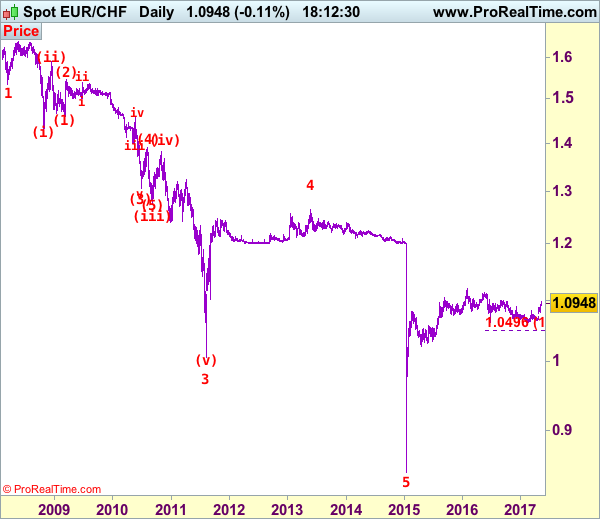
The long-term downtrend started from 1.9626 (Apr 1985) to 1.4166 (Sep 1995) is treated as wave (A) with A:1.6285 (Dec 1987), B: 1.9342 (May 1992) and C: 1.4166, then wave (B) ended at 1.6828 with A: 1.7147 (Feb 1997), B: 1.4398 (Sep 2001), C: 1.6828 (Nov 2007), therefore, wave (C) is now in progress with the breakdown indicated as above. This wave (C) already met indicated downside target at 1.1455/60 and 1.1300, it could have ended at 0.8426, consolidation with mild upside bias is seen for gain to 1.1000 and later towards 1.2000.