Sample Category Title
EUR/USD Analysis: Trades Below 1.09 On Wednesday
'The dollar slid on Wednesday and the perceived safe-haven yen gained after U.S. President Donald Trump abruptly fired FBI Director James Comey in a move that shocked Washington and piqued investors' aversion to risk.' – Mansoor Mohiuddin, NatWest Markets (based on Bloomberg)
Pair's outlook
On Wednesday morning the common European currency was regaining some of its losses against the US Dollar, as the currency exchange rate traded just below the 1.09 mark. The currency pair was still set to decline down to the strong support cluster below it. The cluster consists of the weekly S2 at 1.0833, 20 and 200-day SMAs at 1.0830 and the 38.20% Fibonacci retracement level, which is located at the 1.0826 mark. However, before that cluster is reached the rate might surge to the resistance put up by the weekly S1 at 1.0916.
Traders' sentiment
SWFX traders have not changed their opinion since Tuesday, as 39% of open positions are long and 54% of trader set up orders are to sell.

GBP/USD Analysis: Strong Above 1.2930
'The improved optimism regarding the macro fundamentals are supportive of a stronger US dollar in the current circumstances.' – London Capital Group (based on Investing.com)
Pair's outlook
The market was indecisive on Tuesday due to lack of strong movers. The Pound found support at the 200-hour SMA mid-day, giving the confirmation that upside risks should prevail in this trading session. The pair may find resistance at 1.2982/90 by the lower boundary of the broadening wedge apparent on the hourly chart. This is the likely upper limit for today, as the closest resistance on the daily chart formed by the weekly R1 at 1.3037 may be too far to reach. Strong fundamentals for the Dollar may weaken the rate or even reverse it to the downside. In this case, the price should close in the 1.2938/1.2882 territory.
Traders' sentiment
Market sentiment has remained unchanged, as 51% of traders are holding short positions. Meanwhile, 58% of pending orders are to buy the Pound.
USD/JPY Analysis: Attempts To Climb Over 114.00
'With this [expectations of the newly-elected South Korean President to negotiate with North Korea] in the background, as well as the present uncertainty in the U.S., the dollar will trade heavily today below the 114-yen level.' – Daiwa Securities (based on Reuters)
Pair's outlook
The US Dollar outperformed the Japanese Yen for another day yesterday, adding more than 70 pips, but still unable to close above the 114.00 mark. Technical studies keep suggesting the Buck is to post more gains, but the immediate resistance area around 114.15, formed by the weekly and the monthly R2s, could prevent the USD/JPY pair from edging higher today. As a result, risks are skewed to the downside, with the weekly R1 at 113.47 being the nearest possible support. On the other hand, a boost from fundamental and political factors could provide the Greenback with sufficient bullish momentum to climb over the immediate resistance and approach the 115.00 mark.
Traders' sentiment
There are now 65% of traders holding short positions (previously 63%), whereas 54% of all pending orders are to sell the US Dollar.
Gold Analysis: Bounces Higher On Fundamentals
'We think that gold's slide could perhaps extend to $1,180 to $1,200, an area of good technical support.' – Edward Meri, INTL FCStone (based on Reuters)
Pair's outlook
Although the yellow metal had passed the support cluster near the 1,220 mark on Tuesday, it traded back above it on Wednesday morning. The reason for the sudden rebound, which occurred late in the Tuesday's session, was the slight decline of the US Dollar caused by US President Donald Trump firing the Director of FBI. However, the yellow metal is still set to decline, and yesterday's move showed that the support cluster can be passed. Due to that it is assumed that the cluster at 1,220 will be passed and the bullion will decline down to the weekly S1, which is located at the 1,212.68 mark.
Traders' sentiment
Traders remain neutral on the metal. However, 65% of SWFX trader set up orders are to buy the metal.
Daily Technical Analysis: USD/CAD Contracting Triangle In Uptrend
The USD/CAD has formed a contracting triangle in the uptrend, signalling for a potential retracement. At this point traders should pay attention to two possible breakout points. A breakout to the upside could happen at the break of 1.3742 level (D H3 and Upper triangle trend line) while a breakout to the downside could happen if 1.3695 breaks (D L3 and Lower triangle trend line). The point where trend lines cross camarilla pivot point is called an X Cross. Target for the upside breakout is 1.3800 while the target for the downside breakout is 1.3635.
However as the price is generally in uptrend, if 1.3635 is hit, we could see another push to the upside targeting 1.3695 and 1.3800.
Technical Outlook: GBPUSD – Morning Doji Star Reversal Pattern Produces Fresh Strength
Fresh strength emerged after yesterday's downside rejection at 1.2900 and failure to clearly break below daily Tenkan-sen/10SMA supports at 1.2908/14. Morning Doji Star reversal pattern is forming on daily chart, as today's rally regained Monday's multi-month high at 1.2987 and is pressuring psychological 1.3000 barrier. Overall bullish structure remains intact after shallow Mon/Tue correction was contained by initial supports and sees scope for further upside. However, overbought slow stochastic on both daily and weekly charts requires caution, as falling thick weekly cloud weighs (cloud base lies at 1.3088). Repeated failure at 1.3000 barrier would signal extended consolidation, as the pair is eyeing tomorrow's BoE monetary policy decision for stronger signals. Alternatively, break below 10SMA/daily Tenkan-sen would weaken near-term structure and risk stronger correction.
Res: 1.3000, 1.3050, 1.3088, 1.3146
Sup: 1.2939, 1.2914, 1.2908, 1.2862
BoE Expected To Keep Rates Steady
ECB Governor Draghi will make a speech in the Dutch Parliament at 12:00 BST today. It will be Draghi's first speech after the French election so traders should be aware of any comments on the Eurozone's economic outlook or hints of a possible gradual removal of QE.
Thursday May 11th is a crucial day for GBP traders with the release of a series of UK economic data at 09:30 BST. Followed by the the Bank of England's (BoE) interest rate decision and monetary policy minutes at 12:00 BST and the NIESR GDP estimate (Feb to April) at 13:00 BST.
Recent UK economic data has been soft, lowering market expectations for a rate hike. The general election will be held on June 8 and, with the Brexit procedure ongoing, the BoE is unlikely to take any actions at least before the election result; therefore, they are likely to keep policies steady until the Brexit negotiation deal has a clear outline.
UK inflation saw an upswing following the Brexit vote, reaching the central bank's 2% target, due to the weakening of GBP since the Brexit referendum. A weak pound is beneficial for exports and inflation, however, as wage growth has slowed down the rising inflation will likely undermine consumer expenditure; one of the major drivers of the economy.
GBP/USD has rallied approximately 3% since Theresa May's announcement of a snap general election on April 18. On Monday May 8 GBP/USD hit a 7-month high of 1.2988, trading just below the significant psychological level at 1.3000, where heavy selling pressure is expected.
The BoE's announcement will likely cause a move to GBP and GBP crosses. With a hawkish comment GBP/USD will likely breach the level at 1.3000. Conversely, with a dovish comment, we will likely see a correction downward.
The French election outcome has lifted markets' risk-on sentiment and resulted in safe heavens retreat, US and European treasury yields rise thereby pushing USD and EUR up against JPY. The dollar index hit a 2-week high of 99.55 on Tuesday.
Bank of Japan (BoJ) Governor Kuroda stated on Tuesday that 'the Japanese and global economy saw a recovery' however, the BoJ will continue its QE programme as inflation is expected to reach above the 2% target in 2018. The statement further weighed on JPY.
The Bank of Japan has been considering a gradual removal the long-standing QE. However, while the economic recovery is still fragile it is likely that it will take an extended period for the BoJ to implement it until it sees solid and stable economic and inflation growth.
On Tuesday USD/JPY hit a high of 114.32, previously reached on March 15. Spot gold hit an 8-week low of 1214.15.
Technical Outlook: EURUSD – Risk Of Further Downside While The Price Is Holding Below 10SMA / Tenkan-Sen
Two consecutive long red daily candles and close below initial 10SMA / daily Tenkan-sen supports turned near-term picture bearish and weigh on the market.
Reversal from fresh multi-month high at 1.1020 dipped to 1.0862 where temporary footstep was found.
The pair is consolidating in early Wednesday trading, with action so far holding below 1.0900 handle and keeping intact upside pivots at 1.0913/38 (10SMA / Tenkan-sen) now reverted to resistances.
Pullback may extend to 1.0848 (Fibo 38.2% of 1.0568/1.1020) and 1.0826 (200SMA) with the latter expected to hold dips and keep overall bullish bias in play.
Golden cross of 20/200SMA's is forming at 1.0826 and underpinning larger uptrend.
Bounce and close above daily Tenkan-sen will be seen as strong bullish signal for renewed attempts above 1.1000.
Conversely, close below 200SMA will be bearish and signal deeper correction.
Res: 1.0913, 1.0938, 1.0950, 1.0998
Sup: 1.0862, 1.0848, 1.0826, 1.0794
AUDUSD Looking Quite Bearish, More Weakness May Follow
AUDUSD made a sharp fall last week, which we now see as a trigger and an indication for a wave three in progress. As such we can say, that a running flat correction was completed in the previous wave 2, at the 0.7558 level. A running flat correction is like a normal flat, the only difference is that wave C) of a running flat does not breach the end of wave A), as in our case. That said, we now expect pair to stay bearish in sessions ahead, and ideally unfold a five wave movement within the current bigger wave three that can be underway down to 0.7250 or even 0.7130.
AUDUSD, 4H
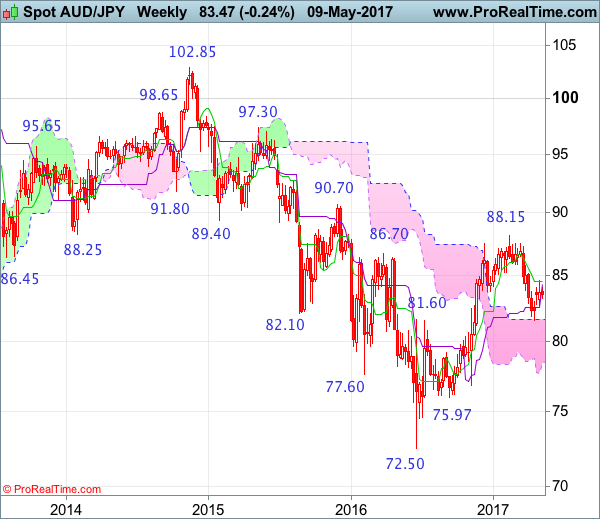
AUD/JPY Candlesticks and Ichimoku Analysis
Weekly
• Last Candlesticks pattern: Shooting star
• Time of formation: 13 Mar 2017
• Trend bias: Down
Daily
• Last Candlesticks pattern: Bearish engulfing pattern
• Time of formation: 16 Feb 2017
• Trend bias: Near term down
Although the Australian dollar rebounded last week to as high as 84.55, the subsequent retreat has retained our bearishness and as long as this level holds, consolidation with mild downside bias remains for another decline, below 82.65-70 would bring weakness to 82.00 but a daily close below there is needed to signal the rebound from 81.49 low has ended, bring retest of this level later. A drop below this level would extend recent decline from 88.15 top to support at 81.10-15, however, near term oversold condition should limit downside and reckon 80.00 psychological support would hold from here, bring rebound later.
On the upside, whilst marginal recovery from here cannot be ruled out, as long as said resistance at 84.55 holds, prospect of another decline to aforesaid downside targets remains. Only a break above said resistance at 84.55 would abort and suggest low is formed instead, risk a stronger rebound to 85.00-10 but said resistance at 85.75 should remain intact, bring another decline later.
Recommendation: Hold short entered at 83.65 for 81.65 with stop above 84.65.
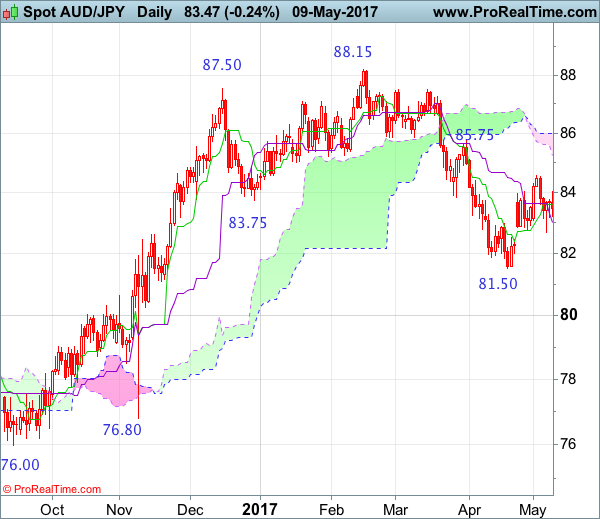
On the weekly chart, although aussie found support at 82.70 and rebounded, still reckon the Tenkan-Sen (now at 84.50) would limit upside and bring another decline, below 83.00 would bring test of said support at 82.70 but break of 82.00 is needed to signal the rebound from 81.49 has ended, bring retest of this level later. A drop below this level would extend the fall from 88.15 top to support at 81.10-15, a weekly close below there would retain bearishness and suggest the rise from 72.50 has ended, then further fall to 80.50 and possibly psychological support at 80.00 would follow.
On the upside, expect recovery to be limited to the Tenkan-Sen (now at 84.50) and bring another decline. A weekly close above resistance at 84.55 would suggest low is formed instead, bring a stronger rebound to 85.00, then towards resistance at 85.75 but only break there would abort and signal low is formed instead, bring further subsequent gain to 86.00 and then 86.50-60, however, price should falter below resistance at 87.50.