Sample Category Title
Euro Steady As Markets Eye Draghi Speech
The euro has ticked lower in the Wednesday session, as the pair trades at 1.0870. On the release front, French data was better than expected. Industrial production posted a gain of 2.0%, above the estimate of 1.2%. France’s trade deficit improved to EUR -5.4 billion, better than the forecast of EUR -5.9 billion. The markets are keeping a close eye on ECB President Mario Draghi, who will speak about monetary policy in the Dutch House of Representatives. There are no major releases out of the US. On Thursday, PPI is expected to show a slight gain of 0.2%, and unemployment claims is forecast to climb to 245 thousand.
Industrial production and manufacturing numbers have long been weak points in the eurozone economy, but first quarter data is showing considerable improvement in France and Germany. French industrial production jumped 2.0% in March, ending a streak of three consecutive declines. The Markit France Manufacturing PMI rose to 55.1 in April, its highest level since 2011. In Germany, industrial production in March declined 0.4%, but this was just a blip, as industrial production in the first quarter posted a respectable gain of 1.6%. German Factory Orders came in at 1.0%, above the forecast of 0.7%. An improvement in global economic conditions has revived the demand for eurozone exports, notably cars and machinery. A weak euro has made European exports more attractive and helped boost the manufacturing sector. Germany releases Preliminary GDP for the first quarter on Friday, with the markets predicting a gain of 0.6%. If the GDP report is stronger than expected, the euro could reverse directions and gain ground.
President Donald Trump has raised many eyebrows in his first 100 days in office, but political Washington is stunned after Trump abruptly fired FBI director James Comey on Tuesday. Comey had been conducting an investigation into possible collusion between Trump and Russia during the presidential campaign. The White House has claimed that it fired Comey over his handling of a email scandal involving Hillary Clinton, but the move has been roundly condemned by the Democrats, and some key Republicans are likely to express their opposition as well. If this political mayhem continues, it could unnerve investors and hurt the US dollar against other major currencies.
AUD/USD Elliott Wave Analysis
AUD/USD – 0.7378
AUD/USD – Wave 5 of C and (B) has possibly ended at 1.1081
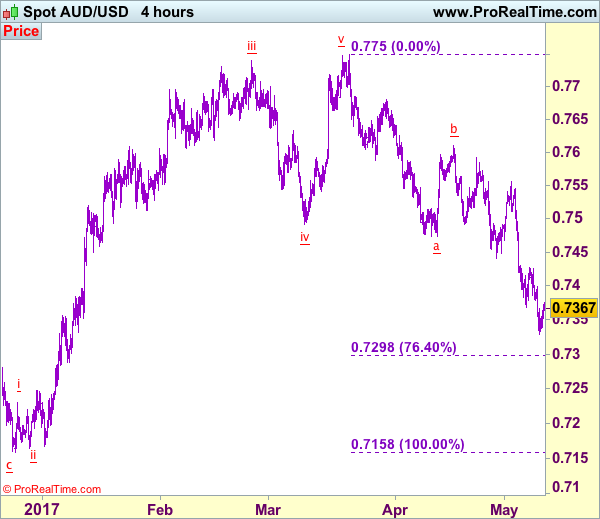
Aussie has fallen again after brief recovery, adding credence to our bearish view that fall from 0.7750 is still in progress, indicated downside target at 0.7390 was met (with 180 points profit), downside bias remains for this move to extend weakness to 0.7300-10, however, near term oversold condition should prevent sharp fall below 0.7280 and reckon 0.7200-10 would hold from here, price should stay well above previous chart support at 0.7158, bring rebound later.
We are keeping our count that top has been formed at 1.1081 (wave 5 of V) and major correction (A-B-C-X-A-B-C) has commenced, indicated downside targets at 0.7945 (61.8% Fibonacci retracement of entire rise from 0.6007-1.1081) and 0.7750 had been met and downside bias is seen for further weakness to 0.6800, then 0.6700 but reckon 0.6500 would hold from here.
Our preferred count is that the rally from 0.6007 to 0.7270 (7 Jan 2009) is marked as wave A, the retreat to 0.6248 (2 Feb 2009) is wave B and the subsequent upmove is labeled as wave C with wave (iii) and wave (iv) ended at 0.8265 and 0.7700 respectively and wave (v) as well as 3 ended at 0.9407, then wave 4 ended at 0.8066 (instead of 0.8578). The wave 5 has met our indicated projection target of 1.1060 and could ended at 1.1081, this level is now treated as the peak of wave (C) as well as larger degree wave B, hence major fall in wave C has commenced, our initial downside target at psychological support at 0.7000 has just been met and further weakness to 0.6500 would be seen later.
On the upside, whilst initial recovery to 0.7420 cannot be ruled out, previous support at 0.7473 should turn into resistance and bring another decline later to aforesaid downside targets. Above 0.7500 would risk test of last week’s high at 0.7556 but only a daily close above there would signal a temporary low is formed, bring a stronger rebound to another previous resistance at 0.7592, break there would add credence to this view, bring correction of recent decline to strong resistance at 0.7611 first.
Recommendation: Short entered at 0.7570 met target at 0.7390 with 180 points profit and would sell again at 0.7450 for 0.7250 with stop above 0.7550
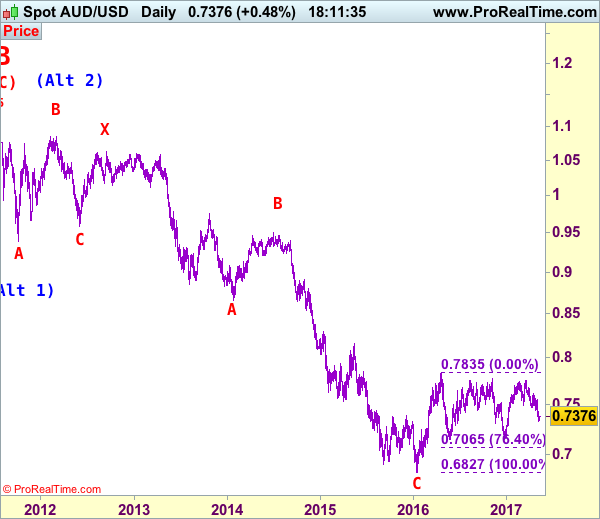
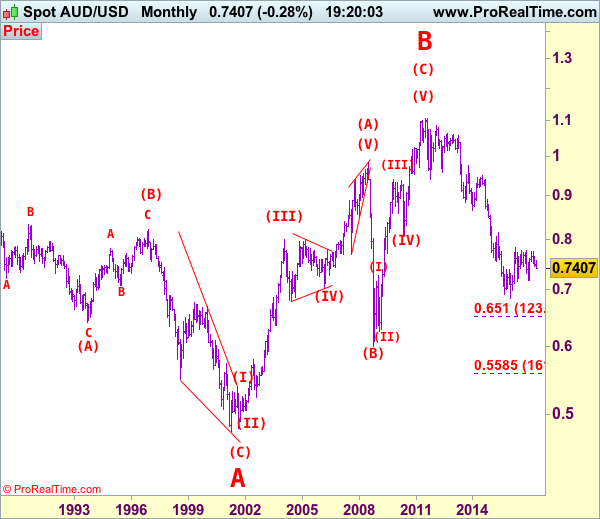
Our alternate count on the daily chart treated the top formed in 2008 at 0.9851 could be a larger degree wave I and was followed by a deep and sharp correction in wave II to 0.6007 and wave III is unfolding from there.
The long-term uptrend started from 0.4775 (2 Apr 2001) with an impulsive structure. Wave I is labeled as 0.4775 to 0.9851 (15 Jul 2008), wave II has ended at 0.6007 (Oct 2008) and wave III is still in progress which may extend further gain to 1.1265.
Technical Outlook: AUDUSD Bounces From Strong Support At 0.7329, Bears Favor Fresh Downside After Consolidation
The pair bounces from Tuesday’s five-month low at 1.0827 after strong bearish acceleration on Tuesday met its target at 0.7329 (weekly Ichimoku cloud base).
Yesterday’s fall closed below important 0.7384 support (Fibo 61.8% of 0.7159/0.7747) that adds on bearish structure
Larger bears may pause and enter consolidative corrective phase as support is strong and daily studies are oversold.
Broken Fibo support at 0.7384 now acts as initial resistance, with extended correction expected to remain capped by falling 10SMA (currently at 0.7434, also former low of 27 Apr) to keep bears in play for fresh downside and attempts towards next support at 0.7298 (Fibo 76.4% of 0.7159/0.7747).
Res: 0.7384, 0.7313, 0.7434, 0.7467
Sup: 0.7329, 0.7398, 0.7286, 0.7250
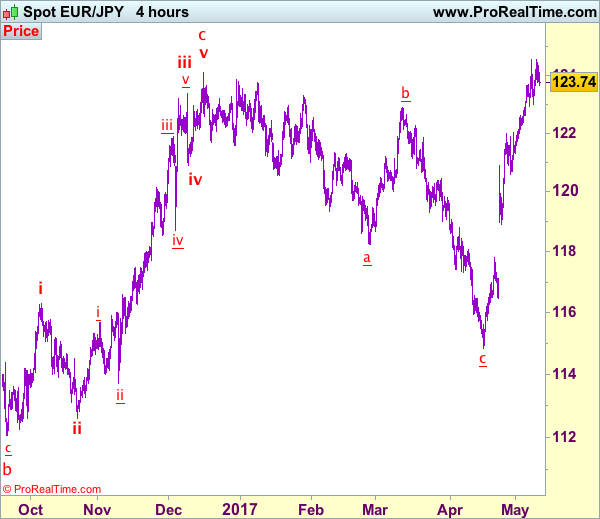
Trade Idea: EUR/JPY – Hold short entered at 124.00
EUR/JPY - 123.79
Recent wave: wave v of (C) ended at 94.12 and major correction in wave A has ended at 149.79
Trend: Near term up
Original strategy:
Sold at 124.00, Target: 122.20, Stop: 124.60
Position: - Short at 124.00
Target: - 122.20
Stop: - 124.60
New strategy :
Hold short entered at 124.00, Target: 122.20, Stop: 124.55
Position: - Short at 124.00
Target: - 122.20
Stop:- 124.55
Although the single currency rebounded yesterday, as euro has retreated after faltering below resistance at 124.55, retaining our view that further consolidation below this level would be seen and test of support at 122.92-98 is likely, break there would suggest a temporary top is possibly formed, bring further fall to 122.60 but break of 122.00-10 is needed to add credence to this view, bring retracement of recent upmove to 121.50 first.
In view of this, we are holding on to our short position entered at 124.00. Above said resistance at 124.55 would abort and signal recent upmove is still in progress and may extend further gain towards 125.00 level but loss of upward momentum should prevent sharp move beyond 125.40-50, risk from there is seen for another retreat later.
Our latest preferred count is that wave (ii) is ABC-X-ABC which ended at 123.33 and wave (iii) is unfolding with wave iii ended at 100.77, followed by wave iv at 111.57 and wave v as well as the wave (iii) has ended at 97.04, followed by wave (iv) at 111.43 and wave (v) has ended at 94.12 which is also the end of the larger degree v, this also implied the major wave (C) has also ended there, hence major correction has commenced from there with (A) leg unfolding in its lower degree wave c which has possibly ended at 145.69. Under this count, A-B-C wave (B) has commenced with A leg ended at 136.23, wave B at 143.79 and wave C has possibly ended at 149.79.
Our larger degree count is that the decline from 139.26 is wave (C) and is sub-divided into a diagonal triangle i-ii-iii-iv-v with wave i - 105.44, wave ii- 123.33, wave iii - 97.03, wave iv - 111.43, followed by the final wave v as well as the end of wave (C) at 94.12, this also mark the bottom of larger degree wave B. Under this count, major rise in wave C has commenced as an impulsive wave with minor wave III ended at 145.69, wave V is still in progress for further gain to 150.00. Having said that, this so-called wave V could well be the first leg of larger degree 5-waver wave C and this wave C should bring at least a retest of wave A top at 169.97 (July 2008).
RBNZ Set To Stand Pat, May Shift To A More Upbeat Tone
During the early Asian session Thursday, the RBNZ will announce its rate decision. The forecast is for the officials to take no action again. The Bank kept the door for further easing open when it last met, mainly due to global uncertainties. As for inflation, the RBNZ noted that it expects it to reach the midpoint of its target range over the 'medium-term'. Nevertheless, inflation data for Q1 released shortly after that meeting showed that CPI inflation rose faster than the Bank anticipated, and now lies slightly above the target-range midpoint. Meanwhile, 2-year inflation expectations rose further, and the labor market continued to tighten in Q1.
Even though all of these encouraging domestic developments should normally see the RBNZ shifting to a somewhat more upbeat tune, we think that any optimistic message will be moderate. Concerns over global trade remain elevated, as we were reminded of recently by the US imposing tariffs on Canada. In addition, we doubt the Bank will risk a speculative surge in NZD by appearing too optimistic, as that could offset some of the economic progress achieved so far.
NZD/USD traded somewhat higher yesterday after it hit support near the 0.6880 (S1) key hurdle. In our view, the rate is likely to oscillate around current levels waiting for the RBNZ decision tonight. If indeed the Bank adopts a slightly more optimistic tone than previously, the rate may trade higher and challenge the 0.6940 (R1) resistance. A decisive break above that level could carry more upside extensions, perhaps towards our next obstacle of 0.6980 (R2). On the other hand, a message more dovish than what the market anticipates may be a reason for a decisive dip below 0.6880 (S1).
USD/JPY pares earlier gains after North Korea comments
The dollar gained notably against its major counterparts yesterday, especially against the yen. The surge in USD/JPY may have been fueled, at least partly, by the heightened expectations regarding a Fed rate hike in June. The other major catalyst behind the move may have been the increasing risk appetite of investors following the French election. This market euphoria is also evident by the fact that US stock indices continue to break record highs, as well as the recent sell-off in other safe haven assets such as gold. However, USD/JPY pared some of its earlier gains during the Asian morning Wednesday, after comments from North Korea that it will proceed with its nuclear tests.
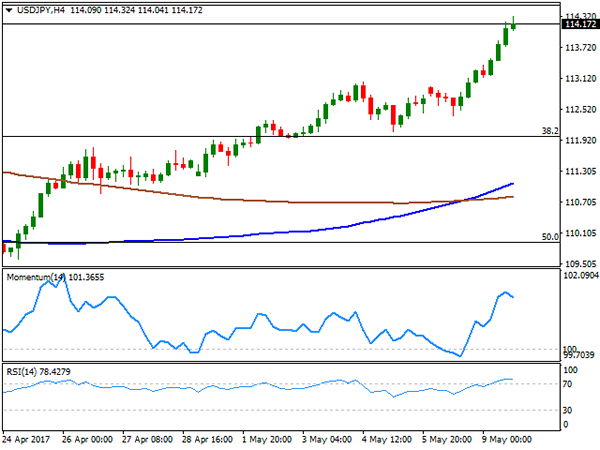
USD/JPY surged yesterday, breaking above the resistance (now turned into support) barrier of 113.50 (S1) to stop near 114.35 (R1). Then, the rate pulled back. Despite the correction lower, we think that the path of least resistance for the pair is still to the upside, amid a general risk-on market environment.
Indeed, the price structure on the 4-hour chart suggests a short-term uptrend above a trend line drawn from the low of the 21st of April. Therefore, we expect the bulls to take charge again soon and aim for another test near the 114.35 (R1) area. A clear move above that level is possible to pave the way for the next resistance of 114.90 (R2). The case for another leg up is also supported by the fact that there are no real risk events on the economic calendar over the next few weeks.
As for the rest of today's highlights:
During the European day, the only economic indicator we get is Norway's CPI for April. The forecast is for both the headline and core rates to have risen somewhat. These are likely to be pleasant news for the Norges Bank, which at its latest two policy meetings appeared concerned with regards to inflation. As such, these data could diminish somewhat the likelihood for any further easing and thereby, reverse some of NOK's latest losses.
We have one speaker on the agenda: ECB President Mario Draghi will speak about the impact of ECB monetary policy before the Dutch Parliament. Following comments from the German Finance Minister yesterday that normalization of ECB policy will begin shortly, investors may once again look for clues as to whether the Bank is set to shift to a slightly more hawkish tone at its upcoming meeting in June.
NZD/USD
Support: 0.6880 (S1), 0.6840 (S2), 0.6780 (S3)
Resistance: 0.6940 (R1), 0.6980 (R2), 0.7020 (R3)
USD/JPY
Support: 113.50 (S1), 112.90 (S2), 112.35 (S3)
Resistance: 114.35 (R1), 114.90 (R2), 115.50 (R3)
Trade Idea: AUD/USD – Buy at 0.7300
AUD/USD – 0.7367
Recent wave: Wave 5 ended at 1.1081 and major correction has commenced for fall to 0.7000 and then towards 0.6500-10
Trend: Near term down
Original strategy :
Buy at 0.7300, Target: 0.7500, Stop: 0.7240
Position: -
Target: -
Stop: -
New strategy :
Buy at 0.7300, Target: 0.7500, Stop: 0.7240
Position: -
Target: -
Stop:-
Although aussie has recovered from 0.7329, reckon 0.7400 would limit upside and bring another decline later, below said support at 0.7329 would extend one more fall to 0.7295-00 (76.4% retracement of 0.7158-0.7750), however, loss of downward momentum should prevent sharp fall below there an bring rebound later, above 0.7425-30 would bring subsequent gain to 0.7490-00 but break of 0.7510 is needed to signal low is formed, then test of resistance at 0.7556 would follow.
In view of this, we are inclined to turn long on next decline. Below 0.7245-50 would risk weakness to 0.7200-10, however, reckon previous support 0.7158 would contain downside and aussie may stage another strong rebound from there later this week.
On the 4-hour chart, the move from 0.8066 is the wave 5 with i: 0.8860, ii: 0.8315, wave iii is an extended move ended at 1.0183, iv: 0.9706 and wave v has ended at 1.1081 (also the top of entire wave 5). The subsequent selloff is the major correction which is unfolding as ABC-X-ABC and 2nd A leg has ended at 0.8848, followed by a-b-c wave B which ended at 0.9758, hence, 2nd C wave is now in progress and indicated downside target at 0.7000 and 0.6950 had been met, so further fall to 0.6710-20 cannot be ruled out.
Foreign Exchange Market Commentary: EUR/USD, USD/JPY, GBP/USD, GOLD, WTI CRUDE, DJIA, FTSE100, DAX
EUR/USD
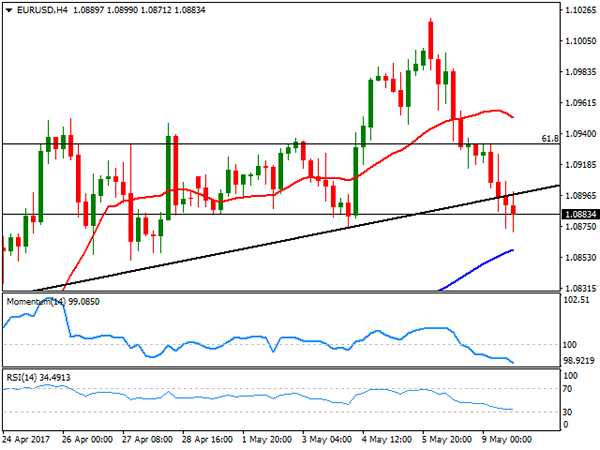
The American dollar advanced for a second consecutive day against its European rival, resulting in the pair setting a fresh 2-week low of 1.0863. The macroeconomic calendar was light in both economies, with minor reports still indicating steady growth in the Euro area, and slightly disappointing figures in the US. Nevertheless the greenback stood victorious, as speculative interest kept shifting its attention to Central Banks' imbalances, and soft US data were not enough to prevent the Fed from acting next month.
The IBD/TIPP Economic Optimism Index, showed that US consumer confidence retreated modestly in May, down to 51.3 after printing 51.7 in April. Wholesale inventories surged by 0.2% in March, against market´s hopes for a 0.1% decline. A couple of Fed speakers hit the wires, with Kansas George saying that the US economy is on track to grow at “a slightly above-trend rate,” and therefore gradual rate hikes are the right path. In a different event, Rosengren centered on employment stating that further falls in the unemployment rate below 4%, would overheat the economy, prompting higher rates.
The EUR/USD pair was unable to regain the 1.0900 level, even despite German finance minister Schaeuble state that the normalization of the ECB's monetary policy should start "shortly." The pair has broken below an ascendant trend line coming from April 24th low at 1.0820, and even completed a pullback to it before reaching the mentioned low, indicating that the slide is not over yet. Technical readings in the 4 hours chart also favor a new leg lower, as technical indicators maintain their strong bearish slopes near oversold territory, as the 20 SMA turns south well above the current level.
Support levels: 1.0850 1.0820 1.0770
Resistance levels: 1.0895 1.0930 1.0965
USD/JPY
The American dollar advanced for a second consecutive day against its European rival, resulting in the pair setting a fresh 2-week low of 1.0863. The macroeconomic calendar was light in both economies, with minor reports still indicating steady growth in the Euro area, and slightly disappointing figures in the US. Nevertheless the greenback stood victorious, as speculative interest kept shifting its attention to Central Banks' imbalances, and soft US data were not enough to prevent the Fed from acting next month.
The IBD/TIPP Economic Optimism Index, showed that US consumer confidence retreated modestly in May, down to 51.3 after printing 51.7 in April. Wholesale inventories surged by 0.2% in March, against market´s hopes for a 0.1% decline. A couple of Fed speakers hit the wires, with Kansas George saying that the US economy is on track to grow at “a slightly above-trend rate,” and therefore gradual rate hikes are the right path. In a different event, Rosengren centered on employment stating that further falls in the unemployment rate below 4%, would overheat the economy, prompting higher rates.
The EUR/USD pair was unable to regain the 1.0900 level, even despite German finance minister Schaeuble state that the normalization of the ECB's monetary policy should start "shortly." The pair has broken below an ascendant trend line coming from April 24th low at 1.0820, and even completed a pullback to it before reaching the mentioned low, indicating that the slide is not over yet. Technical readings in the 4 hours chart also favor a new leg lower, as technical indicators maintain their strong bearish slopes near oversold territory, as the 20 SMA turns south well above the current level.
Support levels: 1.0850 1.0820 1.0770
Resistance levels: 1.0895 1.0930 1.0965
GBP/USD
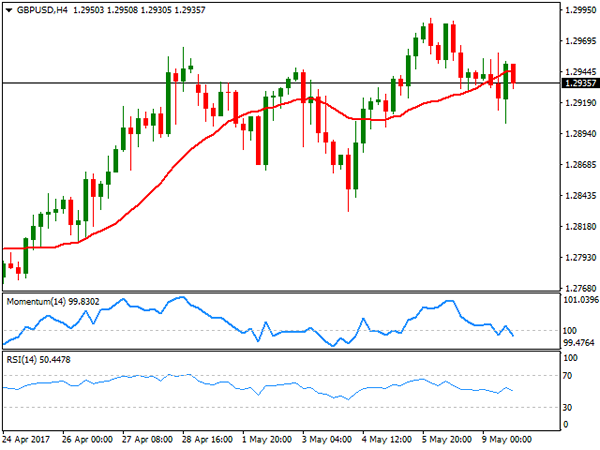
The GBP/USD pair closed the day flat around 1.2940, recovering from a fresh weekly low set at 1.2903 early London. There were no big news coming from the UK, although at the beginning of the day, the BRC report showed that retail sales jumped by 5.6% in April when compared to a year earlier, reverting the soft figures seen in the previous month. Investors are waiting for the upcoming BOE meeting, before making decisions on the pair. The Central Bank is expected to revise its inflation and growth forecasts, but also to maintain rates unchanged. Attention will therefore focus on how policy makers vote, as on the previous meeting 1 member voted for a hike. The technical picture is neutral-to-bearish, as despite bouncing from the mentioned low, the pair was unable to regain ground above its 20 SMA, whilst technical indicators have turned lower, but remain within neutral territory. Furthermore, the pair posted a lower low and a lower high daily basis, another sign of fading buying interest.
Support levels: 1.2900 1.2865 1.2830
Resistance levels: 1.2960 1.2995 1.3030
GOLD
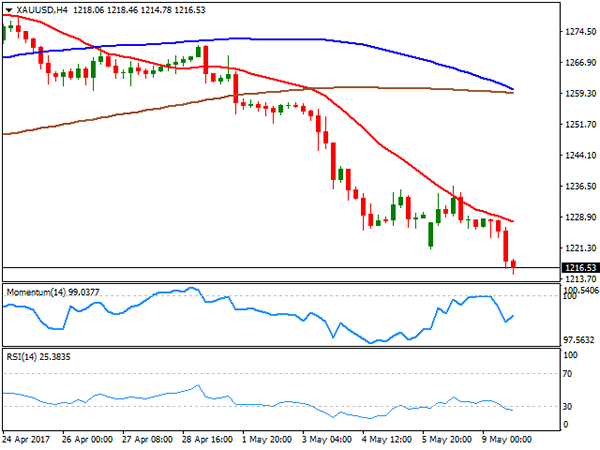
As the dollar advanced gold prices extended their slide, with spot ending the day at a fresh 2-month low of $1,214.78 a troy ounce. The commodity closed the day barely $1 above that low, as coupling with dollar's strength was lower physical demand for the metal. Improved market's sentiment and chances of a Fed rate hike next month, will likely keep gold prices under pressure during the upcoming sessions. From a technical point of view, the daily chart shows that the price extended its slide below all of its moving averages, whilst technical indicators remain near oversold territory, with the RSI indicator accelerating its slide, anticipating a bearish continuation. In the shorter term, and according to the 4 hours chart, the commodity is also biased lower, given that the upside was contained by selling interest around a bearish 20 SMA, whilst the Momentum indicator holds well below its mid-line and the RSI indicator heads south around 24.
Support levels: 1,214.10 1,203.80 1,194.95
Resistance levels: 1,221.10 1,231.85 1,242.50
WTI CRUDE OIL
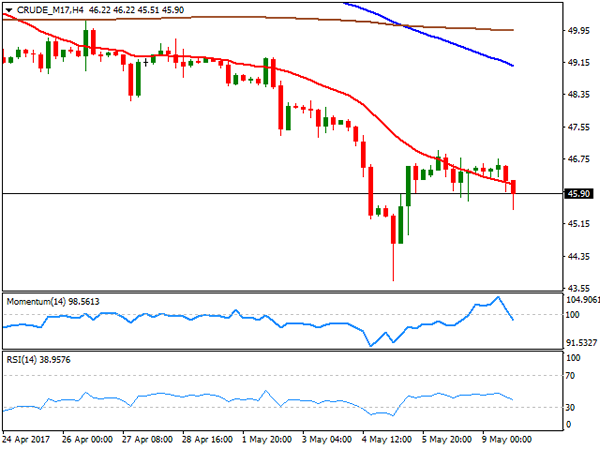
Oil prices were once again under pressure, with West Texas Intermediate futures ending the day at $45.90 a barrel, despite news headlines indicating that Saudi Arabia will reduce its crude oil exports to the Asian market by around 7 million barrels in June, as market participants still weigh more rising US production. Ahead of the US monthly stockpiles reports, expectations are of a 1.8 million barrels' decline. In the meantime, the technical picture keeps favoring the downside, given that daily indicators resumed their declines after a brief upward correction, whilst the price remains far below all of its moving averages. For the shorter term, technical readings in the 4 hours chart also support a bearish extension, as the price is back below a bearish 20 SMA, while technical indicators turned sharply lower, entering negative territory after the price topped for the day at 46.76.
Support levels: 45.30 44.70 44.10
Resistance levels: 46.70 47.20 47.75
DJIA
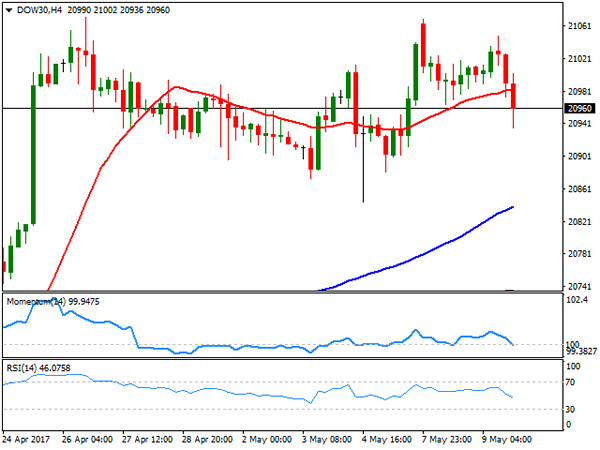
US equities closed mixed, with the DJIA settling at 20,975.78, down by 36 points, and the S&P losing 2 points and settling at 2,396.92. The Nasdaq Composite, on the other hand, added roughly 18 points to close at fresh record highs of 6,102.59. The energy sector was the worst performer, and within the DJIA, Chevron was the worst performer, shedding 1.56% followed by Cisco Systems that lost 1.24% and El du Pont that closed 1.12% lower. Nike led advancers by adding 1.05%, followed by Wall Mart that gained 0.83%. The Dow remained within its usual range, unable to find direction, and the daily chart shows that it holds above a bullish 20 SMA, whilst technical indicators extended their declines, but still holding above their mid-lines. The 20 DMA heads modestly higher around 20,840, limiting the downside. In the 4 hours chart, the index is currently breaking below its 20 SMA, whilst technical indicators are entering negative territory, leaning the scale towards the downside in the short term.
Support levels: 20,936 20,898 20,845
Resistance levels: 21,030 21,071 21,138
FTSE100
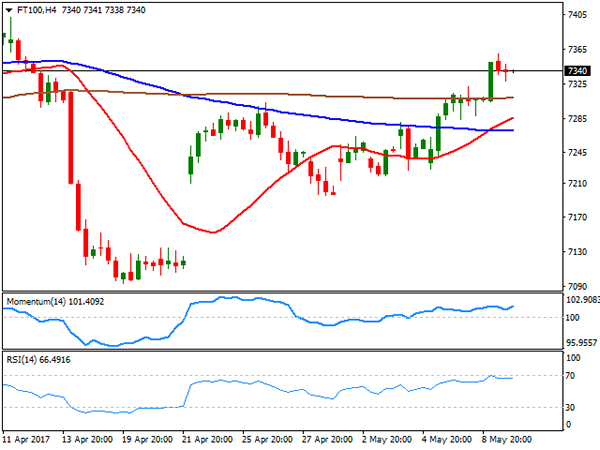
The FTSE 100 advanced 41 points to settle at 7,342.21 underpinned by a rally in mining equities, amid a rebound in copper prices. The London benchmark advanced for a fourth consecutive session, further helped by a softer Pound. Glencore added 2.27% and made it to the top 10 list, after the company cancelled its plans to close an Australian coal mine. Rolls-Royce was the best performer, adding 4.64%, while also up were Billiton, with a 2.22% gain and Fresnillo that gained 1.78%. Micro Focus led decliners, ending the day 5.65% lower, while the energy sector also edged lower, after PM Theresa May promised lower energy bills if she wins the General Election next June. The index stands at its highest in three weeks, and poised to extend its advance according to technical readings in the daily chart, as indicators accelerated their advances, now nearing overbought levels, whilst the benchmark moved further above its moving averages. In the 4 hours chart, the index is also biased higher after finally extending beyond its 200 SMA, and as technical indicators resumed their advances within positive territory.
Support levels: 7,327 7,284 7,247
Resistance levels: 7,360 7,402 7,447
DAX
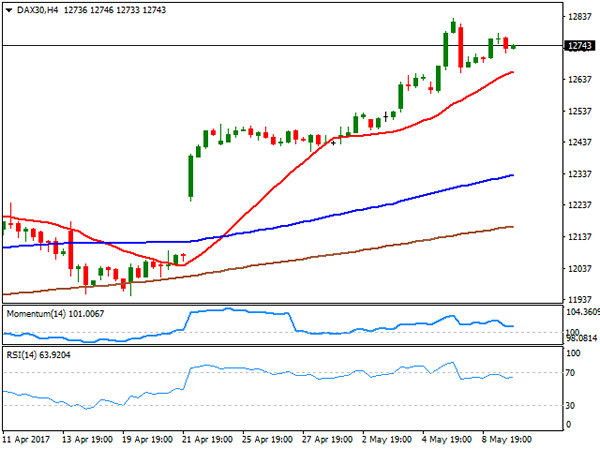
The German DAX added 54 points or 0.43% this Tuesday to settle at 12,749.12, backed by solid local data, as despite the trade balance headline missed expectations, exports surged to a record of €118.2 billion, whilst imports surged by 2.4% to €92.9 billion. Factory orders in the country fell, but by less than anticipated in March. E.ON was the best performer, up 3.86%, followed by Merck, which added 1.28%. The worst performer was insurer Muenchener that lost 1.34%, followed by Deutsche Post that shed 0.88%. Despite closing in the green, the DAX trimmed most of its daily gains ahead of the close, but so far, the bullish tone persists, as in the daily chart, the Momentum indicator regained the upside, now heading north at fresh multi-month highs, whilst the RSI barely corrected extreme overbought conditions before settling around 70. In the 4 hours chart, however, technical indicators eased within positive territory before losing directional strength, somehow anticipating decreasing buying interest. In this last time frame, the 20 SMA keeps heading north below the current level, offering a strong dynamic support around 12,661, with a break below it favoring additional declines.
Support levels: 12.720 12,668 12,623
Resistance levels: 12,765 12,812 12,850
USD Rally On Pause… For Now
USD consolidates gains, EM currencies bounce back
After rallying aggressively since the beginning of the week, the greenback retreated against most of its peers as investors took a breather to assess the dollar’s outlook. The dollar index rallied as much as 1.16% since Monday morning and hit 99.68, thanks to a sharp debasement in the CHF (-1.80%), the JPY (-1.10%) and the EUR (-0.95%). Emerging markets were also badly hit with the TRY, PLN and ZAR falling 1.80%, 1.25% and 1.05% respectively. Despite this temporary setback for the greenback, we remain dollar positive as we believe the market is not done pricing in the upcoming rate hike by the Fed (implied probability for an upside move, extracted from the Fed funds futures, stands at 95.3%).
Emerging market currencies are on the front line, especially after the rise of downward pressure in commodity prices, which was mostly triggered by worries over China’s economic outlook. This morning, Asian EM have had a hard time keeping their heads above water, with the exception of the South Korean won that rose 0.30%.
Across the Pacific, USD/BRL continued to trade within its uptrend channel and is currently testing its 200dma that stands at around 3.2147. The publication of April’s inflation data will most likely leave investors unmoved. Headline inflation is expected to come in at 4.10% y/y, down from 4.57% in March, which would make it the lowest read since July… 2007, when it stood at 3.74%.
The BCB has been cutting the Selic aggressively since October last year and has even speeded up the process recently by cutting it 1% down to 11.25% in April. This is rather good news for the Brazilian economy as it gives a breath of fresh air on the credit side. Unfortunately, this move will make the Brazilian real less attractive for carry traders, which explains why the real has begun to reverse gains starting mid-March. USD/BRL closed Tuesday’s session at 3.1894 and is expected to open slightly lower this afternoon as the USD consolidates gains.
Gold is still suffering as risks fade
Since mid-April, gold has continued to decline and it is now around its lowest level since March. This comes as the French election fears have now faded and also recession risks have seemed to be lower for some time.
There are a few things to be said anyway though. First data from the first quarter of the US economy has clearly been mixed in terms of growth and car sales. Recent data was better, such as non-farm payrolls which printed above 200k for April and the unemployment rate fell to 4.4%. As a result, we believe markets are buying back the Fed storytelling about the rate path. President Trump is less and less at the centre stage of the markets and the Fed is clearly back in.
In Europe, the French elections provided uncertainties but it seems that as Emmanuel Macron’s victory was even larger than expected, this removed it all. Fading European political uncertainties are also sending gold lower.
Technically-wise, the yellow metal should likely monitor the $1200 level. In case of a bearish breakout, we could see gold back towards levels of around $1150.
Daily Technical Analysis: EURUSD, GBPUSD, USDJPY, USDCHF
EURUSD
The EURUSD continued its bearish momentum yesterday bottomed at 1.0863. The bias remains bearish in nearest term testing 1.0850 key support which is a good place to buy with a tight stop loss as a clear break and daily close below that area would expose pre-gap level at 1.0730 and retesting the trend line support as you can see on my H1 chart below. Immediate resistance is seen around 1.0905. A clear break above that area could lead price to neutral zone in nearest term testing 1.0950 or higher. Overall I remain neutral.
GBPUSD
The GBPUSD was indecisive yesterday. The bias is neutral in nearest term. Immediate resistance is seen around 1.0965. A clear break above that area could trigger further bullish pressure testing 1.3000 – 1.3050 area. Immediate support is seen around 1.2900. A clear break below that area could trigger further bearish pressure testing 1.2865 area which is a good place to buy with a tight stop loss. Overall I remain bullish based on the double bottom formation on daily chart after bounced off 1.2000 support in January 16.
USDJPY
The USDJPY continued its bullish momentum yesterday topped at 114.32. The bias remains bullish in nearest term testing 115.00 as a part of the bullish continuation scenario after broke above the trend line resistance as you can see on my H4 chart below. Immediate support is seen around 113.40. A clear break below that area could lead price to neutral zone in nearest term testing 112.90 support area which is a good place to buy with a tight stop loss.
USDCHF
The USDCHF continued its bullish momentum yesterday topped at 1.0090. Price broke above the trend line resistance as you can see on my H4 chart below suggests a bullish outlook. The bias remains bullish in nearest term testing 1.0170. Immediate support is seen around 1.0020. A clear break back below that area could lead price to neutral zone in nearest term as direction would become unclear. Overall I remain neutral.
Technical Outlook: USDJPY – Fibo 61.8% Barrier At 114.62 Is In Focus But Overbought Daily Studies May Delay Bulls
The pair is consolidating around 114.00 handle following Tuesday's strong rally that peaked at 114.31and closed above 113.75 pivot (Fibo 76.4% of 115.49/108.11 descend.
Dips from 114.31 peak were so far shallow and found support at 113.60, as overall picture remains firmly bullish and favors further upside for test of next strong barrier at 114.62 (Fibo 61.8% of 118.65/108.11 descend), break of which and weekly close above it would add to existing bullish bias.
Caution on overbought daily RSI which is turning lower and bearish divergence on overbought slow stochastic that may signal stronger correction.
Extension below 113.46 (Fibo 38.2% of 112.07/114.31 upleg) would generate stronger bearish signal and risk test of 100SMA (113.06).
Extended dips should find support above daily clod top (112.79) to keep overall bullish structure intact.
Res: 114.11, 114.31, 114.62, 114.87
Sup: 113.60, 113.46, 113.06, 112.79