
Sample Category Title
AUD/USD Candlesticks and Ichimoku Analysis
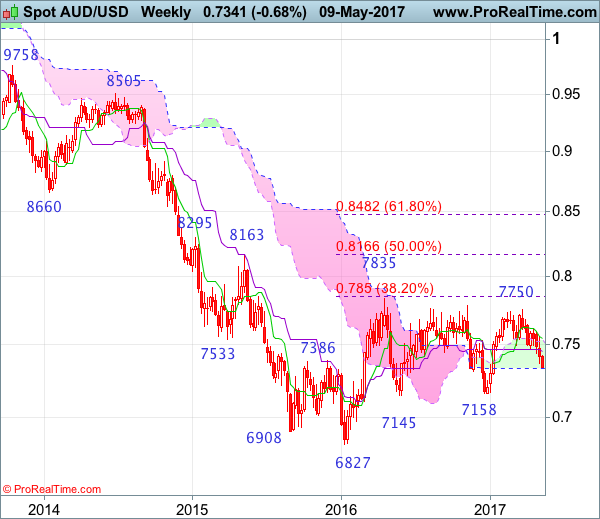
Weekly
• Last Candlesticks pattern: Shooting doji
• Time of formation: 20 Feb 2017
• Trend bias: Sideways
Daily
• Last Candlesticks pattern: Bearish engulfing pattern
• Time of formation: 21 Mar 2017
• Trend bias: Near term down
As aussie has dropped again after brief, adding credence to our bearish view (our short position entered at 0.7590 met target at 0.7390 with 200 points profit) and downside bias remains for the decline from 0.7750 to bring at least a strong retracement of the rise from 0.7158, hence further weakness to 0.7300-10 and possibly 0.7250-60 is underway, however, near term oversold condition should prevent sharp fall below 0.7200-10 and price should stay well above support at 0.7158.
On the upside, whilst initial recovery to 0.7400 cannot be ruled out, reckon the Tenkan-Sen (now at 0.7443) would limit upside and bring another decline later. A daily close above 0.7490-00 would defer and risk a stronger rebound towards resistance at 0.7556 but break there is needed to signal a temporary low is formed instead, bring a stronger rebound to 0.7590-95 but price should falter below resistance at 0.7611 and bring another decline later.
Recommendation: Target met and sell aussie again at 0.7440 for 0.7240 with stop above 0.7540.
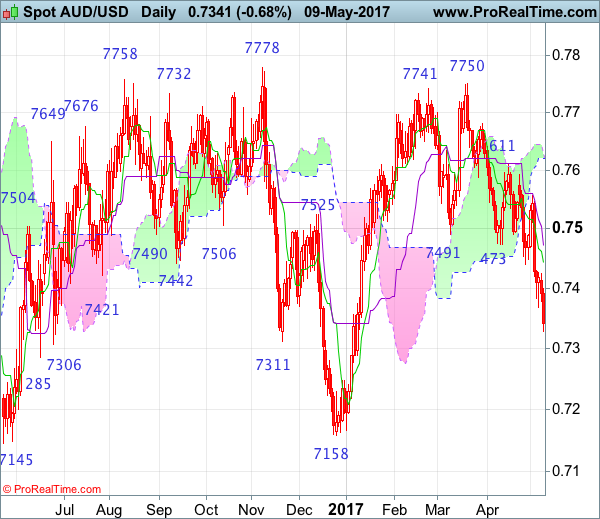
On the weekly chart, last week’s selloff adds credence to our view that the rebound from 0.7158 has ended at 0.7750, bearishness remains for the fall from there to extend further decline to 0.7290-00 and possibly towards 0.7230, however, reckon downside would be limited to 0.7200 and price should stay well above previous support at 0.7158, risk from there is seen for a rebound to take place later.
On the upside, although initial recovery to 0.7420-30 cannot be ruled out, reckon the Kijun-Sen (now at 0.7454) would limit upside and bring another decline later. Only above last weeks high at 0.7556 would abort and signal low is formed instead, risk a stronger rebound to 0.7590-95 but break of resistance at 0.7611 is needed to add credence to this view, bring further gain towards resistance at 0.7680 but a sustained breach above this level is needed to signal the retreat from 0.7750 has ended, bring another bounce towards this level.
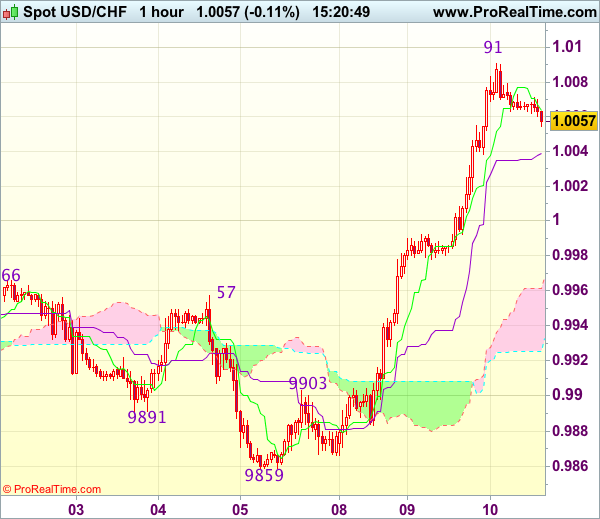
Trade Idea : USD/CHF – Buy at 1.0005
USD/CHF - 1.0066
Most recent candlesticks pattern : N/A
Trend : Near term up
Tenkan-Sen level : 1.0064
Kijun-Sen level : 1.0039
Ichimoku cloud top : 0.9961
Ichimoku cloud bottom : 0.9926
Original strategy :
Buy at 0.9980, Target: 1.0080, Stop: 0.9945
Position : -
Target : -
Stop : -
New strategy :
Buy at 1.0005, Target: 1.0105, Stop: 0.9970
Position : -
Target : -
Stop : -
Although dollar has eased after rising to 1.0091 and consolidation below this level would be seen, reckon pullback would be limited to the Kijun-Sen (now at 1.0039) and renewed buying interest should emerge around 1.0000-05, bring another rise, above said resistance would add credence to our view that early upmove has resumed for retest of 1.0108 resistance, break there would confirm and encourage for headway to 1.0130 and then 1.0150-55.
In view of this, would not chase this rise here and we are looking to buy dollar on pullback as 1.0000-05 should limit downside. Only below previous resistance at 0.9957 would defer and suggest top is possibly formed, bring test of 0.9920-25 but break of previous resistance at 0.9903 is needed to add credence to this view, bring further fall to 0.9880-85.
Forex Technical Analysis: EUR/USD, USD/JPY, GBP/USD
EUR/USD
Current level - 10886
Yesterday's slide broke below 1.0870 low, thus showing a negative bias on the senior frames, for further depreciation towards 1.0700 area. Key resistance lies at 1.0950.
| Resistance | Support | ||
| intraday | intraweek | intraday | intraweek |
| 1.0950 | 1.1020 | 1.0870 | 1.0780 |
| 1.1020 | 1.1150 | 1.0780 | 1.0676 |
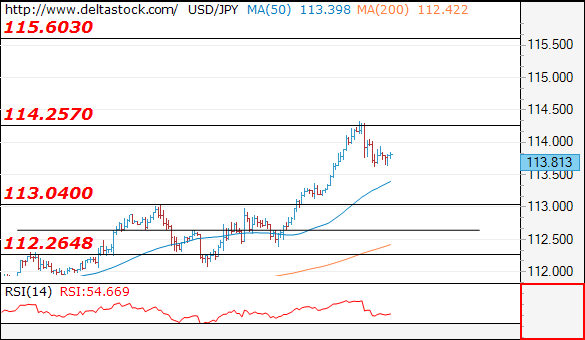
USD/JPY
Current level - 113.81
Today's pullback below 104.30 should be considered corrective in nature, thus preceding another leg upwards, to 115.60 resistance zone. Major support is projected at 113.07 level.
| Resistance | Support | ||
| intraday | intraweek | intraday | intraweek |
| 114.25 | 113.50 | 113.00 | 109.40 |
| 115.60 | 115.60 | 112.35 | 108.12 |
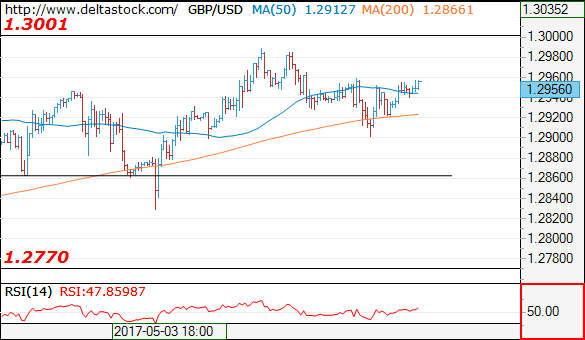
GBP/USD
Current level - 1.2956
The bias here remains neutral, as major resistance is still 1.3000 sentiment area and initial support lies at 1.2900, followed by the crucial one at 1.2830.
| Resistance | Support | ||
| intraday | intraweek | intraday | intraweek |
| 1.3000 | 1.3120 | 1.2900 | 1.2610 |
| 1.3000 | 1.3500 | 1.2830 | 1.2510 |
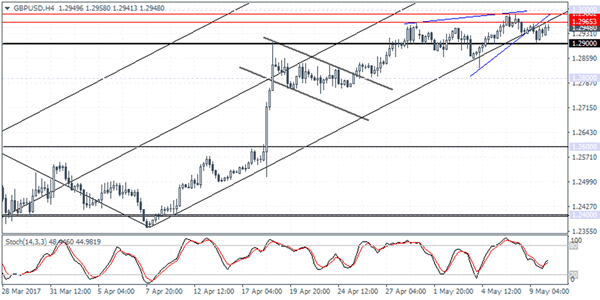
Trade Idea : GBP/USD – Stand aside
GBP/USD - 1.2980
Most recent candlesticks pattern : N/A
Trend : Near term up
Tenkan-Sen level : 1.2963
Kijun-Sen level : 1.2944
Ichimoku cloud top : 1.2952
Ichimoku cloud bottom : 1.2951
New strategy :
Stand aside
Position : -
Target : -
Stop : -
Despite yesterday’s euro-led retreat to 1.2903, as cable found good support there and has staged a strong rebound, suggesting the pullback from 1.2991 has possibly ended there and gain towards 1.2999-00 (1.236 times projection of 1.2109-1.2616 measuring from 1.2365 and psychological resistance) cannot be ruled out, however, break there is needed to signal recent upmove has resumed and extend further rise to 1.3040-50, then towards 1.3075-80 which is likely to hold from here due to near term overbought condition.
In view of this, would be prudent to stand aside in the meantime. Below 1.2940 would brig another test of said support at 1.2903, however, break there is needed to revive near term bearishness and suggest a temporary top has been formed at 1.2991, bring correction to 1.2875-80 but price should stay well above last week’s low at 1.2831.
U.S. Equities Reach New Highs – Still Boring!
The best way to describe recent market price action is boring. Although S&P 500 touched a new record-high on Tuesday, the index has been trading in a range of less than 0.5% for the past ten days, and when excluding the rise of 0.41% on 5th May, it was a trading range of less than 0.2%.
Low volatility indicates that investors seem to be relaxed for now. Although they're not willing to take much risk, they aren't worried about a sharp correction. Multiple factors may explain the low volatility: steady earnings, stable economic indicators, and a decline in equities correlation, limiting a one-sided move. One of the questions I hear all day, is how long can this prolonged period of low volatility last? But the more important question should be, what direction are equities going to take when volatility returns?
First, let's examine how markets reacted in the immediate aftermath of historic low volatility levels:
July 1993: The VIX fell to 9.11, S&P 500 gained 3.6% in the following eight weeks.
December 1993: the VIX dropped to a low of 8.89, four weeks later the S&P 500 surged 2.6%, then fell by more than 7% in two months.
December 2006: the VIX fell below 10. S&P 500 posted gains of 3.25% in ten weeks, followed by a 6.7% correction.
The takeaway from these samples is that for the most part, when the VIX falls below the 10 benchmark, equities make short-term gains, followed by a correction. On the longer-term, it's much different. For example, in 1995 the S&P 500 surged 37.2% and in 2008 crashed 36.55%, suggesting that the VIX is a poor indicator of long-term trends.
A period of very low volatility doesn't persist for long, and it only needs little surprises, whether it's macro factors, a change in earnings expectations, or a political shock to change investors' behavior.
I still believe that valuations are overstretched, and if not supported by stronger earnings in the next two quarters, it will be hard to justify current price levels, especially considering that fixed income instruments will become more attractive as the Fed and other central banks start tightening monetary policies. I will also keep a close eye on oil prices, although I believe that we'll be ending the year above $50. Any sharp move to the downside from current levels will drag equities with it.
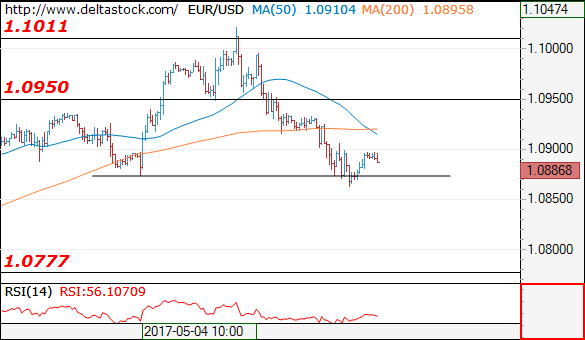
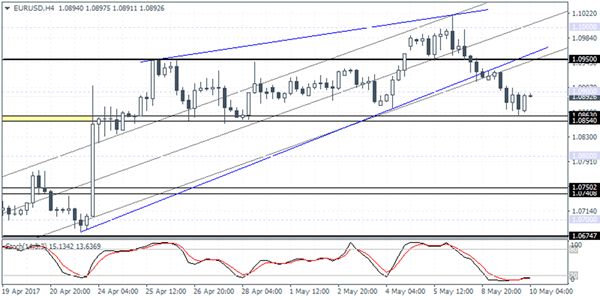
Trade Idea : EUR/USD – Sell at 1.0955
EUR/USD - 1.0895
Most recent candlesticks pattern : N/A
Trend : Near term up
Tenkan-Sen level : 1.0890
Kijun-Sen level : 1.0895
Ichimoku cloud top : 1.0971
Ichimoku cloud bottom : 1.0941
Original strategy :
Sell at 1.0970, Target: 1.0870, Stop: 1.1005
Position : -
Target : -
Stop : -
New strategy :
Sell at 1.0955, Target: 1.0855, Stop: 1.0990
Position : -
Target : -
Stop : -
As the single currency has recovered after falling to 1.0863, suggesting minor consolidation above this level would be seen and recovery to 1.0920-25 cannot be ruled out, however, if our view that top has been formed at 1.1025 is correct, upside should be limited to 1.0960-70 and bring another decline later, below said support at 1.0863 would add credence to this view and extend the fall from there for retracement of recent rise to 1.0851 support and possibly towards 1.0825-30 but reckon 1.0800 would hold from here due to near term overbought condition.
In view of this, we are looking to sell euro on recovery as 1.0960-70 should limit upside. Above resistance at 1.0997 would bring retest of said resistance at 1.1025, however, break there is needed to signal recent upmove from 1.0340 low has resumed for headway to 1.1050 but reckon upside would be limited to 1.1065-70 (61.8% projection of 1.0602-1.0951 measuring from 1.0851).
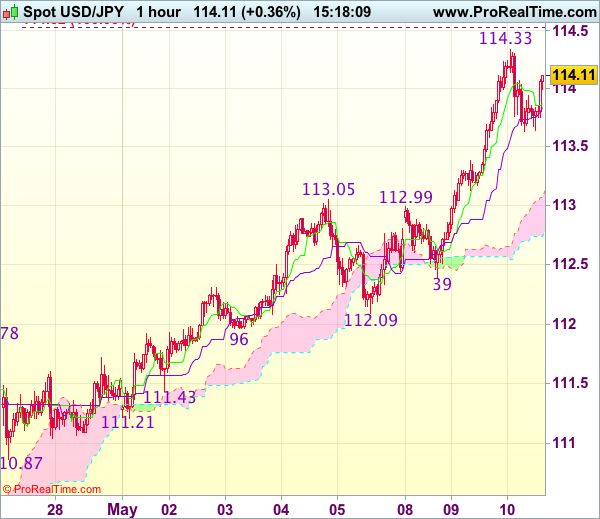
Trade Idea : USD/JPY – Buy at 113.35
USD/JPY - 114.07
Most recent candlesticks pattern : N/A
Trend : Near term up
Tenkan-Sen level : 113.88
Kijun-Sen level : 113.84
Ichimoku cloud top : 113.07
Ichimoku cloud bottom : 112.74
Original strategy :
Buy at 113.35, Target: 114.45, Stop: 113.00
Position : -
Target : -
Stop : -
New strategy :
Buy at 113.35, Target: 114.45, Stop: 113.00
Position : -
Target : -
Stop : -
Dollar’s retreat after rising to 114.33 suggests consolidation below this level would be seen and pullback to 113.50 cannot be ruled out, however, reckon 113.30-35 would limit downside and bring another rise later, above said resistance at 114.33 would extend recent upmove to 114.50-55 (100% projection of 108.13-111.78 measuring from 110.87), however, near term overbought condition should limit upside to 114.75-80 and price should falter below 115.00, bring retreat later.
In view of this, would not chase this rise here and would be prudent to buy dollar on pullback as 113.30-35 should contain downside. Only below previous resistance at 113.05 would defer and suggest top is formed, bring correction of recent upmove to 112.70-80 but reckon support at 112.39 would remain intact.
China’s Consumer Prices Increase in April
Consumer price index in China rose 1.2% on an annualized basis in the month of April, managing to beat estimates of 1.1% and higher than 0.9% from a month ago.
The increase in inflation came on an increase in consumer income which helped to boost consumption. Disposable incomes were up 7%, compared to 6.3% previously. Non-food prices also increased, up 0.2% from March's 0.6% decline.
Producer prices index was, however, disappointing as factory gate inflation rose just 6.4%, missing forecasts of a 6.8% increase and down from 7.6% last month.
The Australian dollar was seeing a modest recovery after the AUD fell to a fresh 4-month low at 0.7328 on the back of the positive inflation figures from China. Earlier in the day, the Australian budget was released which also added to the declines. Ratings agencies said that the budget was consistent with the stable outlook of AAA for the nation.
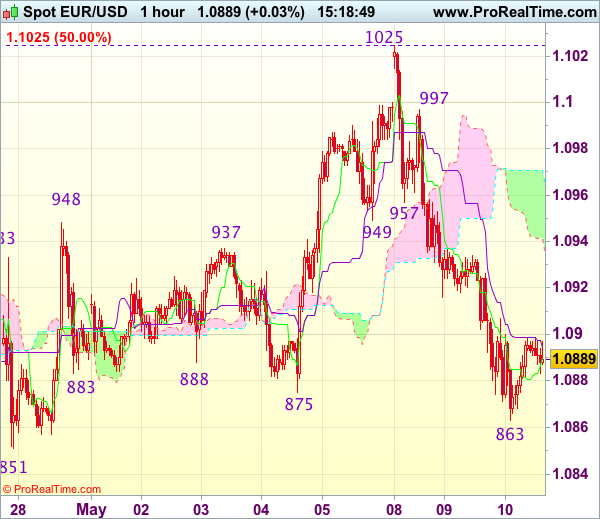
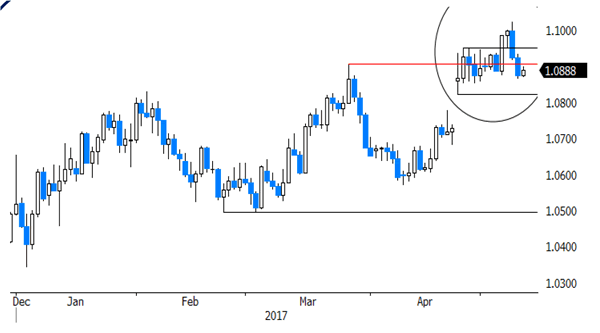
EURUSD intraday analysis
EURUSD (1.0892): After posting two strong days of declines which sent the euro lower by nearly 100 pips, EURUSD is attempting to recover some of the losses with price currently testing the 1.0900 price level.
Resistance could be forming at this level, but confirmation is required. Expect the bounce to push EURUSD around up to 1.0950, while to the downside watch for the main support at 1.0863 - 1.0854 region. A break down below this support is required for further downside towards 1.0750. ECB president, Mario Draghi is scheduled to speak today which could bring some event risk to the currency pair.
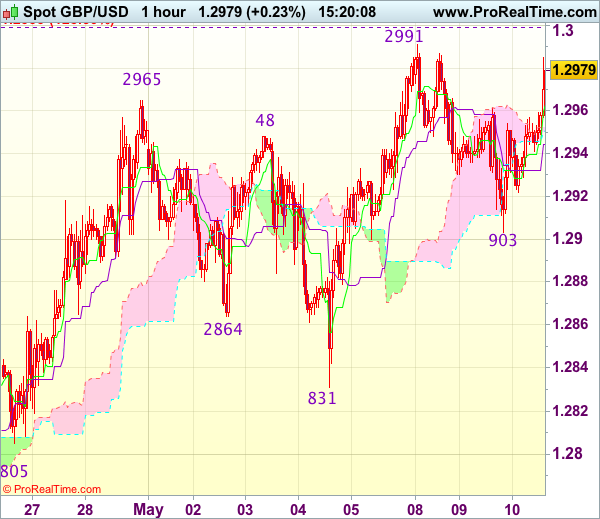
GBPUSD intraday analysis
GBPUSD (1.2948): The British pound closed in a doji yesterday as the currency pair stands firm at an 8-month high. The consolidation could keep prices choppy near 1.3000 handle but the bias remains to the downside unless we see a strong breakout above the 1.3000 handle.
On the 4-hour chart, price broke out from the rising wedge pattern as mentioned in yesterday's commentary but prices quickly recovered towards the close. Resistance at 1.2965 - 1.2988 remains the key price level of interest. As long as GBPUSD remains pressured below this resistance, there is scope for the price to break the support at 1.2900 and extend the declines towards 1.2600.
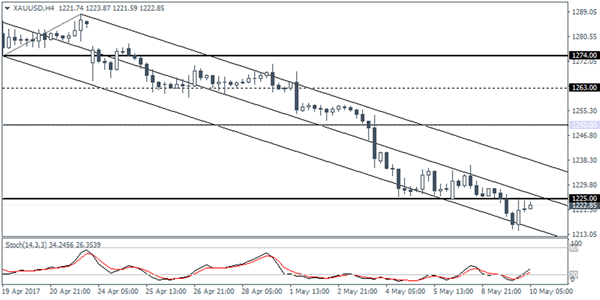
XAUUSD intraday analysis
XAUUSD (1222.85): Gold prices continued their declines with the price falling to a new two-month low at $1214.24 yesterday. The descent is expected to see gold prices continue to push lower towards the $1200.00 handle in the near term.
Any pullbacks ahead of the declines could see the possibility of a rally back to the $1250.00 handle, however. The daily Stochastics is very over-sold, highlighting this risk. On the 4-hour chart, the immediate resistance is now seen at 1225.00. A convincing breakout above this level will signal a short-term move towards 1225.00 - 1227.00.
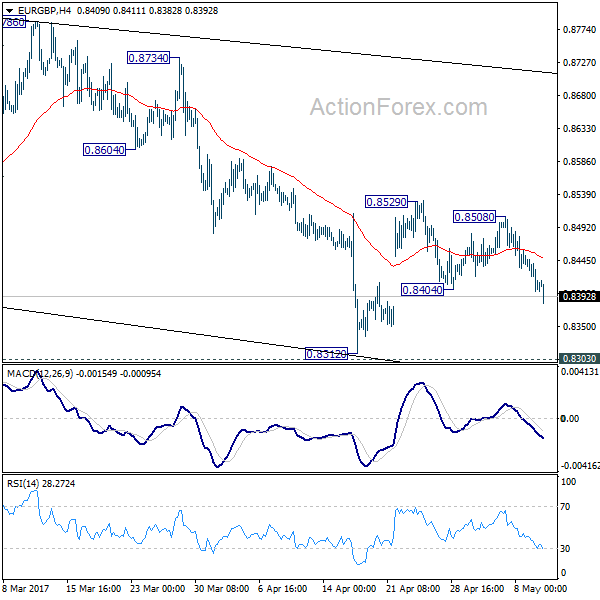
EUR/GBP Daily Outlook
Daily Pivots: (S1) 0.8389; (P) 0.8418; (R1) 0.8434; More...
Break of 0.8404 suggests that fall from 0.8529 is resuming. Intraday bias is turned to the downside for 0.8303/8312 support zone. Break there will extend the correction from 0.9304 and target 0.8116 cluster support. On the upside, break of 0.8508 will indicate that rise from 0.8312 is resuming and would target 0.8786 resistance instead.
In the bigger picture, price actions from 0.9304 are viewed as a medium term corrective pattern. In case of deeper fall, we'd expect strong support from 0.8116 cluster support (50% retracement of 0.6935 to 0.9304 at 0.8120) to contain downside. Rise from 0.6935 (2015 low) will resume at a later stage to 0.9799 (2008 high). However, sustained break of 0.8116 could bring deeper decline to next key support level at 0.7564 before the correction completes.
Currencies: Dollar Extends Gradual Rebound
Sunrise Market Commentary
Rates: Technically-inspired, sentiment-driven trading
Today's eco calendar suggests more technically-inspired and sentiment-driven trading. The underlying environment is unfriendly for core bonds. Comments by ECB President Draghi in Dutch parliament are a wildcard for trading and could move markets, especially if he touches on the sensitive issue of the June meeting.
Currencies: dollar extends gradual rebound
Yesterday, the dollar rebounded against the euro and the yen supported by higher core yields and a global risk-on sentiment. USD/JPY jumped temporary north of 114. The topside of EUR/USD looks better protected short-term unless Draghi would signal a change in the ECB approach, which we don't expect.
The Sunrise Headlines
- US stocks closed mixed with Nasdaq reaching a new record high, but S&P and Dow Jones correcting marginally lower. Overnight, most Asian bourses gain ground with South Korea underperforming.
- China's producer price gains slowed more than expected in April (from 7.6% Y/Y to % Y/Y),adding to signs of a potential easing of global reflation fuelled by the world's second-largest economy.
- President Trump unexpectedly fired FBI Director Comey, plunging the capital into confusion and intensifying calls for a special prosecutor to assume control of the investigation into possible ties between the Trump campaign and Russia.
- Marion Maréchal-Le Pen is set to announce that she will retire from politics. The decision comes amid tensions between her and senior party officials who are attempting to take FN in a radically different direction.
- Despite a weak read on economic growth and cooling auto sales, Kansas City Fed George said that the US economy is on track to grow at “a slightly above-trend rate”. The central bank's current path of rate hikes remains the right one.
- The Australian government surprisingly announced a 6 bps levy on deposits of the country's 5 biggest banks in its annual budget, a measure that will deliver A$6.2B through to 2020-21 as it aims to get its finances back into the black.
- Today's eco calendar is empty. Germany and the US tap the market. ECB president Draghi speaks in Dutch parliament and Fed governors Rosengren and Kashkari also take parole. The RBNZ decides on monetary policy...
Currencies: Dollar Extends Gradual Rebound
Dollar cautiously higher in technical trading
On Tuesday, the risk rally resumed after Monday's pause. The eco data were few and were ignored. The safe haven currencies like the yen and the Swiss franc were sold. Contrary to the recent pattern, the dollar profited more from the riskon sentiment and from the rise in core yields than the euro. USD/JPY rebounded north of the 114 area, but risk sentiment eased when President Trump fired FBI director Comey. USD/JPY closed the session 113.98 (from 113.26). The dollar maintained most of its intraday gains against the euro. EUR/USD finished the day at 1.0874 (from 1.0925).
Overnight, Asian equities trade slightly positive with Korea underperforming. The yuan trades little changed after CPI/PPI releases (see news) at USD/CNY 6.9050, near the recent yuan lows. The dollar trades marginally softer against the euro and the yen respectively at EUR/USD 1.0895 and 113.80.
Today, the eco calendar is uneventful. ECB's Draghi speaks before the Dutch parliament. It is a wildcard. Other ECB members recently suggested that the balance of risks may be upgraded at the June meeting and some suggested that the policy outlook for a longer term might be discussed and eventually changed. We doubt that Draghi will join the debate at this forum, but if he would do so it would raise EMU yields and the euro
Yesterday, fortunes changed temporarily in favour of the dollar. The positive risk sentiment and a modest rise in core yields supported the dollar. The decline in EUR/USD was probably due to a further unwinding of euro longs, but at the same time USD/JPY went higher too. We expect some consolidation unless there comes some high profile news e. g. from central bankers. If Draghi maintains the soft mantra from the April press conference, the topside in EUR/USD is probably better protected short-term. A retest of the 1.0821 correction low is still possible. The USD/JPY trend remains positive and a meaningful equity correction, which we don't see for now, is probably needed to change this trend. So, the downside in USD/JPY looks solid. Friday's US data (retail sales and CPI) are probably the next points of reference for USD trading
From a technical point of view, USD/JPY broke the 112.20 resistance last week, improving the technical picture. The rebound continues in a gradual way, but looks quite robust. Next intermediate resistance comes in at 115.51. EUR/USD extensively tested the topside of the MT range (1.0874/1.0906 area) late March. The pair returned to that range top and broke above the 1.09/1.0950 resistance at the end of last week. However, the break wasn't confirmed and a correction kicked in this week. A sustained break higher would improve the ST picture. Next resistance stands at 1.1129 (62% retracement) and at 1.1366 (correction top). A decline below 1.0821 would suggest that the dollar is regaining traction against the euro.
USD topside test again rejected. Return action to 1.0821 is possible, but won't change the broader picture
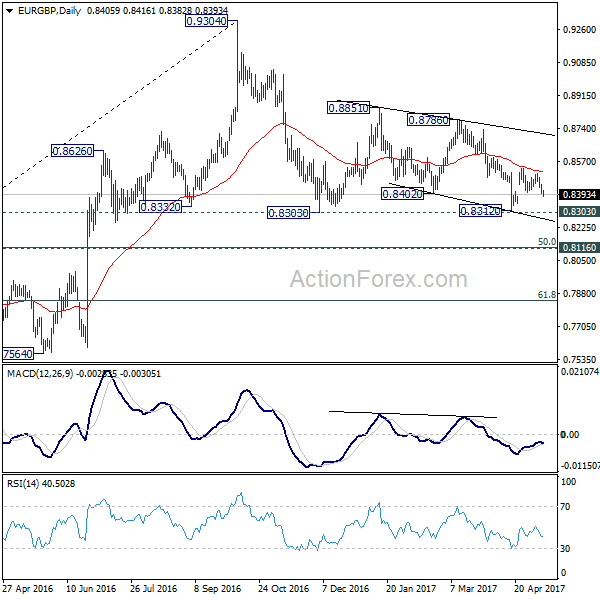
EUR/GBP
EUR/GBP drifting back to 0.84 area.
Yesterday, sterling was still driven by non-UK factors. EUR/GBP drifted cautiously lower in the 0.84 big figure, feeling a modest spill-over effect from the broader EUR/USD correction. The pair closed the session at 0.8407 (from 0.8442). Cable outperformed EUR/USD as the dollar rebounded overall. This again suggests underlying GBP resilience. The pair closed the session at 1.2934 (from 1.2940).
Today, there are no eco UK or EMU eco data. Calm technically inspired trading ahead of tomorrow's BoE meeting is likely. We expected Carney and Co to maintain a balanced tone as there is no reason to reinforce the hawkish rhetoric after more modest Q1 growth and going into June's parliamentary elections. A balanced tone from the BoE is not really supportive for sterling. Even so, the UK currency remains resilient for now. EUR/GBP filled the gap of the euro rebound after the first round of the French election. Will this slow slide of EUR/GBP going into the BoE policy decision continu?
Two weeks ago, EUR/GBP dropped below EUR/GBP 0.84 support, (temporary) improving the sterling picture. The pair came within reach of key 0.8305 support (Dec low), but no real test occurred. After a late April EUR/GBP rebound, the range bottom is better protected. Longer term, Brexit-complications remain potentially negative for sterling. On technical considerations, we slightly prefer a EUR/GBP buy-on-dips approach
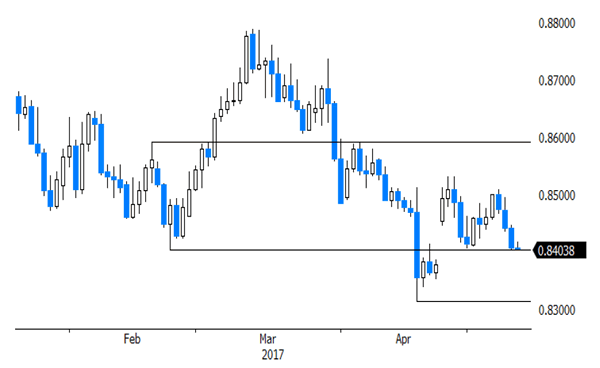
EUR/GBP: trading within a tight 0.83/0.85 range