
Sample Category Title
Canada’s Housing Starts Declined In March
For the 24 hours to 23:00 GMT, the USD rose 0.33% against the CAD and closed at 1.3695.
Macroeconomic data indicated that Canada's seasonally adjusted housing starts fell more-than-expected to a level of 214.1K in April, from a revised ten-year high level of 252.3K registered in the prior month.
In the Asian session, at GMT0300, the pair is trading at 1.3694, with the USD trading a tad lower against the CAD from yesterday's close.
The pair is expected to find support at 1.3645, and a fall through could take it to the next support level of 1.3596. The pair is expected to find its first resistance at 1.3738, and a rise through could take it to the next resistance level of 1.3782.
Going ahead, Canada's building permits data for March, slated to release later in the day, will garner a lot of market attention.
The currency pair is showing convergence with its 20 Hr moving average and trading below its 50 Hr moving average.

EUR/USD Daily Outlook
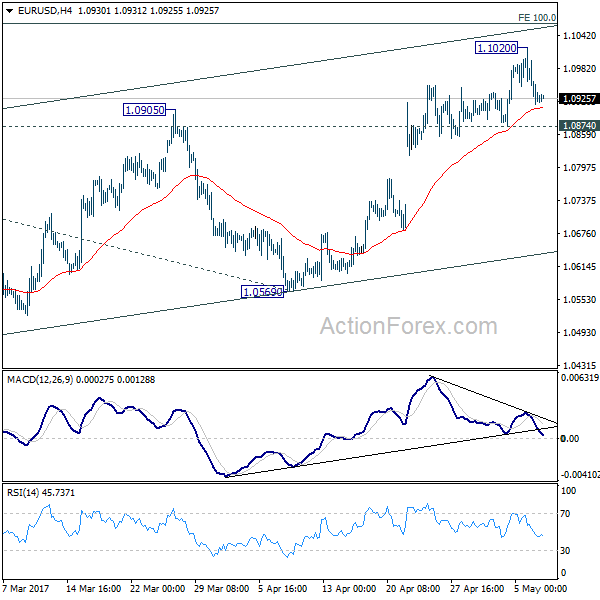
Daily Pivots: (S1) 1.0885; (P) 1.0953 (R1) 1.0991; More....
Intraday bias in EUR/USD remains neutral for consolidation below 1.1020 temporary top. Another rise will be expected as long as 1.0874 support holds. Above 1.1020 will extend current rally to 100% projection of 1.0339 to 1.0828 from 1.0569 at 1.1058. However, rise from 1.0339 is still seen as a corrective move. Hence we'd expect strong resistance from 1.1058 projection to limit upside and bring near term reversal. On the downside, break of 1.0874 support will turn bias back to the downside for 1.0569 support first.
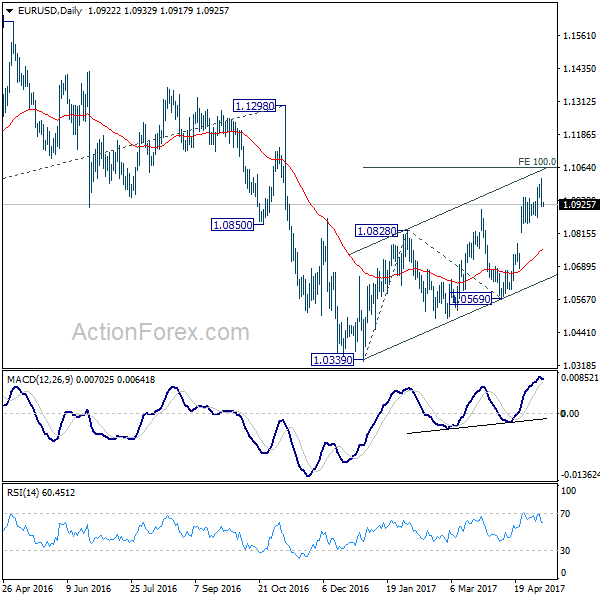
In the bigger picture, as long as 1.1298 key resistance holds, whole down trend from 1.6039 (2008 high) is still expected to continue. Break of 1.0339 low will send EUR/USD through parity to 61.8% projection of 1.3993 to 1.0461 from 1.1298 at 0.9115. However, considering bullish convergence condition in weekly MACD, break of 1.1298 will indicate long term reversal.
GBP/USD Daily Outlook
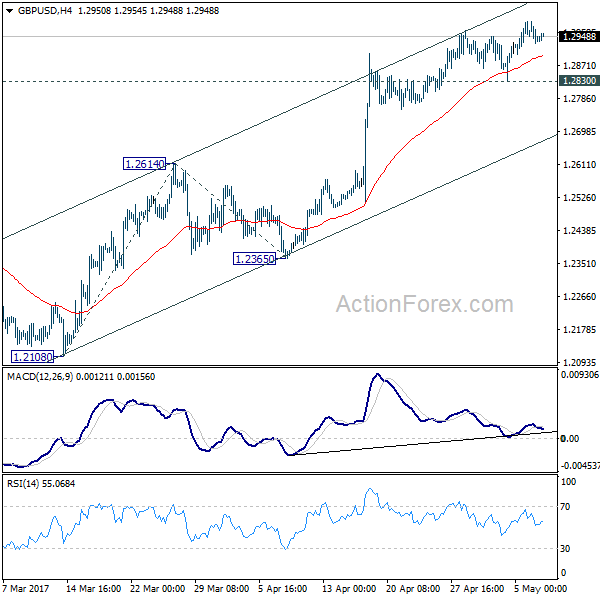
Daily Pivots: (S1) 1.2917; (P) 1.2952; (R1) 1.2976; More...
With 1.2830 minor support intact, further rise is still expected in GBP/USD. Current rally would target 161.8% projection of 1.2108 to 1.2614 from 1.2365 at 1.3184. At this point, price actions from 1.1946 are still interpreted as a correction pattern. Therefore, we'd expect strong resistance below 1.3444 to bring larger down trend resumption. On the downside, break of 1.2830 support will indicate short term topping. In such case, intraday bias will be turned back to the downside for 1.2614 support.
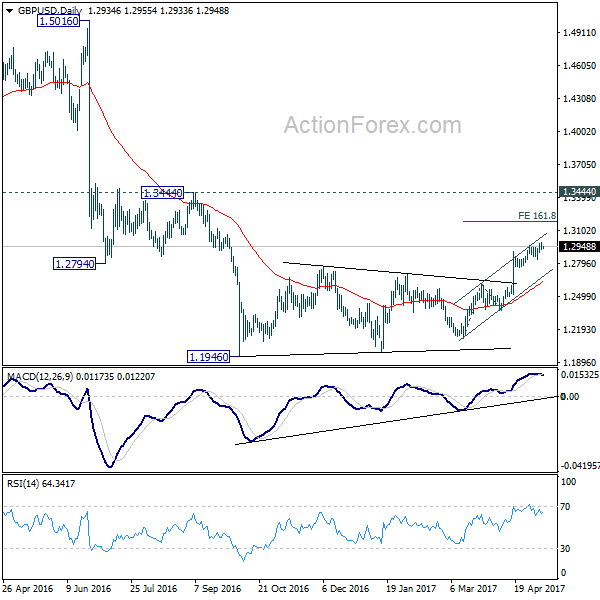
In the bigger picture, fall from 1.7190 is seen as part of the down trend from 2.1161. There is no sign of medium term reversal yet. Sustained trading below 61.8% projection of 2.1161 to 1.3503 from 1.7190 at 1.2457 will target 100% projection at 0.9532. Overall, break of 1.3444 resistance is needed to confirm medium term bottoming. Otherwise, outlook will remain bearish.
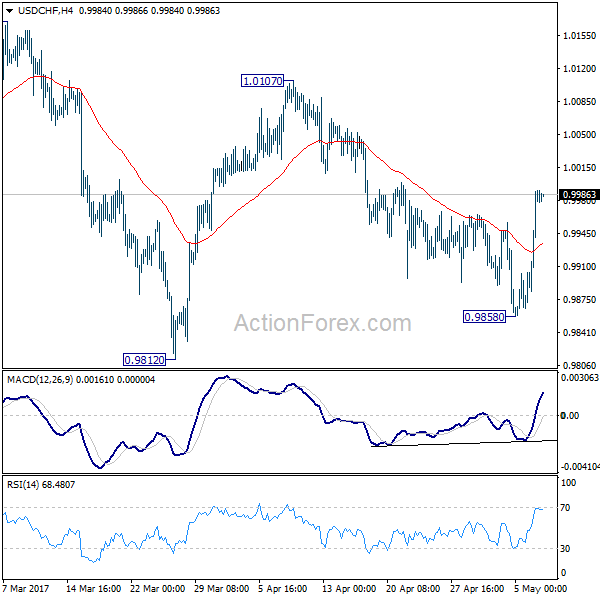
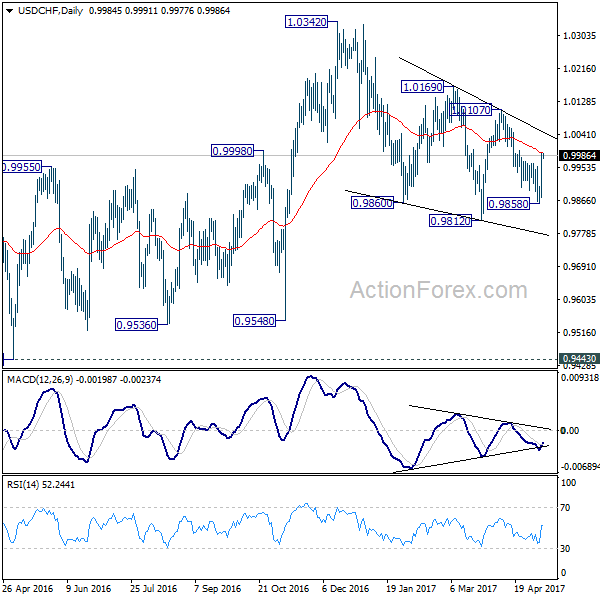
USD/CHF Daily Outlook
Daily Pivots: (S1) 0.9905; (P) 0.9948; (R1) 1.0030; More.....
Intraday bias in USD/CHF remains on the upside for 1.0107 resistance. Current development revived the case that correction from 1.0342 is already completed at 0.9812. Break of 1.0107 will bring a retest on 1.0342 high. Nonetheless, on the downside, break of 0.9858 will turn bias to the downside and target 0.9812 and below.
In the bigger picture, we're still maintaining that firm break of 1.0342 key resistance is needed to confirm underlying bullish momentum in the pair. However, the corrective nature of the fall from 1.0342 is starting to give the medium term outlook a bullish favor. Hence, in stead of looking for topping signal around 1.0342, we'd now pay closer attention to upside acceleration as USD/CHF approaches this level again.
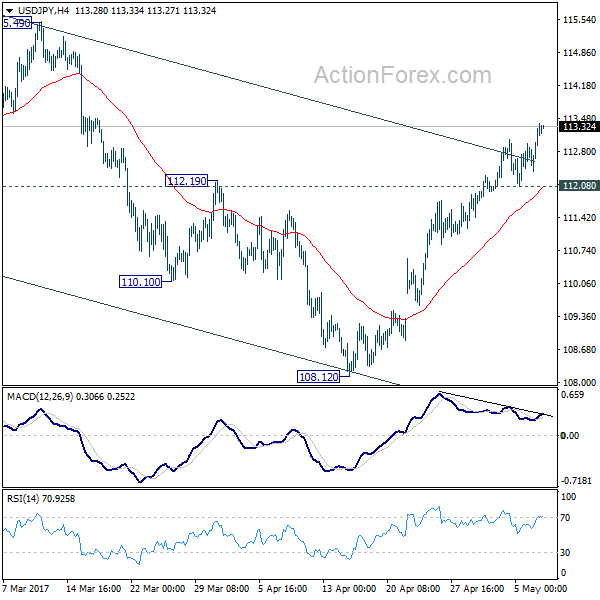
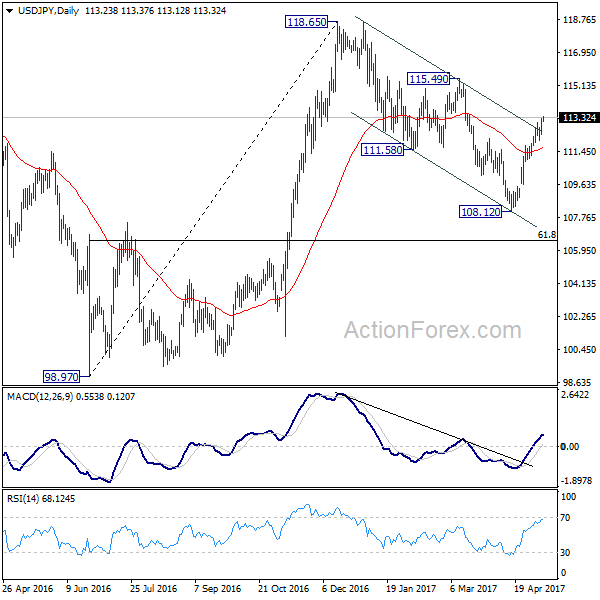
USD/JPY Daily Outlook
Daily Pivots: (S1) 112.66; (P) 112.98; (R1) 113.56; More...
USD/JPY's rally resumed after brief consolidation and reaches as high as 113.37 so far. Intraday bias is back on the upside for 115.49 resistance. We're holding on to the view that corrective fall from 118.65 could be completed with three waves down to 108.12. Break of 115.49 will resume larger rally from 98.97 to 125.85 high. On the downside, break of 112.08 support is needed to indicate near term topping. Otherwise, outlook will remain bullish in case of retreat.
In the bigger picture, price actions from 125.85 high are seen as a corrective pattern. It's uncertain whether it's completed yet. But in case of another fall, downside should be contained by 61.8% retracement of 75.56 to 125.85 at 94.77 to bring rebound. Meanwhile, break of 115.49 resistance will extend the rise from 98.97 to retest 125.85. Overall, rise from 75.56 is still expected to resume later after the correction from 125.85 completes.
EUR/CHF Daily Outlook
Daily Pivots: (S1) 1.0867; (P) 1.0892; (R1) 1.0936; More...
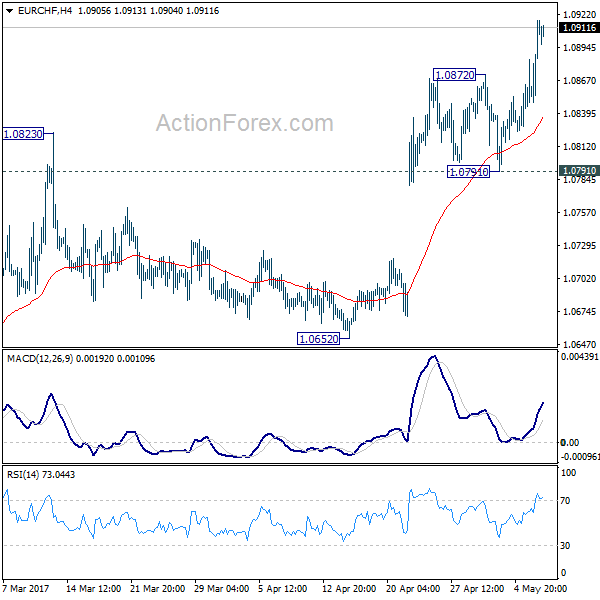
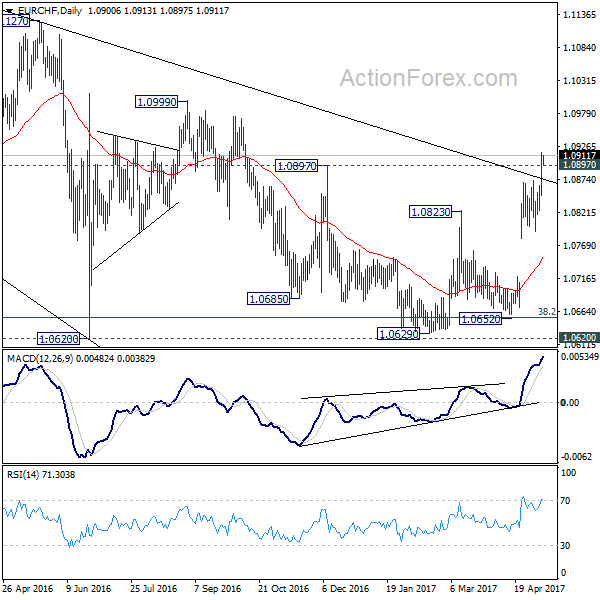
EUR/CHF's rally extends to as high as 1.0917 so far. The firm break of 1.0897 resistance as well as the medium term falling trend line affirmed our view of trend reversal. That is, whole correction from 1.1198 is completed. This is also supported by upside acceleration as seen in daily MACD. Intraday bias bias remains on the upside for 1.0999 resistance next. Break there will pave the way for a retest on 1.1198 high. On the downside, below 1.0872 minor support will turn bias neutral and bring consolidation. But retreat should be contained by 1.0791 support to bring another rally.
In the bigger picture, the price actions from 1.1198 are seen as a corrective move. Current strong rebound is raising the chance that it's completed after defending 38.2% retracement of 0.9771 to 1.1198 at 1.0653. Decisive break of 1.0999 resistance will target a test on 1.1198 high. For now, this will be the preferred case as long as 1.0791 support holds.
Dollar Followed Yield Higher, Sterling and Kiwi Firm ahead of Central Bank Meetings
Dollar followed US stocks and yields higher overnight but it's losing momentum in Asian session. 30 year yield was back above 3.0 handle and closed at 3.014, up 0.025. 10 year yield also reached as high as 2.390 before closing at 2.376, up 0.024. 10 year yield is now close to 2.391 near term structure resistance. Meanwhile, Dollar index staged a solid rebound and is back above 99, comparing to last week's low at 98.54. But it will take a break of 99.46 resistance in the Dollar index to confirm near term reversal. In other markets, Gold dipped to as low as 1221 yesterday and is staying soft at around 1227. WTI crude oil's rebound from 43.76 lost steam after failing to take out 47.01 near term resistance.
Cleveland Fed Mester: Be very vigilant against falling behind
Cleveland Fed President Loretta Mester said that Fed had already met the "maximum employment" part of the duel mandate. Meanwhile, inflation is also "nearing our 2 percent goal". To her, risks are "roughly balanced" and she urged to be "very vigilant against falling behind" and there should be no delay in further policy tightening. She warned that "if we delay too long in taking the next normalization step...we could risk a recession." Mester also sounded trying to talk down Q1 weakness as she said "although we live in a high-frequency world, we cannot overreact to transitory movements in incoming data." And she expects a "rebound in consumer spending over the rest of the year".
St. Louis Fed Bullard much more cautious
On the other hand, St. Louis Fed President James Bullard sounded much more cautious. He noted that "the first-quarter GDP growth was disappointing and it means we are starting the year in an inauspicious way...It was consumption growth that was weaker and that is a concern because consumption has been a strong point." Also, "on inflation the numbers were disappointing. We have been telling a story that we are trending back towards 2 percent and we went the other way." Regarding interest rate he said that "the policy rate is approximately at an appropriate setting today."
Room for hawkish twist in BoE
Sterling is mildly firmer this week as markets await BoE Super Thursday. While no change in policies is generally expected, a focus will be on the vote split. It should be reminded again then Sterling launched this round of rally against Dollar and Euro after Kristin Forbes surprised the markets by voting for a rate hike back in March. Weak Q1 growth might keep other MPC hawks from joining Forbes. But the hawk camp could be getting more impatient with headline CPI back in target range at 2.3% yoy in March.
While there are still many uncertainties around Brexit, it should also be noted that interest rate is held at an ultra low level at 0.25%. BoE Governor Mark Carney has already been clear that some policy tightening is considered in the central bank's economic projections. But now markets are pricing in less than 60% chance of any move by BoE before end of 2018. There is much room for a hawkish twist in BoE's announcements this weak that could lift Sterling further.
NZD/JPY to face 78.74/82 resistance
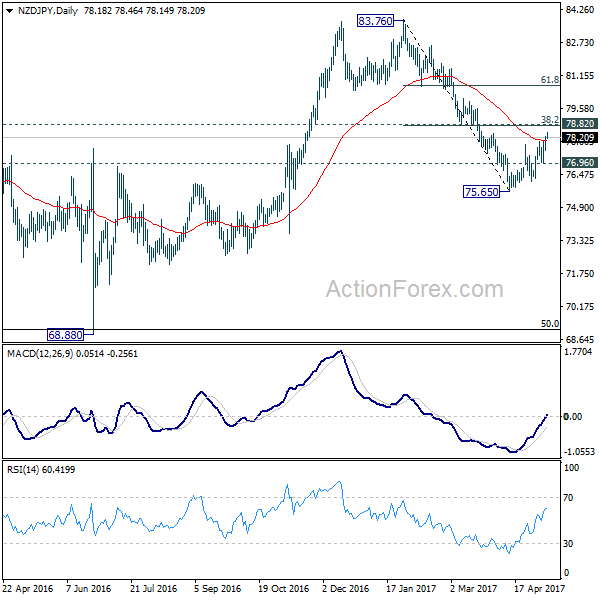
New Zealand Dollar also firmed up again this week as markets await a more upbeat RBNZ statement. NZD/JPY and AUD/NZD are indeed the two top movers this month as Kiwi decoupled from Aussie. Taking a look at NZD/JPY, the rebound from 75.65 is extended to as high as 78.46 so far. But it seems to be struggling to find follow through buying above 55 day EMA. Price actions from 75.65 is also corrective looking. Hence, while further rise could be seen in near term, we'd be cautious on strong resistance from 78.82 cluster (38.2% retracement of 83.76 to 75.65 at 78.74) to limit upside. Break of 76.96 minor support will resume the fall fro 83.76 through 75.65 low.
On the data front
Japan labor cash earnings dropped -0.4% yoy in March. Australia retail sales rose 0.1% mom in March. UK BRC retail sales monitor rose 5.6% yoy in April. Swiss will release unemployment rate. Germany will release industrial production and trade balance. Canada will release building permits today.
EUR/CHF Daily Outlook
Daily Pivots: (S1) 1.0867; (P) 1.0892; (R1) 1.0936; More...
EUR/CHF's rally extends to as high as 1.0917 so far. The firm break of 1.0897 resistance as well as the medium term falling trend line affirmed our view of trend reversal. That is, whole correction from 1.1198 is completed. This is also supported by upside acceleration as seen in daily MACD. Intraday bias bias remains on the upside for 1.0999 resistance next. Break there will pave the way for a retest on 1.1198 high. On the downside, below 1.0872 minor support will turn bias neutral and bring consolidation. But retreat should be contained by 1.0791 support to bring another rally.
In the bigger picture, the price actions from 1.1198 are seen as a corrective move. Current strong rebound is raising the chance that it's completed after defending 38.2% retracement of 0.9771 to 1.1198 at 1.0653. Decisive break of 1.0999 resistance will target a test on 1.1198 high. For now, this will be the preferred case as long as 1.0791 support holds.
Economic Indicators Update
| GMT | Ccy | Events | Actual | Forecast | Previous | Revised |
|---|---|---|---|---|---|---|
| 23:01 | GBP | BRC Retail Sales Monitor Y/Y Apr | 5.60% | 0.50% | -1.00% | |
| 0:00 | JPY | Labor Cash Earnings Y/Y Mar | -0.40% | 0.40% | 0.40% | |
| 1:30 | AUD | Retail Sales M/M Mar | 0.10% | 0.30% | -0.10% | |
| 5:45 | CHF | Unemployment Rate Apr | 3.30% | 3.40% | ||
| 6:00 | EUR | German Industrial Production M/M Mar | -0.70% | 2.20% | ||
| 6:00 | EUR | German Trade Balance (EUR) Mar | 21.7B | 21.0B | ||
| 12:30 | CAD | Building Permits M/M Mar | -2.50% | |||
| 14:00 | USD | Wholesale Inventories Mar F | -0.10% | -0.10% |
Elliott Wave View: SPX Ending Diagonal
Short Term Elliott Wave view in SPX suggests the rally from 3/27 low (2322.2) is unfolding as a leading diagonal Elliott Wave structure where Minute wave ((i)) ended at 2378.36, Minute wave ((ii)) ended at 2328.95, Minute wave ((iii)) ended at 2398.16, and Minute wave ((iv)) ended at 2379.75. The Index has broken above previous Minute wave ((iii)) and thus it has met the minimum requirement in the number of swing to end cycle from 3/27 low as a diagonal. However, while near term pullbacks stay bove 2379, further upside still can’t be ruled out before cycle from 3/27 low ends. Near term focus is on 2403 – 2406 area to complete Minutte wave (a), then Index should pullback in Minutte wave (b) in 3, 7, or 11 swing to correct cycle from 5/3 low before Index resumes higher. We don’t like selling the Index.
SPX 1 Hour Elliott Wave Chart
Market Morning Briefing: No Fresh Triggers In The Market
STOCKS
Globally stocks are mixed. China looks negative while Europe and US looks potentially bullish. Japanese and Indian stocks could remain ranged in the near term.
Dow (21012.28, +0.03%) is almost stable and is trying to slowly inch up towards 21050-21100 in the next few sessions. Overall we may see a test of decent resistance near 21200 in the near term.
Dax (12694.55, -0.18%) saw it’s first dip in the last 12-13 sessions. If the dip continues, we may see a fall towards 12600-12500 levels before again rising back to test 12800 in the near term. A break above 12800 could take it higher towards 13000 but it could take some time.
Shanghai (3062.38, -0.53%) is trading below our expected 3075 levels and while that holds, we could see a fall towards 3050-3000 in the near term. Only a sustained recovery above 3100 could negate the near term bearish possibility.
Nikkei (19868.25, -0.14%) saw its first dip in the last few sessions from levels below resistance near 20000. While that holds, a short dip to 19600 is possible in the coming sessions. Unless we see a break above 20015, we may not expect a further rise just now.
Nifty (9314.05, +0.31%) could trade within 9400-9300 for a few more sessions before deciding further course of direction. For now we may expect a rise to 9400 over today and tomorrow.
COMMODITIES
Muted price action has been seen in Gold (1229) as it is trading within the narrow trading band of 1220-31. If these levels hold on a closing basis then sideways consolidation within 1220-1260 continues. Need to keep a close watch on the price action in Dollar Index (99.01) which could give some cue on further Gold direction. We will remain bearish while it is trading below 1256-60 levels and a close below 1220 could open up 1186 levels as well.
Silver (16.19) is highly oversold in short term chart and a bounce towards 17 levels is highly anticipated. But we will remain bearish on silver while it is trading below 17.50 levels.
Copper (2.48) has found resistance at 2.54 levels. Only above 2.68, higher resistances of 2.80 can come into consideration. In the medium term 2.44 are going to be a strong support now but a close below that could open up 2.40-35 ;eves as well.
The energy segment is showing no sign of near term recovery from its recent fall. The interim resistance of 49.20 in WTI and 51.30 in Brent might be tested within couple of sessions. As discussed during last week, the preference may remain bullish in the extreme short term due to oversold condition but the overall bias will remain bearish while Brent (49.84) and WTI (46.87) are trading below 53 and 51 levels respectively.
Brent-WTI 3 Days spread is at 2.89, which may find resistance at 3.00 levels and could come down towards 2.00. Gold-WTI spread (26.39) also may find resistance at 27.00 levels and we could see 24.5 levels within few days of time.
FOREX
No fresh triggers in the market and the majors may settle in moderate ranges in the near term. Dollar Yen has broken out of a 5-month long channel after worse than expected earnings in Japan. Labor cash earnings for Mar’17 came at -0.4% against an expectation of a rise of 0.5% and the Feb’17 figure of +0.4%.
Long liquidation in Euro (1.0930) has driven it lower but the bears still need a break below 1.0900-1.0880. Otherwise, another bounce towards 1.1000 from the support can’t be ruled out. The chances of sideways consolidation in 1.09-1.10 for a few sessions are a distinct possibility with a breakout from this range required for a directional move.
Dollar Yen (113.20) has broken above the resistance of 113.00 and tested the next minor resistance of 113.39 above which the rise can extend to 114.60-115.00. Bias bullish.
The weakness of Euro and Yen have pushed Dollar Index (99.11) higher but unless a break above the resistance of 99.50 is seen, the bullishness can’t be relied upon. In case, Euro begins to oscillate in the range of 1.09-1.10, Dollar Index may follow suit by trading sideways in the range of 98.50-99.50 for the next few sessions.
Pound (1.2942) continues its pause mode with the immediate resistance coming at our target of 1.3000 and immediate support at 1.2900 followed by 1.2840. Bias remains bullish with a fair possibility of horizontal trading in 1.2840-1.3000 in the near term.
Aussie (0.7361) is gradually negating the chances of any good recovery as it extends the decline due to the weakness in commodities. 0.7300 is in consideration now as the next downside target but it remains to be seen if it manages to trigger a bounce or not.
Dollar Rupee (64.31) is trading at 64.34 in the NDF at the moment and we still wait for a breakout above 64.40 before the higher levels of 64.70-75 can be considered. Till then, the chances of a retest of 64.20 and 64.00 remains open.
INTEREST RATES
The US yields have moved up as expected and looks bullish for the near term. The 5Yr (1.91%), 10Yr (2.38%) and the 30Yr (3.02%) are up from 1.88%, 2.35% and 2.99% respectively and looks bullish in the rest of the sessions this week.
The UK yields have risen well in the past few sessions and may head higher in the near term. The Japanese yields have also risen and could head higher in the coming sessions. There is some room on the upside for at least the next 4-5 sessions.
The German-US 10Yr (-1.96%) and the 2yr (-2.00%) are almost stable while the Euro seems to be much volatile now. It has come off from resistance near 1.10 and while that holds, the yield spreads could remain stable. The 10Yr yield spread may come off towards -2% but the 2Yr yield spread may still have some room on the upside.
The Japan-US 10Yr (2.34%) is moving up taking the Dollar-Yen to higher levels as expected. We could see some more rise in the near term.
The 10Yr GOI (6.9282%) has come off in the last 2-3 sesisons from resistance near 7% and while that holds, we could see the fall extend to levels near 6.90% or lower in the near term.
SPI200 Retesting Breakout Level Again
We spoke about this SPI200 breakout and retest just over a month ago.
Now low and behold after bouncing, we're back at the level again:
SPI200 Daily:
The Australian SPI200 index had formed a resistance level that we watched go from a double top to a triple top, before finally breaking out.
With the last retest breaking the level before bouncing, I'll be treating this retest level as a zone rather than a hard line.
Just remember the Australian budget is released tonight which could have effects on tomorrow's open.
Where do you see the SPI200 index heading?