Sample Category Title
GBP/JPY Daily Outlook
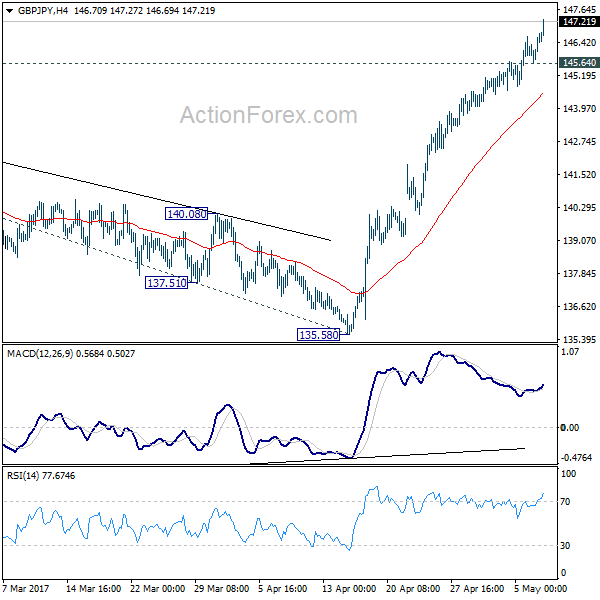
Daily Pivots: (S1) 145.90; (P) 146.28; (R1) 146.92; More....
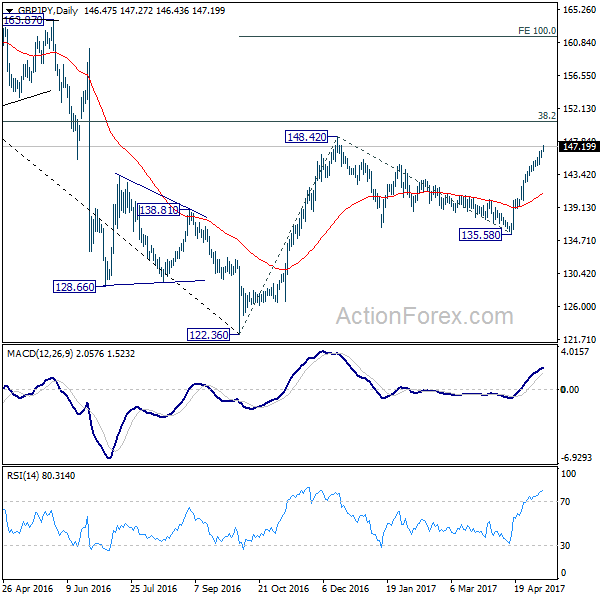
GBP/JPY's rally continues today and reaches as high as 147.27 so far. Intraday bias remains on the upside. Rise from 122.36 should be resuming. Further rally should be seen through 148.20 to 150.42 fibonacci level.. Further break there will target 100% projection of 122.36 to 148.42 from 135.58 at 161.64. On the downside, below 145.64 minor support will turn bias neutral and bring consolidation before staging another rise.
In the bigger picture, based on current momentum, rise from 122.36 bottom should be developing into a medium term move. Break of 38.2% retracement of 195.86 to 122.36 at 150.42 should pave the way to 61.8% retracement at 167.78. This will now be the favored case as long as 135.58 support holds.
GBPUSD Tading In Final Stages Of An Impulse, A Reversal May Be Near
Cable is making a strong rise away from 1.2364 level, clearly in impulsive fashion which can see an extension up to 1.300-1.3040 area for wave C. That said, recently price has been trading in a correction of a higher degree, wave 4 which is as of current rally completed. As such wave 4 was completed at the 1.2830 level and current recovery is final wave 5. That said, the ideal reversal zone for wave 5 may be around the Fibonacci ratio of 100.0, where distance traveled of waves 1 and 5 comes in play. After wave five finds a top, we can a expect a minimum three wave decline towards the region of a former wave 4).
GBPUSD, 4H
EUR/JPY Daily Outlook
Daily Pivots: (S1) 122.95; (P) 123.72; (R1) 124.45; More...
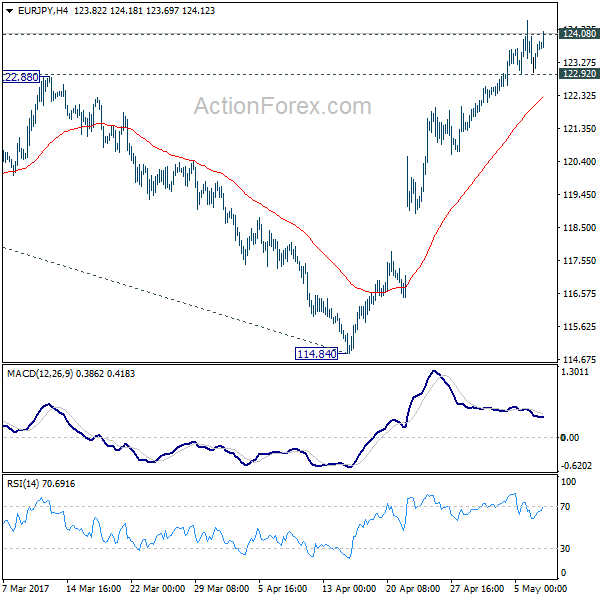
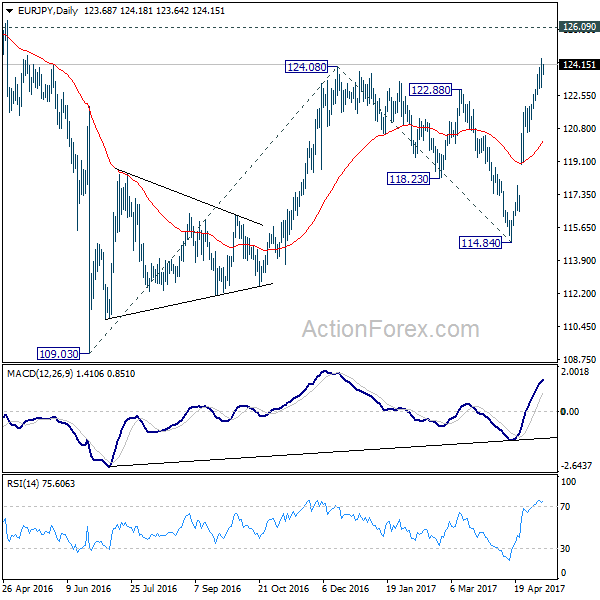
EUR/JPY is staying above 122.92 minor support and recovered. Further rise is still expected in the cross. Firm break of 124.08 resistance will confirm resumption of whole rise from 109.20. In that case, EUR/JPY would target 126.09 resistance first. Break there will pave the way to 100% projection of 109.03 to 124.08 from 114.84 at 129.89. On the downside, below 122.92 minor support will turn bias to the downside and bring pull back.
In the bigger picture, focus is back on 126.09 support turned resistance. Decisive break there will confirm completion of the down trend from 149.76. And in such case, rise from 109.20 is at the same degree and should target 141.04 resistance and above. Meanwhile, rejection from 126.09 and break of 114.84 will extend the fall from 149.76 through 109.20 low.
Technical Outlook: GBPUSD Hesitates Ahead Of Psychological 1.30 Barrier But Overall Picture Remains Firmly Bullish
Cable started trading on Tuesday at the back foot and penetrated into thick hourly cloud (spanned between 1.2957/08) following repeated rejection on approach to psychological 1.3000 barrier and Monday’s close in red.
Overall structure remains bullish and favors further upside with final break through 1.3000 pivot to attack strong resistance at 1.3088 (base of falling weekly Ichimoku cloud).
Strong supports at 1.2915/08 (rising 10SMA / daily Tenkan-sen) are expected to ideally contain and keep the structure intact, however, extended dips can be expected on violation of these supports.
Higher low of 04 May at 1.2830 marks key near-term support, loss of which would signal deeper correction and expose next pivotal supports at 1.2770/55.
Res: 1.2953, 1.2987, 1.3000, 1.3088
Sup: 1.2915, 1.2908, 1.2860, 1.2830
Markets Directionless After The Fear Gauge Hits A 24-Year Low
The CBOE Volatility Index fell yesterday to the lowest level since 1993 to trade in single digits. The implied volatility index, which is based on option contracts on the S&P 500 index for one month is aimed to look forward and perform as a leading indicator as it's driven by the pricing of calls and puts contracts.
While this could be interpreted to mean that good times lie ahead, it also indicates that the party may be over soon. Volatility does not stay at low levels for prolonged periods of time, and we're likely to see the index reverting to its 200-days moving average around 15. Just don't let the extremely quiet market conditions trap you into taking huge risks.
The markets' reaction to the French election results were muted. The Euro sold off after an initial rally above 1.10, and the same applied to European equities which closed slightly lower. Asian investors were also seen stepping back after sending equities to a two-year high, waiting for a fresh catalyst to decide their next move.
The Aussie was the only currency on the move early Tuesday. AUDUSD fell 0.5% after Australian retail sales unexpectedly fell 0.1% in March and February figures were revised lower to -0.2%. This marks the third drop in four months, and it would become a worrying sign if the downtrend trend sustains.
Saudi's Oil Minister Khalid Al-Falih's comment on Monday that oil producers would "do whatever it takes" to rebalance the market did little to support prices. He also indicated that production cuts might be extended beyond 2017, but this is likely to be faced with skepticism from investors, especially considering that the longer the period of cuts to output, the less likely compliance might hold. However, if OPEC and non-OPEC members agree on an extension of nine months or longer, this would at least put a floor on prices.
AUD/USD Daily Outlook
Daily Pivots: (S1) 0.7366; (P) 0.7395; (R1) 0.7413; More...
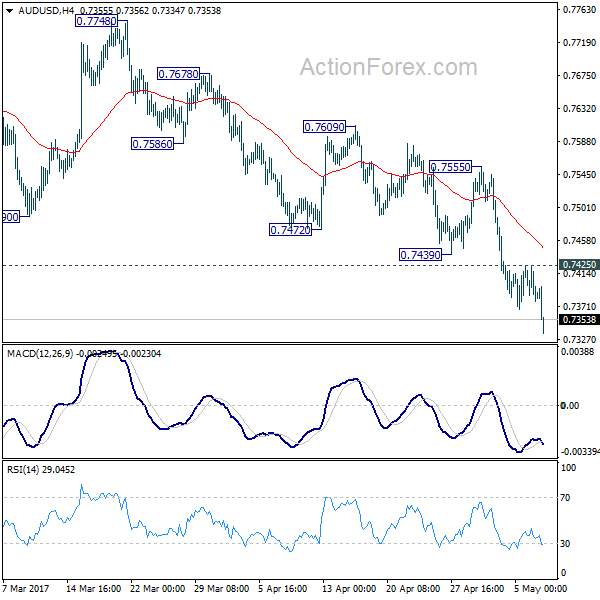
AUD/USD's fall resumed after brief consolidation and reaches as low as 0.7334 so far. Intraday bias is back on the downside. Current decline from 0.7748 should target 0.7144/7158 support zone. We'll be cautious on bottoming there as there is no clear sign of larger down trend resumption yet. On the upside, above 0.7425 minor resistance will turn bias neutral and bring consolidations first.
In the bigger picture, we're still treating price actions from 0.6826 low as a correction pattern. And, as long as 38.2% retracement of 0.9504 to 0.6826 at 0.7849 holds, long term down trend from 1.1079 is expected to resume sooner or later. Break of 0.6826 low will target 0.6008 key support level. However, firm break of 0.7849 will indicate that rise from 0.6826 is developing into a medium term rebound, rather than a sideway pattern. In such case, stronger rise should be seen to 55 month EMA (now at 0.8115) and above.
Technical Outlook: EURUSD – Bearish Outside Day Signals Reversal And Risks Further Downside
The Euro came under increased pressure after Monday's strong close in red that formed bearish outside day reversal pattern. Pullback from six-month high at 1.1020 broke below initial supports at 1.0935/19 (daily Tenkan-sen/10SMA) and looking for extension through another strong supports at 1.0904/ 1.0896 (top of thick 4-hr cloud/Fibo 61.8% of 1.0819/1.1020 upleg).
Further easing would challenge next pivotal supports at 1.0848 (Fibo 38.2% of 1.0568/1.1020 ascend) and 1.0828 (200SMA).
Fresh bearish acceleration may undermine broader longs on further extension lower and close below 1.0848/28 pivots, which may threaten of filling the gap from two weeks ago and confirm reversal.
Near-term studies turned into full bearish mode while slow stochastic reversed from overbought territory on daily chart and supports negative scenario. Broken daily Tenkan-sen now acts as initial resistance and so far caps today's action.
Res: 1.0935, 1.0950, 1.0998, 1.1020
Sup: 1.0896, 1.0873, 1.0866, 1.0848
USD/CAD Daily Outlook
Daily Pivots: (S1) 1.3645; (P) 1.3689; (R1) 1.3736; More....
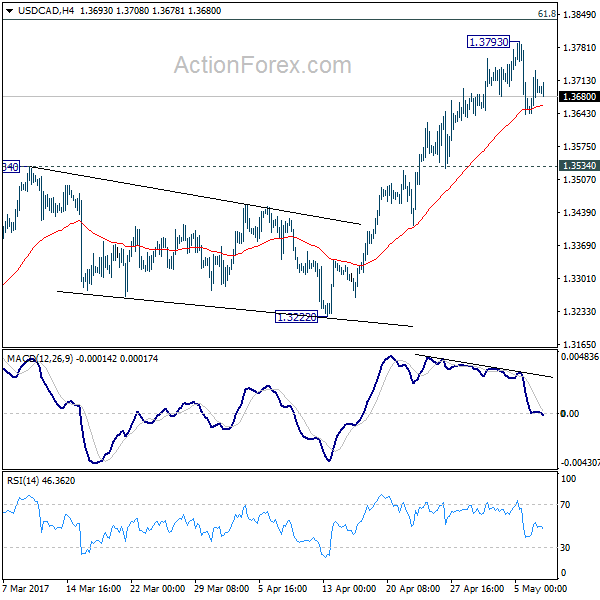
USD/CAD's consolidation from 1.3793 temporary top is still in progress. Intraday bias remains neutral for the moment. Rise from 1.2460 is seen as a corrective pattern. Hence, in case of another rally, we'll be cautious on topping at around 1.3838 fibonacci level. Meanwhile, consider bearish divergence condition in 4 hour MACD, break of 1.3534 support will argue that rise from 1.2968 is already completed. In such case, intraday bias will be turned back to the downside for 1.3222 support.
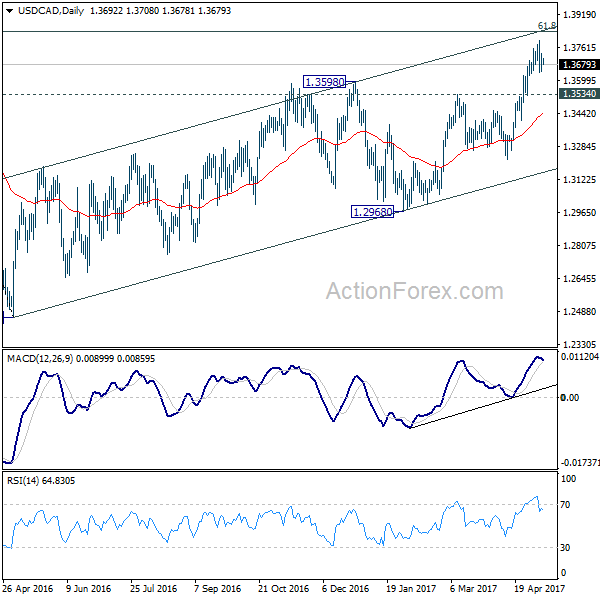
In the bigger picture, price actions from 1.4689 medium term top are seen as a correction pattern. The first leg has completed at 1.2460. Rise from 1.2460 is seen as the second leg and would end at around 61.8% retracement of 1.4689 to 1.2460 at 1.3838. Break of 1.3222 should indicate the start of the third leg while further break of 1.2968 should confirm. Nonetheless, sustained trading above 1.3838 would pave the way to retest 1.4689 high.
EUR/DKK Spiked Yesterday
Market movers today
It is set to be a very quiet day in terms of data releases. Worth keeping an eye on is German industrial production in March, which we expect declined modestly after two strong monthly increases. Note that German factory orders released yesterday surprised on the upside compared with our expectations and point to a strong end to Q1 for German business activity.
In the US, we get the NFIB small business optimism indicator for April. Business optimism soared after the election of Donald Trump as president . However, given the increased uncertainty about how much of his policies he will actually be able to carry out in practice, business optimism seems to have peaked and we expect it to fall further given the fall observed in, for example, ISM and PMI. This should not be a significant turn for the worse in the overall economy, but a correction in soft indicators to be more in line with the actual economic development .
Again today there are a few speeches by FOMC members including Rosengren (non -voter, hawkish) and Kaplan (voter, dovish). The focus remains on getting more insight about how the members' views differ after the less informative FOMC statement released last week.
Selected market news
Market reaction was quite muted yesterday after Macron's win but volatility (VIX index) fell to its lowest level since 1993, as European political uncertainty has diminished significantly. EUR/DKK spiked yesterday and we look for the cross spot to stay close to 7.4400 on 12M on strong DKK fundamentals not fully mitigated by the spread between DK and eurozone policy rates. With political risks fading, focus will now likely shift back to the business cycle, see also Strategy: With fading EU political risks, global business cycle back in focus, 5 May. China in part icular may soon come back into the spot light , as financial stress is on the rise again.
Yesterday, a couple of Fed speeches suggested that while the Fed's Mester (non-voter, hawk) supports a June hike, Bullard (non-voter, dovish) thinks the current policy rate is appropriate. Mester argues that the US labour market is strong and the Fed risks falling behind the curve if it does not tighten monetary policy. Markets have priced in around an 80% probability of a Fed hike at the meet ing next week, which is also the consensus among most analysts. We are more sceptical, as we think the Fed will take the opportunity to announce what will trigger a change in its reinvestment strategy ("quantitative tightening"), see also FOMC review: Fed thinks weak GDP growth in Q1 was 'transitory', 3 May. A total of three Fed hikes is priced in from now until year-end 2018.
Daily Technical Analysis: EURUSD, GBPUSD, USDJPY, USDCHF
EURUSD
The EURUSD had a bearish momentum yesterday bottomed at 1.0916. The bias is bearish in nearest term. Price is now struggling around the H1 EMA 200 (1.0915) as you can see on my H1 chart below. A clear break below the EMA 200 would expose 1.0850 key support. A clear break and daily close below 1.0850 could trigger further bearish pullback testing the pre-gap level at 1.0730. Immediate resistance is seen around 1.0950. A clear break back above that area could lead price to neutral zone in nearest term but would keep the recent bullish phase targeting 1.1000/50 area.
GBPUSD
The GBPUSD was corrected lower yesterday bottomed at 1.2929. We have a double top formation as you can see on my H1 chart below suggests a potential bearish scenario, but overall I remain bullish. The bias is bearish in nearest term testing 1.2900 – 1.2865 support area which is a good place to buy with a tight stop loss. Immediate resistance is seen around 1.2965. A clear break above that area could lead price to neutral zone in nearest term testing 1.3000 – 1.3050 region.
USDJPY
The USDJPY attempted to push lower yesterday bottomed at 112.39 but whipsawed to the upside and closed higher at 113.23, just above the trend line resistance as you can see on my H4 chart below. This fact suggests a bullish continuation scenario. The bias is bullish in nearest term testing 114.00 area. Immediate support is seen around 112.90. A clear break below that area could lead price to neutral zone in nearest term as direction would become unclear.
USDCHF
The USDCHF was corrected higher yesterday topped at 0.9990. The bias is bullish in nearest term testing 1.0020 key resistance and the trend line resistance as you can see o my H4 chart below, which is a good place to sell with a tight stop loss. Immediate support is seen around 0.9950. A clear break below that area could lead price to neutral zone in nearest term testing 0.9900 or lower. Overall I remain neutral.