Sample Category Title
EUR/USD Daily Outlook
Daily Pivots: (S1) 1.0574; (P) 1.0590 (R1) 1.0611; More....
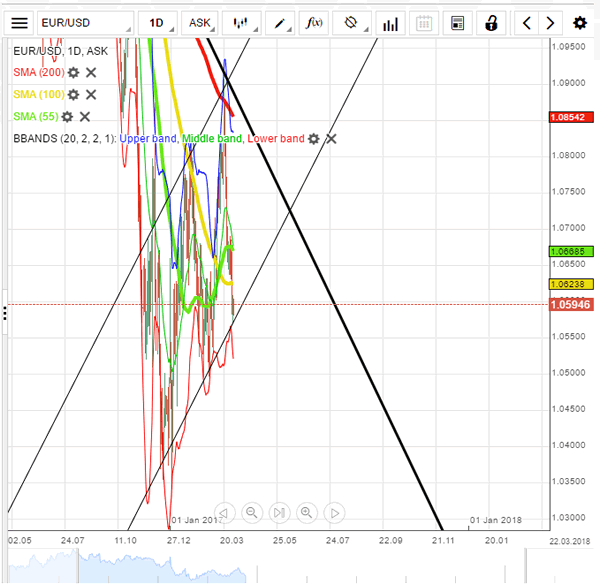
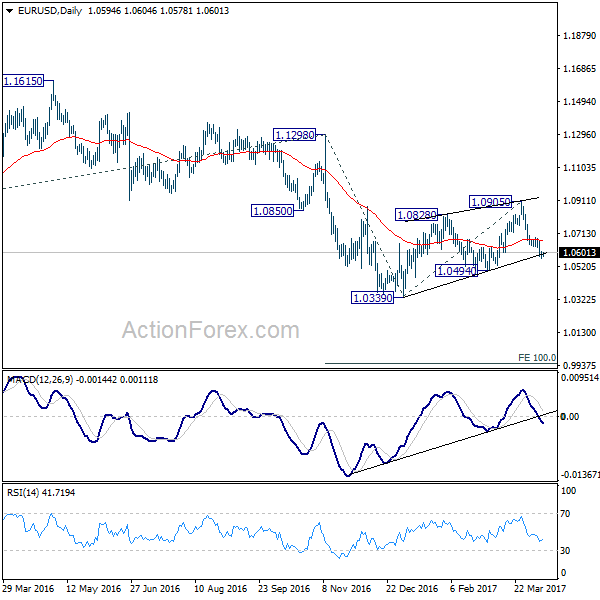
With 1.0688 resistance intact, deeper fall is still expected in EUR/USD to 1.0494 support. As noted before, corrective rise from 1.0339 is likely finished after being rejected by 55 week EMA. And, the larger down trend is ready to resume. Decisive break of 1.0494 support will confirm this bearish case and target 1.0339 low. Break of 1.0339 will confirm down trend resumption and target 100% projection of 1.1298 to 1.0339 from 1.0905 at 0.9946. On the upside, however, break of 1.0688 resistance will delay the bearish case and turn focus back to 1.0905 resistance instead.
In the bigger picture, as long as 1.1298 key resistance holds, whole down trend from 1.6039 (2008 high) is still expected to continue. Break of 1.0339 low will send EUR/USD through parity to 61.8% projection of 1.3993 to 1.0461 from 1.1298 at 0.9115. However, considering bullish convergence condition in weekly MACD, break of 1.1298 will indicate term reversal. this would also be supported by sustained trading above 55 week EMA.
How Will Labour Market And UK Inflation Data Affect GBP ?
This morning at 09:30 BST will see the release of a series of UK inflation data for March including; CPI, core CPI, PPI and core PPI. It will likely cause volatility for GBP and GBP crosses. GBP/USD is currently trading above the psychological level at 1.2400.
The German ZEW economic sentiment and current situation (Apr), and Eurozone industrial production (Feb), at 10:00 BST, will likely affect the strength of the Euro and the trend of the DAX index.
UK CPI has seen an uptrend since the end of 2015, helped by a weakening Sterling rising food and fuel prices. CPI and the core CPI for February both reached above the Bank of England’s 2% target for the first time since January and July 2014 respectively.
UK inflation uptrend is likely to continue; however, the economic prospect seems to be uncertain due to Brexit uncertainty. The Bank of England is likely to keep rates on hold for the near future.
Wednesday April 12, at 09:30 BST, will see the release of UK labour market data (Mar), including average earnings (from Dec to Feb). If the pace of wage growth is slower than the pace of inflations rise then it will likely result in the weakening of household spending and purchasing power, which will lead to the slowdown of economic growth.
To adapt to rising inflation the UK government is increasing the minimum wage from £7.20 to £7.50 this month and has frozen tax on petrol and diesel for the seventh year.
Monday morning, during the early European session, the dollar index hit its highest level of 101.24 since March 15. However, it retraced and is now trading below the resistance level at 101.00. Fed Chair Yellen made a speech yesterday at the University of Michigan. She stated that “the US economy is healthy and growing at a moderate pace with the Fed close to achieving its goals on employment and inflation, neutral monetary policy and that a gradual rate hike would be appropriate”.
FOMC voting member, Neel Kashkari, will make a speech at 18:45 BST this evening.
There are only two weeks ahead until the first round voting of the French presidential election. Polls conducted by BVA-SALES FORCE showed a tightening race: Macron, Le Pen and Fillion are 23%, 23%, and 19% respectively. Macron and Le Pen got a lower share of the vote compared to 25% from a previous poll. Surprisingly, the far-left candidate Jean-Luc Melenchon, has slipped to third position, with 19% of voters, which is equal to Fillion, which poses more uncertainty to the election.
Yellen: The Economy Is ‘Pretty Healthy’
Fed Chair Yellen maintained the status quo in her remarks yesterday, offering little fresh guidance to investors regarding the Fed's next move. The Fed chief indicated that the economy is “pretty healthy” and that she expects it to grow at a moderate pace moving forward. Even though she did not discuss the timing of the next hike, or the hot topic of a reduction in the Fed's balance sheet, she did reiterate that she supports more near-term hikes in general. Given the lack of new information, the reaction in the dollar on these comments was relatively muted. We think that USD traders may now turn their attention to CPI and retail sales data for March, due out on Friday, for updated signals on when the Committee may act next.
USD/JPY traded lower yesterday ahead of Yellen, breaking below the support (now turned into resistance) barrier of 111.00 (R1). The decline continued after the Fed chief's comments, perhaps aided by some yen safe-haven demand amid reports of rising political tension in the Korean peninsula. During the early European morning Tuesday, the rate looks to be headed for a test near the support obstacle of 110.35 (S1). If the bears prove strong enough to overcome that level, then we may see another test near the 110.00 (S2) zone, marked by the low of the 7th of April.
Today's highlights:
During the European day, we get the UK CPI data for March. The forecast is for the headline CPI rate to have held steady, while the core rate is expected to have ticked down. We see the risks surrounding the core CPI forecast as skewed to the upside, perhaps for an unchanged rate, given that the nation's services PMI for the month showed that prices charged by service provides increased at the fastest rate for eight-and-a-half years. In case of a positive surprise in the core figure, GBP could recover some of its recent losses.
GBP/USD rebounded yesterday after finding support near the 1.2370 (S1) level. At the time of writing, the rate looks ready to challenge the 1.2430 (R1) territory as a resistance. Investors could stay near that level waiting for today's inflation data. If the core CPI rate stays unchanged, it may encourage the bulls to push the battle higher. A clear break above 1.2430 (R1) could pave the way for our next resistance zone at 1.2490 (R2).
We also get Sweden's CPI data for March. Expectations are for both the headline and the core rates to have declined. Such declines could amplify speculation regarding further easing by the Riksbank, which at its latest policy gathering shifted to a much more dovish tone. The Bank made it clear that there is still a greater probability for the repo rate to be cut rather than raised in the near term, and we think that a notable slowdown in inflation is likely to raise that probability further. Thus, this could bring SEK under renewed selling interest.
From Germany, we get the ZEW survey for April. The forecast is for both the expectations and the current conditions indices to have risen, which could be a first sign that Eurozone's largest economy entered the second quarter on a solid footing. Although this survey is usually not a major market mover for the euro, improving sentiment among financial experts could cause a modest positive reaction in the DAX. We also get the bloc's industrial production data for February.
In the US, the NFIB small business optimism index for March, and the JOLTS job openings survey for February are due out.
We have only one speaker on the agenda: Minneapolis Fed President Neel Kashkari.
USD/JPY
Support: 110.35 (S1), 110.00 (S2), 109.70 (S3)
Resistance: 111.00 (R1), 111.60 (R2), 112.20 (R3)
GBP/USD
Support: 1.2370 (S1), 1.2340 (S2), 1.2300 (S3)
Resistance: 1.2430 (R1), 1.2490 (R2), 1.2550 (R3)
GBP/USD Daily Outlook
Daily Pivots: (S1) 1.2377; (P) 1.2402; (R1) 1.2441; More...
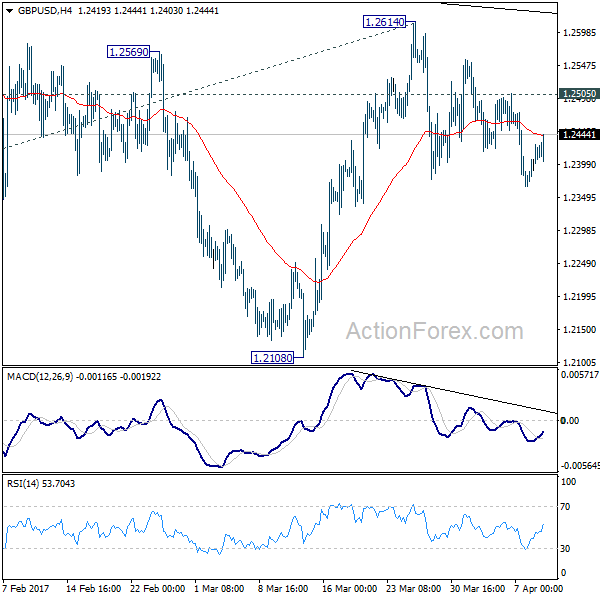
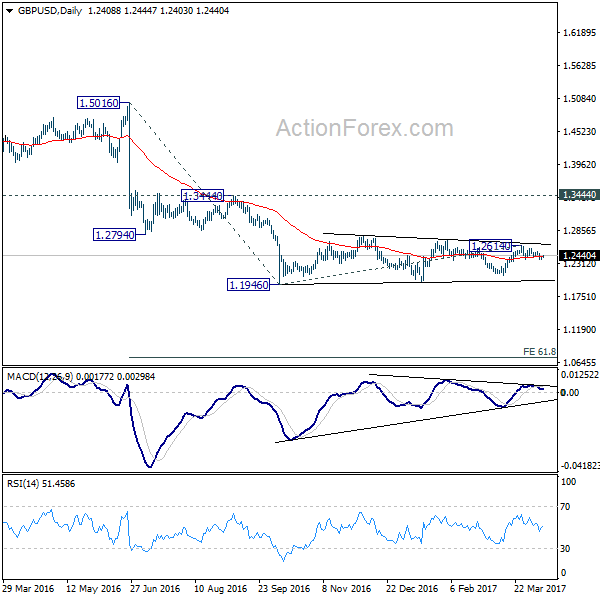
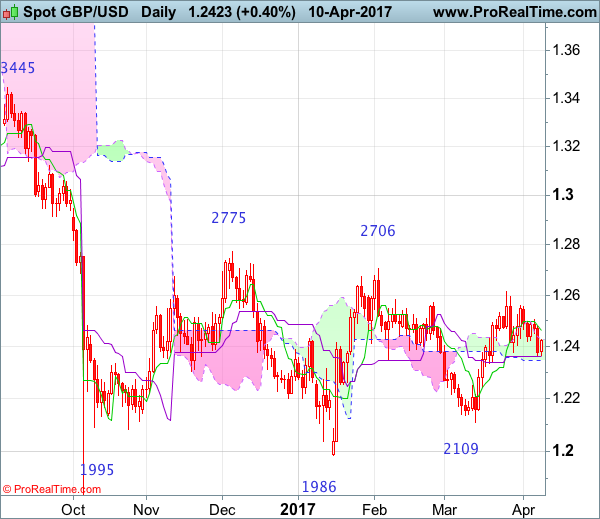
With 1.2505 minor resistance intact, further fall is still expected in GBP/USD. Triangle pattern from 1.1946 could be finished with five waves to 1.2614 too. Deeper decline would be seen back to 1.2108 first. Decisive break there will argue that medium term down trend is resuming. In that case, GBP/USD should take out 1.1946/1986 support zone to 61.8% projection of 1.5016 to 1.1946 from 1.2614 at 1.0717. On the upside, however, break of 1.2505 resistance will invalidate this immediately bearish case. Then, it will turn bias back to the upside for 1.2614 resistance instead.
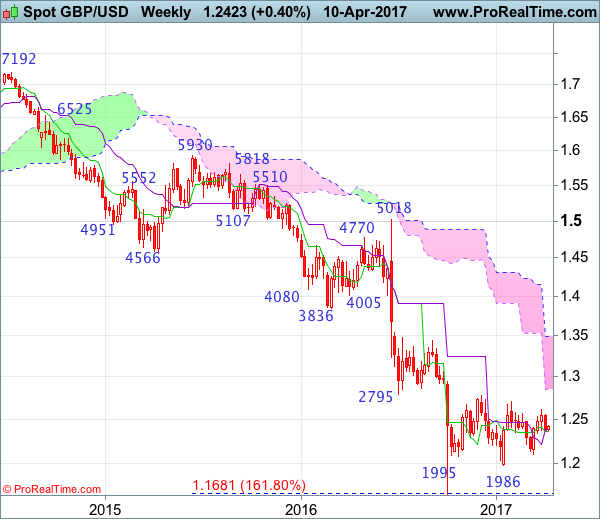
In the bigger picture, fall from 1.7190 is seen as part of the down trend from 2.1161. There is no sign of medium term reversal yet. Sustained trading below 61.8% projection of 2.1161 to 1.3503 from 1.7190 at 1.2457 will target 100% projection at 0.9532. Overall, break of 1.3444 resistance is needed to confirm medium term bottoming. Otherwise, outlook will remain bearish.
USD/CHF Daily Outlook
Daily Pivots: (S1) 1.0071; (P) 1.0089; (R1) 1.0104; More.....
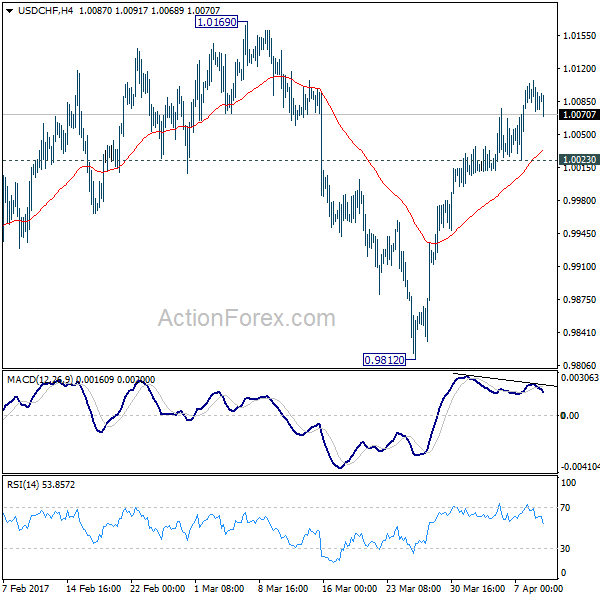
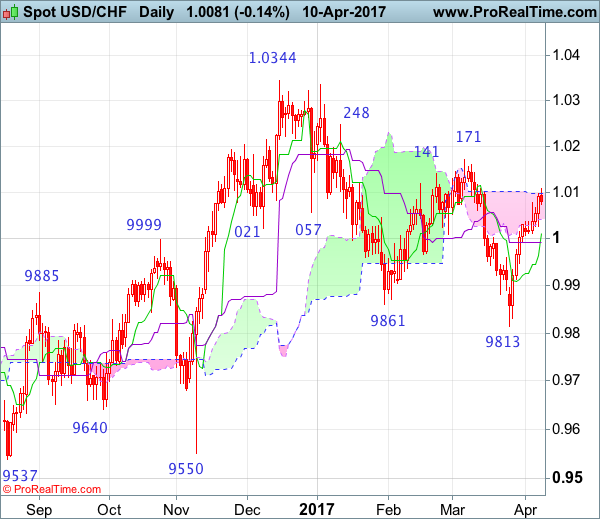
With 1.0023 minor support intact, further rise is expected in USD/CHF. As noted before, corrective fall from 1.0342 should have finished with three waves down to 0.9812. Further rise should now be seen to 1.0169 resistance first . Decisive break there will confirm this bullish case and target 1.0342 key resistance next. On the downside, below 1.0023 minor support will bring consolidations before staging another rally.
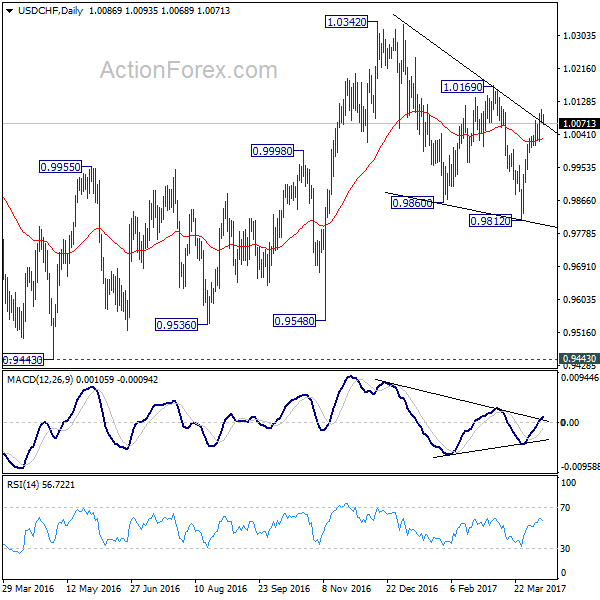
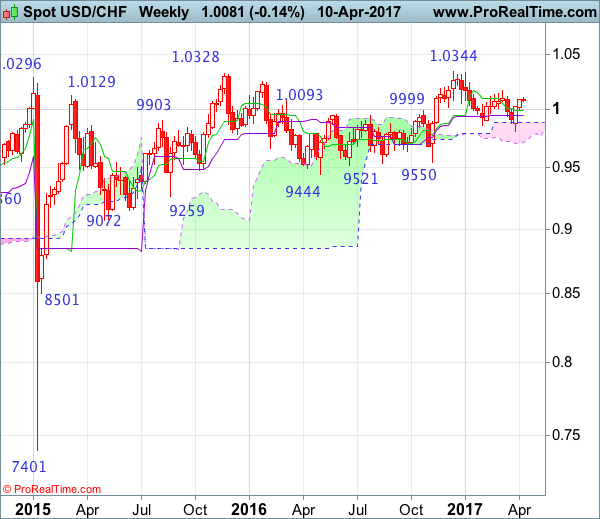
In the bigger picture, we're still maintain that firm break of 1.0342 key resistance is needed to confirm underlying bullish momentum in the cross. However, the corrective nature of the fall from 1.0342 to 0.9812 is starting to give the medium term outlook a bullish favor. Hence, in stead of looking for topping signal around 1.0342, we'd now pay closer attention to upside acceleration as USD/CHF approaches this level again.
USD/JPY Daily Outlook
Daily Pivots: (S1) 110.62; (P) 111.10; (R1) 111.40; More....
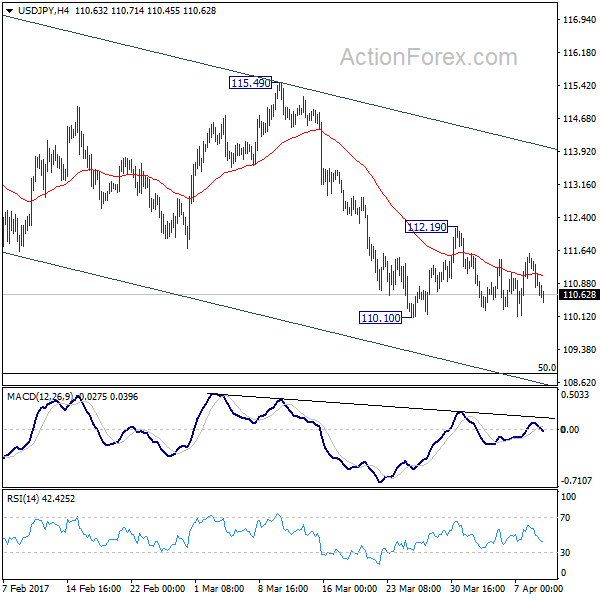
Intraday bias in USD/JPY stays neutral as it's bounded in range of 110.10/112.19. The pair is staying in the near term falling channel and the correction from 118.65 could extend lower. Below 110.10 will turn intraday bias to the downside for 50% retracement of 98.97 to 118.65 at 108.81. On the upside, however, break of 112.19 resistance will indicate short term reversal and turn bias back to the upside for 115.49 resistance.
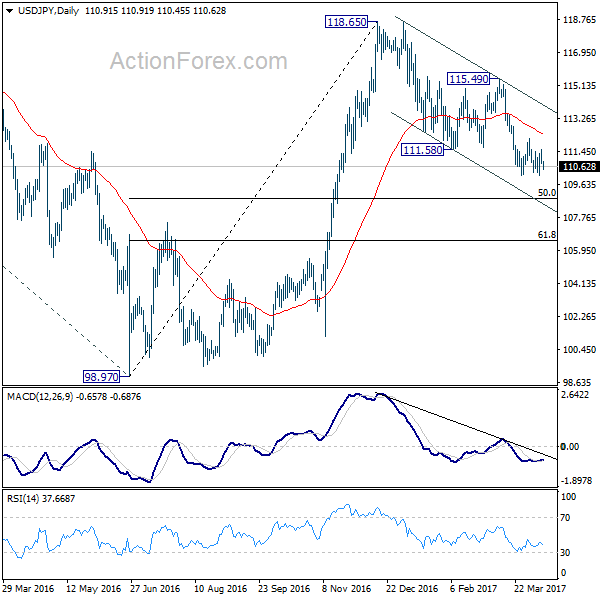
In the bigger picture, price actions from 125.85 high are seen as a corrective pattern. The impulsive structure of the rise from 98.97 suggests that the correction is completed and larger up trend is resuming. Decisive break of 125.85 will confirm and target 61.8% projection of 75.56 to 125.85 from 98.97 at 130.04 and then 135.20 long term resistance. Nonetheless, sustained trading below 55 week EMA (now at 111.15) will extend the consolidation from 125.85 with another fall through 98.97 before completion.
GBP/USD Candlesticks and Ichimoku Analysis
Weekly
• Last Candlesticks pattern: Shooting star
• Time of formation: 5 Sep 2016
• Trend bias: Down
Daily
• Last Candlesticks pattern: Long black candlestick
• Time of formation: 24 Jun 2016
• Trend bias: Down
GBP/USD – 1.2409
The British pound met renewed selling interest just above 1.2500 level and has slipped again, suggesting near term downside risk remains for the erratic fall from 1.2616 to bring at least a retracement of recent upmove to previous support at 1.2335, once this level is penetrated, this would signal the rise from 1.2109 has ended, then weakness to 1.2240-50 would follow but downside should be limited to 1.2190-00 and bring rebound later this month.
On the upside, whilst initial recovery to 1.2450-60 cannot e ruled out, reckon 1.2480 would limit upside and resistance at 1.2506 should hold from here, bring another decline. A daily close above said resistance at 1.2506 would bring risk rebound to 1.2555-60 but only a break above there would signal the retreat from 1.2616 has ended and revive bullishness for retest of this level first, break there would extend the rise from 1.2109 to 1.2650, however, as broad outlook remains consolidative, reckon upside would be limited and price should falter well below indicated previous resistance at 1.2706, bring retreat later. In the event cable is able to penetrate resistance at 1.2706, this would retain bullishness and extend the erratic rise from 1.1986 low towards another previous resistance at 1.2775 first.
Recommendation: Stand aside for this week.
On the weekly chart, although last week’s decline from 1.2506 formed a black candlestick and further consolidation below resistance at 1.2616 would be seen with initial downside bias for weakness to 1.2335 support, break there is needed to add credence to our view that rebound from 1.2109 has ended, bring further fall to 1.2240-50, then 1.2200. Looking ahead, a drop below 1.2109 support is needed to retain bearishness and suggest medium term downtrend has resumed for weakness towards recent low at 1.1986.
On the upside, expect recovery to be limited to 1.2480-85 and resistance at 1.2506 should hold, bring another decline. Above said resistance 1.2506 would bring test of 1.2559, however, break there is needed to signal the retreat from 1.2616 has ended, bring retest of this level first. Once this resistance is penetrated, this would revive previous near term bullish view that another leg of corrective rise from 1.1986 low is underway and extend gain to 1.2706 resistance but only break there would provide confirmation, bring retracement of early downtrend for test of previous resistance at 1.2775 and later 1.2850-60 but price should falter well below psychological resistance at 1.3000.
USD/CHF Candlesticks and Ichimoku Analysis
Weekly
• Last Candlesticks pattern: Doji
• Time of formation: 26 Sep 2016
• Trend bias: Sideways
Daily
• Last Candlesticks pattern: Shooting star
• Time of formation: 25 Oct 2016
• Trend bias: Near term up
USD/CHF – 1.0080
As the greenback has maintained a firm undertone after recent rally, adding credence to our view that low has been formed at 0.9813 last month and bullishness remains for the rise from there to extend gain towards resistance at 1.0171, however, a sustained breach above there is needed to add credence to our view that the erratic decline from 1.0344 top has ended at 0.9813, bring further rise to 1.0200-10, then 1.0250 but price should falter well below said resistance at 1.0344 (2016 high).
On the downside, whilst initial pullback to 1.0040-45 and possibly the Tenkan-Sen (now at 1.0011) cannot be ruled out, reckon the Kijun-Sen (now at 0.9992) would contain downside and bring another rise later. Below 0.9890-00 would abort and signal the rebound from 0.9813 has ended, bring another fall to this level. Looking ahead, only a drop below said support at 0.9813 would revive bearishness and signal the decline from 1.0344 top has resumed instead and extend further fall to 0.9735-40 (76.4% retracement of 0.9550-1.0344) and later towards 0.9700 but reckon 0.9650-60 would hold.
Recommendation: Buy at 0.9990 for 1.0190 with stop below 0.9890.
On the weekly chart, as the greenback continued moving higher after staging a strong rebound from 0.9813, another white candlestick was formed, adding credence to our view that low has been formed at 0.9813 last month and consolidation with mild upside bias remains for further gain to resistance at 1.0171, however, a weekly close above this level is needed to confirm the fall from 1.0344 top has ended at 0.9813, bring further subsequent rise towards key resistance at 1.0248. A sustained breach above this level would signal early upmove has possibly resumed, bring test of 1.0335-44 resistance area, above there would provide confirmation and headway to 1.0400-10 and later 1.0500 would follow.
On the downside, expect pullback to be limited to the Tenkan-Sen (now at 0.9992) and bring another rise later. A drop below the Kijun-Sen (now at 0.9947) would bring weakness to 0.9890-00 but only below said support at 0.9813 would abort and signal the erratic fall from 1.0344 top is still in progress, bring further decline for retracement of early upmove to 0.9735-40, then towards the lower Kumo (now at 0.9712) but reckon downside would be limited to 0.9640-50 and price should stay well above support at 0.9550.
Forex Technical Analysis: EUR/USD, USD/JPY, GBP/USD
EUR/USD
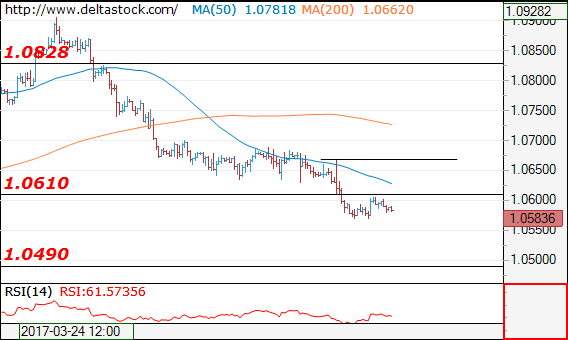
Current level - 10583
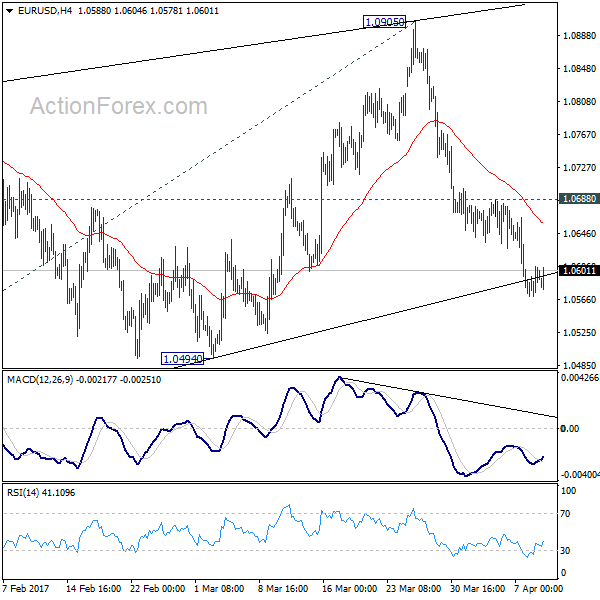
The overall bias remains bearish below 1.0610 minor resistance, for a slide towards 1.0490 lows. Crucial on the upside is 1.0668 high.
| Resistance | Support | ||
| intraday | intraweek | intraday | intraweek |
| 1.0667 | 1.0828 | 1.0568 | 1.0490 |
| 1.0700 | 1.0904 | 1.0490 | 1.0340 |
USD/JPY
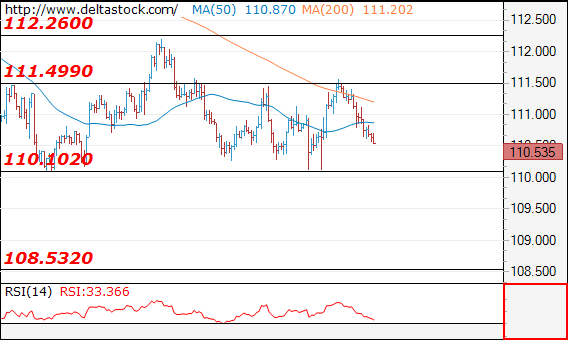
Current level - 110.53
The intraday bias is negative after the reversal at 111.50, but my outlook is counter-trend above 110.10, for another upswing towards 112.00 area. A clear break through 110.10 will signal a renewal of the general downtrend towards 108.50.
| Resistance | Support | ||
| intraday | intraweek | intraday | intraweek |
| 111.50 | 113.50 | 110.10 | 110.10 |
| 112.26 | 115.65 | 110.10 | 107.80 |
GBP/USD
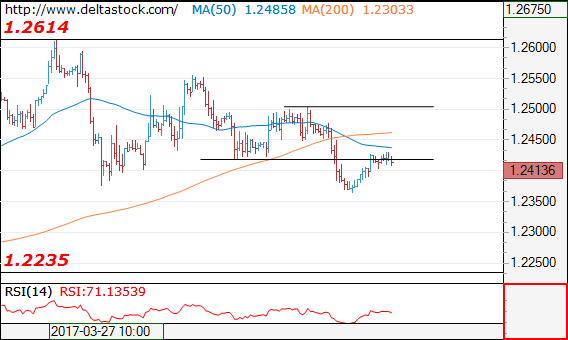
Current level - 1.2413
The intraday bias is slightly positive above 1.2400 and initial resistance lies at 1.2450. Crucial on the upside is 1.2500 area.
| Resistance | Support | ||
| intraday | intraweek | intraday | intraweek |
| 1.2420 | 1.2620 | 1.2330 | 1.2230 |
| 1.2500 | 1.2705 | 1.2235 | 1.2107 |
EUR/USD: Pauses Its Decline
'Uninspiring comments from Fed Chair Janet Yellen.' – Kathy Lien, BK Asset Management (based on investing.com)
Pair's Outlook
On Tuesday morning the common European currency continued to trade just below the 1.06 mark against the US Dollar. The rate remained almost unchanged during Monday's trading session, as the Greenback did not gain strength during the speech with mixed signals given by Janet Yellen. However, the previous technical forecast of a decline of the currency pair remains in force, as on Tuesday the lower Bollinger band has closed in on the rest of the support levels, which surround the 1.0550 level. Due to that reason the way is free for a decline.
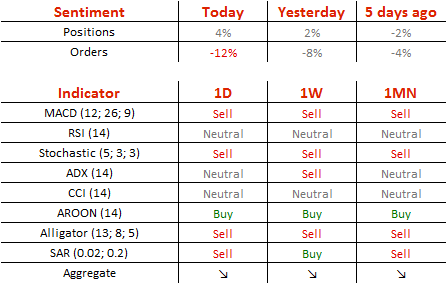
Traders' Sentiment
SWFX traders still remain almost neutral, as 52% of open positions are long on Tuesday, compared to 51% previously. Meanwhile, 56% of trader set up orders are to sell the Euro.