Sample Category Title
Technical Outlook: Yen Is Supported By Strong Safe-Haven Demand But 110.00 Support Is Holding For Now
The pair maintains overall bearish bias despite long-legged candles in past couple of days that signaled hesitation at key 110.00 support zone. Repeated rejection at daily Tenkan-sen 111.14 yesterday and today's spike to former low at 110.09 were bearish signals. Renewed demand for safe-haven assets keep yen supported along with firmly bearish technicals. Final break below 110.00 zone (110.09 base / 109.91 – 50% retracement of 101.17/118.65 rally) would trigger fresh acceleration lower and expose 109.30 /108.81 projections and 108.00 in extension. Weekly close below 111.36 (weekly cloud top) is needed to confirm bearish stance. Alternative scenario will be activated on sustained break above 111.36. US NFP data are in focus.
Res: 110.99, 111.14, 111.36, 111.43
Sup: 110.09, 109.91, 109.30, 108.81
USD/CHF Elliott Wave Analysis
USD/CHF – 1.0061
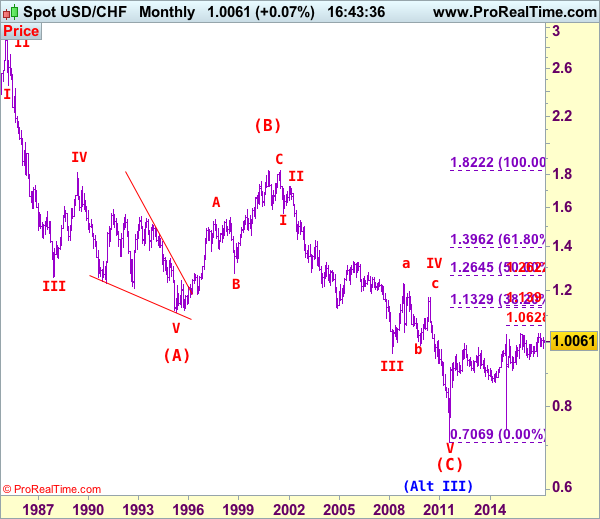
USD/CHF – Wave IV ended at 1.1730 and wave V has possibly ended at 0.7068
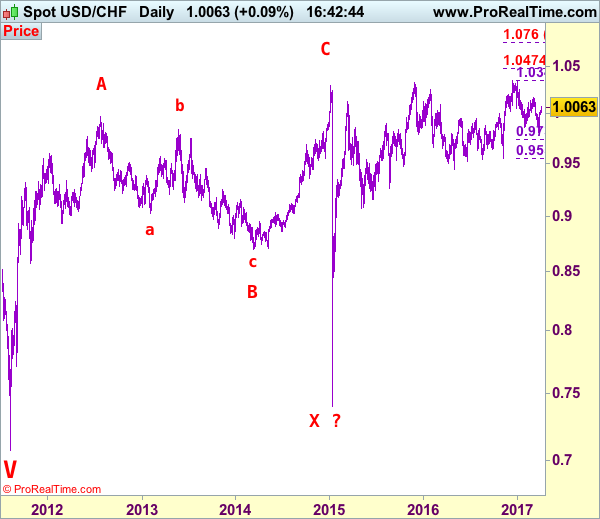
As the greenback found good support at 0.9815 late last month and has staged a strong rebound from there, adding credence to our view that low has been formed there and consolidation with mild upside bias is seen for further gain to 1.0105-10. Having said that, price should falter below resistance at 1.0171, bring retreat later. In the event dollar breaks above said resistance at 1.0171, this would revive our bullish view for the erratic rise from 0.9861 to extend further gain to 1.0200 and possibly test of resistance at 1.0248, however, a daily close above there is needed to signal the retreat from 1.0344 has ended at 0.9861, bring eventual retest of 1.0344.
Our preferred count on the daily chart is that early selloff to 0.9630 is an end of the larger degree wave III and major correction is unfolding from there with a leg ended at 1.2298 (Nov 2008 with (a): 1.0625, (b):1.0011 and (c):1.2298), wave b ended at 0.9910 with (a): 1.0370, (b): 1.1967, (c): 0.9910. The rise from there to 1.1730 is the wave c which also marked the end of wave IV and wave V has possibly ended at 0.7068.
On the downside, whilst pullback to 0.9995-00 cannot be ruled out, reckon downside would be limited to 0.9945-50 and bring another rise later. Below 0.9900 would suggest the rebound from 09815 has ended instead bring another fall towards said support at 0.9815. Looking ahead, only a break below this level would confirm another leg of major fall from 1.0344 top is underway for further fall to 0.9735-40, however, oversold condition should prevent sharp fall below 0.9675-80 and price should stay well above 0.9600, bring rebound later.
Recommendation: Stand aside for this week
Dollar's long-term downtrend started from 2.9343 (Feb 1995) and it was unfolding as a (A)-(B)-(C) with (A): 1.1100, (B): 1.8310 (26 Oct 2000), then followed by another impulsive wave (C) with wave III ended at 0.9630 (Mar 2008). Under this count, correction in wave IV has possibly ended at 1.1730 and wave V already broke below support at 0.9630 and met indicated downside target at 0.7500 and 0.7400. The reversal from 0.7068 suggests the wave V has possibly ended and the breach of resistance at 0.9595 add credence to this view and indicated upside target at 1.0000 had been met, however, the sharp retreat from 1.0296 to 0.7401 suggests choppy trading would be seen but price should stay above said record low at 0.7068.
GBPUSD: All Signs Point To The Upside
'We continue to highlight GBP's vulnerability to a break above 1.25, given the extended bearish positioning and the potential for adjustment.' – Scotiabank (based on FXStreet)
Pair's Outlook
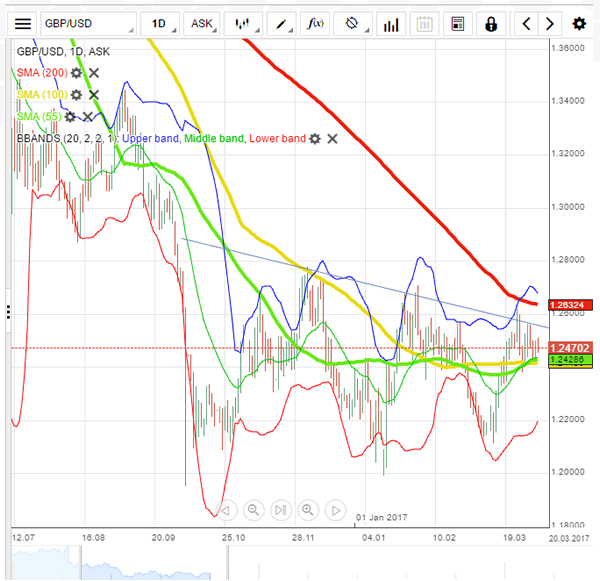
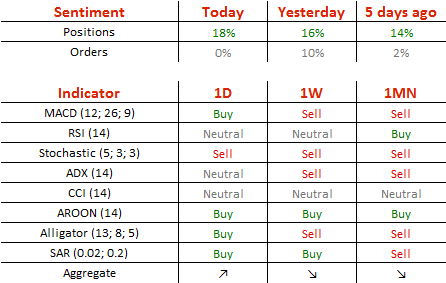
The US Dollar managed to outperform the British currency, but failed to carry out the anticipated retest of the support cluster around 1.2420. With today's US NFP data being the main market mover, the Cable has the opportunity to reconfirm the bearish trend-line at 1.2549 and possibly even pierce it should the employment figures disappoint. Technical indicators are also in favour of the positive outcome; however, we should not rule out the possibility of the NFP data surprising to the upside, in which case the substantial demand area circa 1.2420 could easily be pierced.
Traders' Sentiment
For the fifth consecutive day market sentiment improved, as now 59% of all open positions are long. Meanwhile, all pending orders are equally divided between the buy and the sell ones.
USD/JPY: In Limbo Ahead Of US NFP
'The fact that the dollar hasn't broken under 110 on this news [US conducting air strikes in Syria] shows how strong that level is, but we are still waiting to see Russia's reaction to the U.S. move.' – Sumitomo Mitsui Trust (based on Reuters)
Pair's Outlook
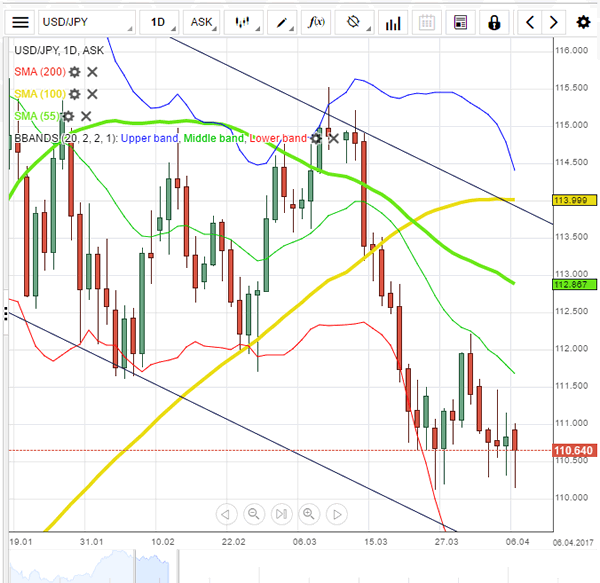
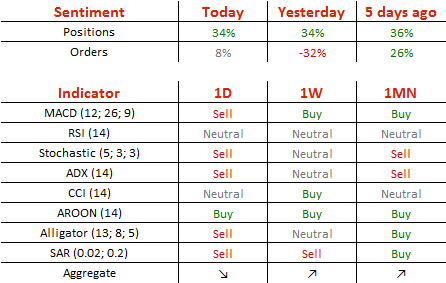
There has been barely any movement registered in the USD/JPY currency pair for the third day in a row yesterday, with the 110.50 mark still proving to be a tough psychological support. Today's NFP data is a double-edged sword, as from one hand the psychological support suggests the Greenback could continue avoiding further losses, while on the other technical indicators imply the given pair could fall under 110.00. Such a decline would even pave the way towards the descending channel's support line at 109.26 to be put to the test, which is also bolstered by the monthly S1, the weekly S2 and the lower Bollinger band. We expected the US Dollar to decline today.
Traders' Sentiment
Traders' sentiment remains bullish at 67%, but the share of purchase orders is significantly higher, up from 34 to 54%.
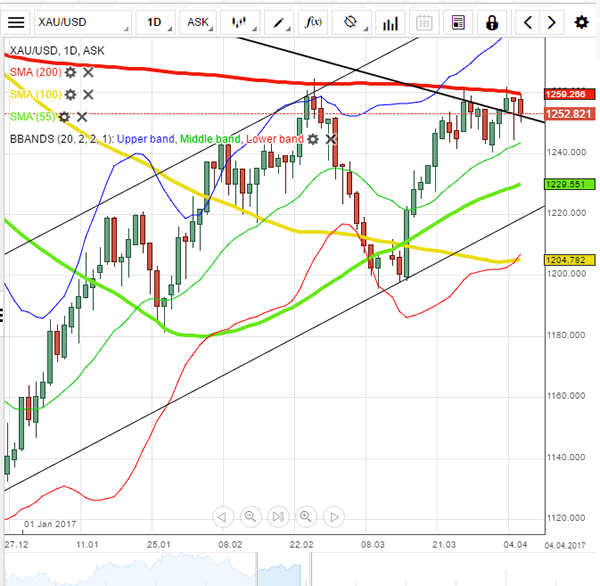
Gold: Jumps On Friday
'Bonds, the yen and gold jumped in Asia on Friday, while stocks slipped, as investors turned to safe-haven assets after the missile strikes.' – James Regan, Reuters
Pair's Outlook
On Friday the yellow metal's price jumped due to events in the world. The bullion's price surged due to the missile strikes conducted by the US on Syrian airfields. From a technical viewpoint the bullion passed the 200-day SMA at 1,255.71 and the weekly R1 at 1,259.70 level to trade at 1,269.33 during one point of the session. It is highly possible that the bullion will continue the surge, as events occur during the day. In such case the commodity price would most likely surge up to the weekly R2, which is located at the 1,271.04 level. The weekly R2 marks the beginning of a strong resistance cluster.
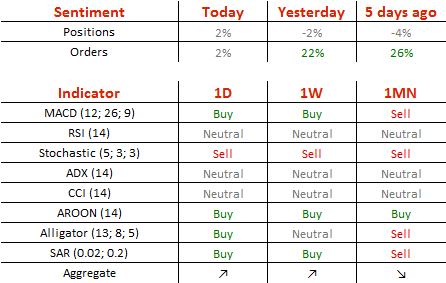
Traders' Sentiment
SWFX have become neutral bullish on the metal, as 51% of open positions are long. However, buy orders have decreased from 61% on Thursday to 51% on Friday.
Safe Havens Rally after the US Fires Missiles into Syria
Today, the US employment report for March will take center stage. The forecast is for nonfarm payrolls to have risen by 180k, less than the robust 235k in February, but still a solid number consistent with further tightening in the jobs market. The unemployment rate is forecast to have held steady at 4.7%, while average hourly earnings are expected to have risen at the same pace as previously in monthly terms.
We see the risks surrounding the NFP forecast as skewed to the upside, considering that the ADP jobs report for March showed that the private sector added 263k jobs, far more than the anticipated 187k. This would likely be one more set of data entering the basket of those supporting another near-term Fed rate hike.
According to the Fed funds futures, the next hike is fully priced in to come in September. So, a solid jobs report could bring those expectations forward, perhaps to anticipate that action in summer months. Such a shift in expectations could bring the dollar under renewed buying interest.
USD/JPY slid overnight after the US strike into Syria (see below), but the slide was stopped slightly above the psychological zone of 110.00 (S2). Then the rate rebounded somewhat. The pair is still trading below the downtrend line taken from the peak of the 14th of March, but given the inability of the bears to drive the battle below 110.00 (S2) and that we get the US jobs data later in the day, we prefer to stand pat for now. If the NFP number surprises to the upside, then we may see a test near the 111.00 resistance, where a clear break could open the way for another test near the key hurdle of 111.60 (R2). On the other hand, a disappointing report could prove the catalyst for a decisive dip below 110.00 (S2).
Safe havens rally after the US fires missiles into Syria
During the Asian trading session, safe haven assets such as JPY and gold came under renewed buying interest following reports that the US launched missiles against an air base in Syria. The US said that this was a response to a chemical attack the Syrian regime carried out against its own people. The US Pentagon said that the strike was intended "to deter the regime from using chemical weapons again".
Now, the questions in our minds are: What impact does this have on US-Russian relationships, considering that Russia is Syria's biggest ally, and what might Russia's reaction be? Also, was this a one-off strike, or the first of many to be carried out by the US?
If this uncertainty escalates further in the days to come, it could keep the market in a risk-off mood in our view. Safe haven assets could stay supported, while equities may underperform. For now, we expect US equity markets to take their cue from their European counterparts and open with negative gaps.
Gold surged on the event, breaking above the resistance (now turned into support) zone of 1260 (S1). The price structure on the 4-hour chart suggests a short-term uptrend, but given our proximity to the crossroad of the 1270 (R1) obstacle and the downside resistance line taken from the 11th of July, we prefer to stay neutral here as well. We would like to see a clear close above that crossroad before we trust the continuation of the short-term uptrend. Something like that could open the way for our next resistance of 1290 (R2). However, as we outlined above, there may be a positive surprise in the NFP number today, which could encourage gold-bears to push the price below 1260 (S1) and perhaps aim for the 1250 (S2) zone.
As for the rest of today's highlights:
During the European day, we get industrial production and trade balance data from both Germany and the UK, all for February.
We also get Canada's employment data for March. The forecast is for the unemployment rate to have ticked up. However, we view the risks surrounding that forecast as skewed to the downside, perhaps for an unchanged rate. We base our view on the nation's Markit manufacturing PMI for March, which showed the strongest rate of employment growth for almost five years in the sector. A positive surprise in the jobs data could reverse some of CAD's recent losses. We also get the nation's Ivey PMI for March.
We have only one speaker on the agenda: BoE Governor Mark Carney.
USD/JPY
Support: 110.35 (S1), 110.00 (S2), 108.80 (S3)
Resistance: 111.00 (R1), 111.60 (R2), 112.20 (R3)
XAU/USD
Support: 1260 (S1), 1250 (S2), 1244 (S3)
Resistance: 1270 (R1), 1290 (R2), 1300 (R3)
Trade Idea: EUR/JPY – Sell at 119.00
EUR/JPY - 117.65
Recent wave: wave v of (C) ended at 94.12 and major correction in wave A has ended at 149.79
Trend: Near term down
Original strategy:
Sell at 119.00, Target: 117.00, Stop: 119.60
Position: -
Target: -
Stop: -
New strategy :
Sell at 119.00, Target: 117.00, Stop: 119.60
Position: -
Target: -
Stop:-
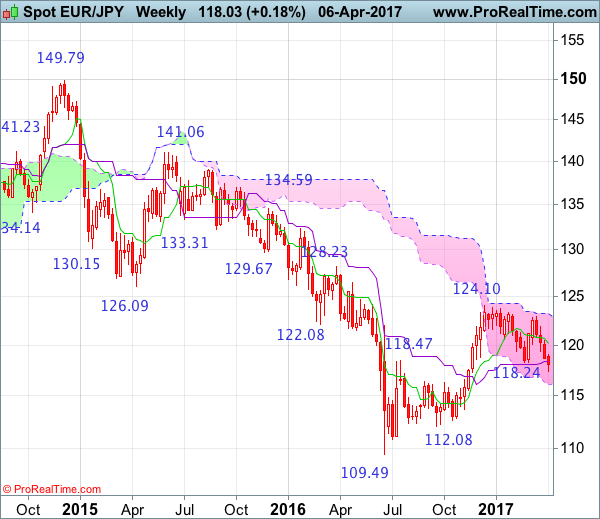
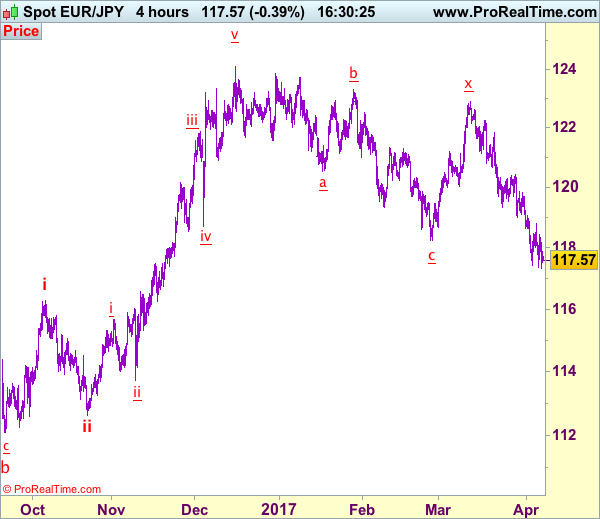
As the single currency has fallen again after brief recovery, suggesting recent erratic decline from 124.10 top (2016 high) is still in progress and bearishness remains for this move to extend weakness to 117.00 but oversold condition should prevent sharp fall below 116.50-60 and reckon 116.15-20 would hold from here, bring rebound later.
In view of this, would not chase this fall here and would be prudent to sell euro on subsequent rebound as 118.90-00 should limit upside. Above 119.06 resistance would defer and suggest a temporary low is possibly formed, risk rebound to 119.40-50 but price should falter below resistance at 119.85, bring another selloff.
Our latest preferred count is that wave (ii) is ABC-X-ABC which ended at 123.33 and wave (iii) is unfolding with wave iii ended at 100.77, followed by wave iv at 111.57 and wave v as well as the wave (iii) has ended at 97.04, followed by wave (iv) at 111.43 and wave (v) has ended at 94.12 which is also the end of the larger degree v, this also implied the major wave (C) has also ended there, hence major correction has commenced from there with (A) leg unfolding in its lower degree wave c which has possibly ended at 145.69. Under this count, A-B-C wave (B) has commenced with A leg ended at 136.23, wave B at 143.79 and wave C has possibly ended at 149.79.
Our larger degree count is that the decline from 139.26 is wave (C) and is sub-divided into a diagonal triangle i-ii-iii-iv-v with wave i - 105.44, wave ii- 123.33, wave iii - 97.03, wave iv - 111.43, followed by the final wave v as well as the end of wave (C) at 94.12, this also mark the bottom of larger degree wave B. Under this count, major rise in wave C has commenced as an impulsive wave with minor wave III ended at 145.69, wave V is still in progress for further gain to 150.00. Having said that, this so-called wave V could well be the first leg of larger degree 5-waver wave C and this wave C should bring at least a retest of wave A top at 169.97 (July 2008).
Trade Idea: AUD/USD – Hold long entered at 0.7525
AUD/USD – 0.7531
Recent wave: Wave 5 ended at 1.1081 and major correction has commenced for fall to 0.7000 and then towards 0.6500-10
Trend: Near term up
Original strategy :
Bought at 0.7525, Target: 0.7680, Stop: 0.7465
Position: - Long at 0.7525
Target: - 0.7680
Stop: - 0.7465
New strategy :
Hold long entered at 0.7525, Target: 0.7680, Stop: 0.7465
Position: - Long at 0.7525
Target: - 0.7680
Stop:- 0.7465
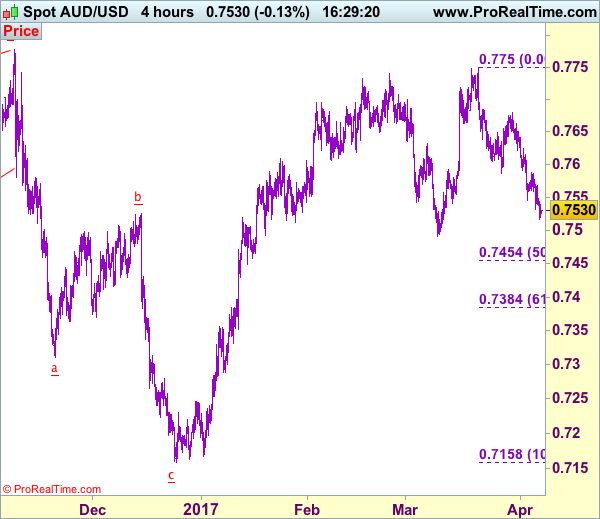
Although aussie has remained under pressure and marginal weakness from here cannot be ruled out, loss of near term downward momentum should prevent sharp fall below 0.7500 and bring rebound later, above indicated resistance at 0.7588 would suggest a temporary low is possibly formed, bring rebound to 0.7625-30 and later towards resistance at 0.7680-85.
In view of this, we are holding on to our long position entered at 0.7525. Below indicated support at 0.7491 would signal the fall from 0.7750 is still in progress for further weakness to 0.7450-55 (50% Fibonacci retracement of 0.7158-0.7750), however, oversold condition should limit downside to 0.7380-85 (61.8% Fibonacci retracement), risk from there is seen for a rebound later.
On the 4-hour chart, the move from 0.8066 is the wave 5 with i: 0.8860, ii: 0.8315, wave iii is an extended move ended at 1.0183, iv: 0.9706 and wave v has ended at 1.1081 (also the top of entire wave 5). The subsequent selloff is the major correction which is unfolding as ABC-X-ABC and 2nd A leg has ended at 0.8848, followed by a-b-c wave B which ended at 0.9758, hence, 2nd C wave is now in progress and indicated downside target at 0.7000 and 0.6950 had been met, so further fall to 0.6710-20 cannot be ruled out.
Will Non-Farm Payroll(NFP) Lift USD ?
US non-farm payroll and unemployment for March will be released this Friday at 13:30 BST.
In the past three days, the dollar index was oscillating in the range between 100.30 – 100.65. It edges up this morning during European sessions. Be aware that the release of the US labour market data this afternoon will likely cause volatility for USD, USD crosses, and commodities.
The US unemployment has seen a downtrend since 2010, and has stabilised within the range between 4.6% – 5% in 2016. The average revised figure of non-farm payrolls in the past 6 months was around 183K, which is close to the 180K estimate for March. If the upcoming NFP figure outperforms, or is in line with expectations, then we can expect a probable rate hike in June. However, if it is lower than 140K, then it will likely lower the probability of a rate hike.
The ADP employment change (March), which is regarded as the prediction of NFP, was 263k, better than expectations of 187K, seeing the peak since July 2014. Construction, manufacturing, mining, healthcare, catering, foreign trade and service sectors have seen noticeable job gains. The job creation in construction hit a record high last month.
Be aware that, according to past experience, the market trends sometimes reverse within 1-2 hours after the initial move.
We will see a series of crucial UK data for February to be released at 09:30 BST today, including manufacturing production, industrial production, and trade balance.
The Bank of England governor Carney will make a speech at 10:00 BST. GBP/USD is currently trading in the range between 1.2400 – 1.2500. Be aware that Carney’s speech will likely cause volatility for Sterling.
The European Central Bank President Draghi made a dovish statement on Thursday, weighed on the Euro. EUR/USD hit a 3-week low of 1.0628 on Thursday.
Despite the Eurozone economy is improving, the Eurozone composite PMI for March hit a 6-year high of 56.7. Draghi stated that the substantial monetary accommodation is still appropriate until the end of the year, as the bank has not yet seen sufficient evidence of an inflation pickup.
EUR/JPY Candlesticks and Ichimoku Analysis
Weekly
• Last Candlesticks pattern: Hammer
• Time of formation: 19 Sep 2016
• Trend bias: Down
Daily
• Last Candlesticks pattern: Doji
• Time of formation: 28 Mar 2017
• Trend bias: Near term up
EUR/JPY – 117.65
As the single currency has remained under pressure after breaking support at 118.24, adding credence to our bearish view that recent erratic decline from 124.10 is still in progress and downside bias remains for this fall to extend weakness to 117.00-05 (61.8% Fibonacci retracement of 112.61-124.10), however, near term oversold condition should prevent sharp fall below 116.40-50 and reckon previous resistance at 116.29 (now support) would hold on first testing, risk from there is seen for a rebound to take place later.
On the upside, whilst initial recovery to 118.30-35 cannot be ruled out, reckon upside would be limited to the Tenkan-Sen (now at 118.88) and bring another decline later. A daily close above 119.00-05 would defer and risk a stronger rebound to 119.75-80 but resistance at 120.44 should remain intact, bring another decline later. Above the Kijun-Sen (now at 120.11) would abort and suggest low is formed instead, bring a stronger rebound to 120.44 resistance but a sustained breach above there is needed to provide confirmation, bring subsequent gain to the upper Kumo (now at 121.05).
Recommendation: Sell at 120.40 for 118.40 with stop above 121.40.
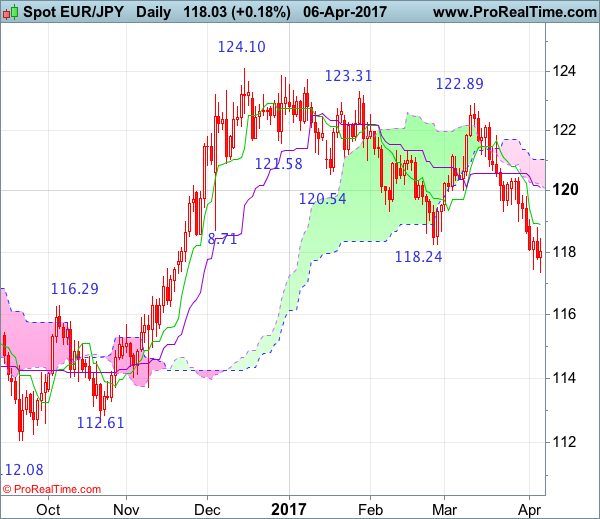
On the weekly chart, this week’s selloff below support at 118.24 adds credence to our view that top has been formed at 124.10 and consolidation with mild downside bias remains for the fall from there to bring retracement of recent upmove, hence weakness to 117.00 is likely but a weekly close below previous resistance at 116.29 (now support) is needed to signal the rebound from 109.49 has ended at 124.10, bring further fall to 115.50 and then 115.00, however, near term oversold condition should prevent sharp fall below 114.40-50 and support at 113.72 should remain intact, bring rebound later.
On the upside, expect recovery to be limited to 119.00-05 and the Tenkan-Sen (now at 120.11) should hold, bring another decline later. Only above resistance at 120.44 would suggest low is formed instead, bring a stronger rebound to 121.15-20 but resistance at 121.84 should remain intact, bring another decline later. A break of this resistance would suggest the pullback from 124.10 has ended, bring further gain towards resistance at 122.89 which is likely to hold from here.