Sample Category Title
Daily Technical Outlook And Review: EUR/USD, GBP/USD, AUD/USD, USD/JPY, USD/CAD, USD/CHF, DOW 30, GOLD
A note on lower timeframe confirming price action...
Waiting for lower timeframe confirmation is our main tool to confirm strength within higher timeframe zones, and has really been the key to our trading success. It takes a little time to understand the subtle nuances, however, as each trade is never the same, but once you master the rhythm so to speak, you will be saved from countless unnecessary losing trades. The following is a list of what we look for:
- A break/retest of supply or demand dependent on which way you're trading.
- A trendline break/retest.
- Buying/selling tails ... essentially we look for a cluster of very obvious spikes off of lower timeframe support and resistance levels within the higher timeframe zone.
- Candlestick patterns. We tend to only stick with pin bars and engulfing bars as these have proven to be the most effective.
EUR/USD
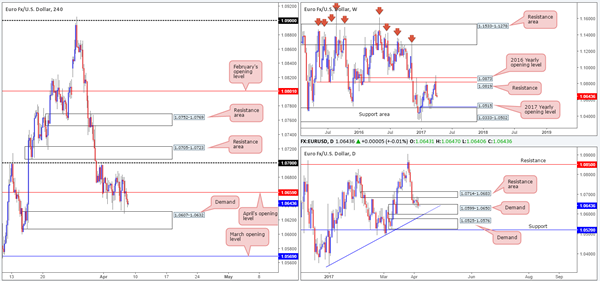
Since the beginning of the week, the single currency has been sandwiched between a daily demand base at 1.0599-1.0650 and a daily resistance area drawn from 1.0714-1.0683. Up on the weekly chart, nevertheless, the pair remains vulnerable to the downside, with little support seen in the picture until we connect with the 2017 yearly opening level at 1.0515/support area at 1.0333-1.0502.Jumping across to the H4 candles, price is seen trading beneath April’s opening barrier at 1.0659, and appears to be on course to shake hands with demand at 1.0607-1.0632 (located within the above said daily demand).
Today’s economic data brings out the main event of the week: the US non-farm payrolls employment report. Therefore, we may see price snap out of its consolidative phase. Beyond the current H4 demand, we have March’s opening level at 1.0569 in view. Above April’s opening line there’s the 1.07 handle, shadowed closely by a H4 resistance area penciled in at 1.0705-1.0723 to watch for.
Our suggestions: Right now, we see very little opportunity to trade, unless, of course, one fancies the idea of trading from the current H4 demand that’s bolstered by the daily demand at 1.0599-1.0650 (but this would place one against weekly flow – see above). Ultimately, we’re going to sit tight and see how price responds to the NFP report. Hopefully, it should shake things up a bit and create some trading opportunities!
Data points to consider: US non-farm payrolls employment report, Average hourly earnings and unemployment rate at 1.30pm. FOMC member Dudley speaks at 5.15pm GMT.
Levels to watch/live orders:
- Buys: Flat (stop loss: N/A).
- Sells: Flat (stop loss: N/A).
GBP/USD:
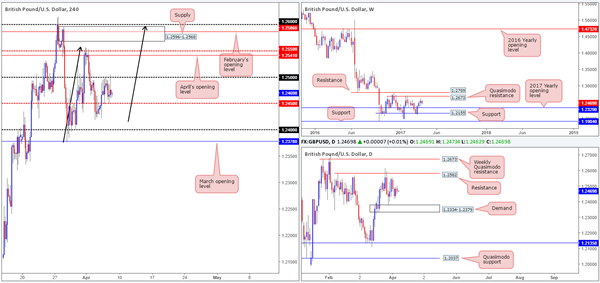
Of late, the GBP/USD has been seen ranging between the H4 mid-way support at 1.2450 and the psychological band 1.25. Of particular interest on the H4 chart, however, is the potential AB=CD bearish pattern that terminates around the upper edge of supply coming in at 1.2596-1.2568. Still, before this can come to fruition, April’s opening line at 1.2541 and the mid-level resistance at 1.2550 needs to be consumed.
Looking over to the bigger picture, weekly action is seen meandering between a Quasimodo resistance at 1.2673 and the 2017 yearly opening level at 1.2390. In addition to this, we can also see daily price loitering mid-range between resistance plotted at 1.2582 (lodged within the aforementioned H4 supply) and demand at 1.2334-1.2379.
Our suggestions: With the US non-farm payrolls employment report just around the corner, we are hesitant to take on any positions right now. Ideally, we’re looking for the NFP to push prices north to help complete the above noted H4 AB=CD structure.
Data points to consider: UK manufacturing at 9.30am, BoE Gov. Carney speaks at 10am. US non-farm payrolls employment report, Average hourly earnings and unemployment rate at 1.30pm. FOMC member Dudley speaks at 5.15pm GMT.
Levels to watch/live orders:
- Buys: Flat (stop loss: N/A).
- Sells: Flat (stop loss: N/A).
AUD/USD
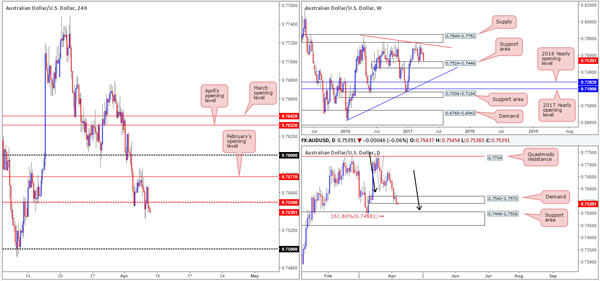
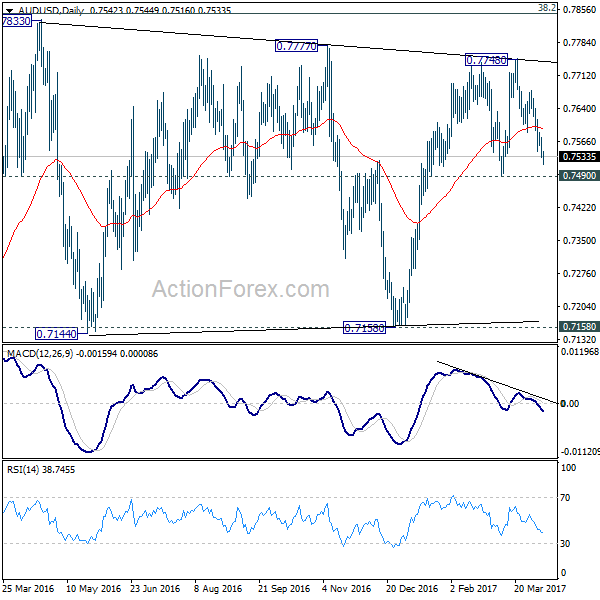
Kicking this morning’s report off with a look at the weekly timeframe, price is currently seen trading within striking distance of a support area fixed at 0.7524-0.7446. The pair is likely to find support here with it having been a considerable structure since mid-2016. Down on the daily timeframe, the bulls attempted to recover from demand at 0.7540-0.7570 on Wednesday, but, as you can see, failed to generate any type of follow through. The next zone of interest beyond here is 0.7449-0.7506: a support area that holds an AB=CD (see black arrows) 161.8% Fib ext. at 0.7488.
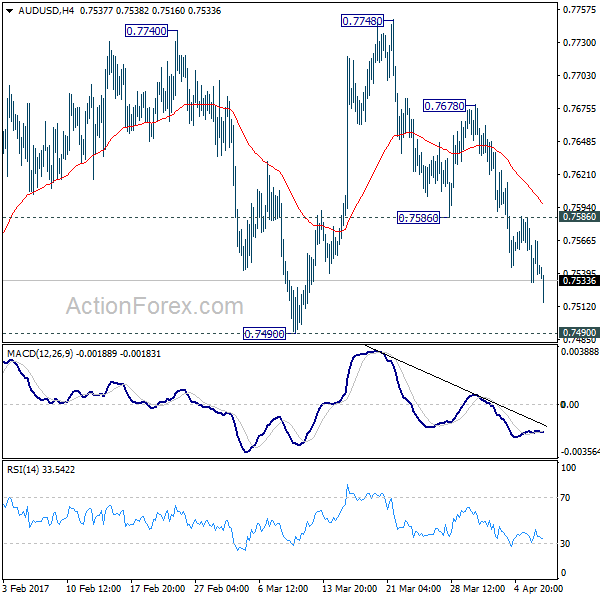
Across on the H4 timeframe, we can see that price has recently run through bids at 0.7550. According to the H4 structure, there’s very little stopping price from connecting with the 0.75 handle today. However, do note that the top edge of the weekly support area is seen at 0.7524, so the H4 candles may struggle to reach 0.75.
Our suggestions: With the daily candles still seen trading within demand at 0.7540-0.7570, and weekly price not far from connecting with a hefty piece of structure, we feel shorts beyond 0.7550 is a little too risky for our liking. As such, we will hold fire today and re-evaluate the situation post NFP.
Data points to consider: US non-farm payrolls employment report, Average hourly earnings and unemployment rate at 1.30pm. FOMC member Dudley speaks at 5.15pm GMT.
Levels to watch/live orders:
- Buys: Flat (stop loss: N/A).
- Sells: Flat (stop loss: N/A).
USD/JPY:
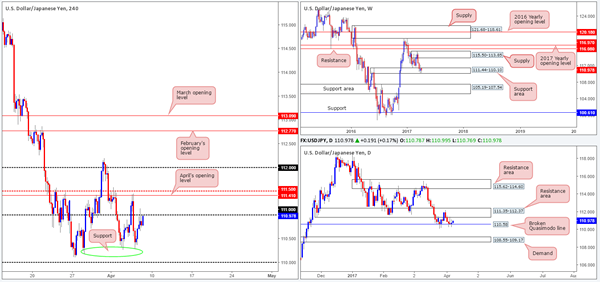
In view of weekly price holding firm within the walls of a support area at 111.44-110.10, entering into any long-term shorts may be risky. Daily price continues to range between a resistance area at 111.35-112.37 and a broken Quasimodo line at 110.58. Therefore, until the resistance area is taken out, we would also be wary of committing to any long-term buys at the moment.
Jumping across to the H4 chart, the candles are seen rejecting the 111 handle. A break beyond this number would likely place the underside of the daily resistance area at 111.35 in view, alongside April’s opening level at 111.41 and the mid-level resistance at 111.50.
Our suggestions: A short from the 111.50 region looks like a reasonable possibility, given its surrounding confluence. However, let’s bear in mind that by selling here, you would be going against weekly flow! As such, waiting for a lower-timeframe confirming signal to form beforehand (see the top of this report) may be the safer route to take.
Data points to consider: US non-farm payrolls employment report, Average hourly earnings and unemployment rate at 1.30pm. FOMC member Dudley speaks at 5.15pm GMT.
Levels to watch/live orders:
- Buys: Flat (stop loss: N/A).
- Sells: 111.50 region: ([waiting for a lower-timeframe confirming signal to form is advised] stop loss: dependent on where one confirms the area).
USD/CAD
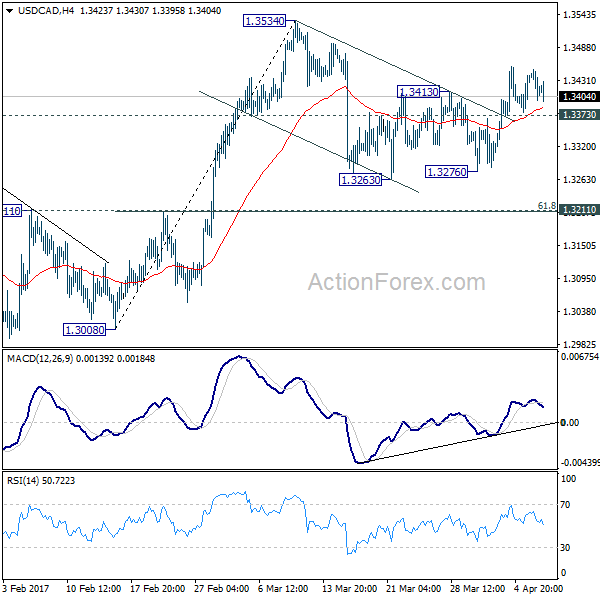
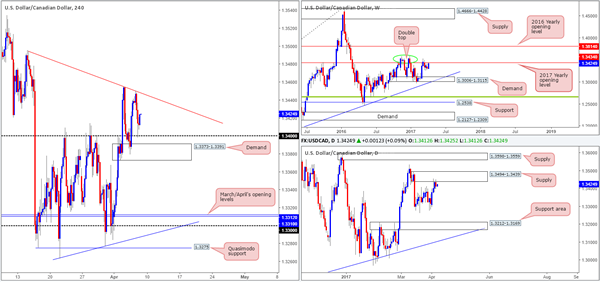
While the H4 candles are seen finding support off the 1.34 handle at the moment, one must take into account that not only is weekly action teasing the 2017 yearly opening level at 1.3434, but daily price is also seen testing the underside of a daily supply coming in at 1.3494-1.3439. To that end, we would not be keen to join in on any buying from 1.34 right now. With the above notes in mind, we have our eye on the H4 trendline resistance extended from the high 1.3495 for possible shorting opportunities.
Our suggestions: To avoid any fakeout seen at the aforementioned H4 trendline, however, a reasonably sized H4 bearish rotation candle is required before our team would consider shorting. The first take-profit target can be seen at 1.34, followed closely by a H4 demand drawn in at 1.3373-1.3391.
Data points to consider: US non-farm payrolls employment report, Average hourly earnings and unemployment rate at 1.30pm. FOMC member Dudley speaks at 5.15pm. Canadian employment data also scheduled for release at 1.30pm GMT.
Levels to watch/live orders:
- Buys: Flat (stop loss: N/A).
- Sells: H4 trendline resistance extended from the high 1.3495 ([waiting for a reasonably sized H4 bearish rotation candle to form before pulling the trigger is advised] stop loss: ideally beyond the trigger candle).
USD/CHF
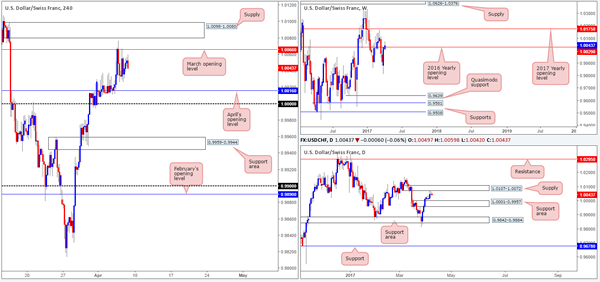
As can be seen from the H4 chart this morning, March’s opening level at 1.0066 capped upside during Wednesday/Thursday’s sessions. This level – coupled with the nearby H4 supply at 1.0098-1.0080, will be a difficult area to break, in our opinion. Even more so, considering that there’s a daily supply zone also seen currently in play at 1.0107-1.0072.
Our suggestions: An ideal scenario would be for H4 price to fake beyond March’s opening level and touch gloves with the aforementioned H4 supply. Should this occur and the H4 candles form a nice-looking selling wick, we would consider shorts. With that being said though, today’s economic data brings out the main event of the week: the US non-farm payrolls employment report, potentially creating unpredictable moves. As a result, our desk noted that unless H4 price fakes beyond 1.0066 into the H4 supply during the London morning segment, we will wait on the sidelines until post NFP.
Data points to consider: US non-farm payrolls employment report, Average hourly earnings and unemployment rate at 1.30pm. FOMC member Dudley speaks at 5.15pm GMT.
Levels to watch/live orders:
- Buys: Flat (stop loss: N/A).
- Sells: A fakeout beyond 1.0066 into H4 supply at 1.0098-1.0080 in the form of a H4 selling wick would be an interesting signal to sell (stop loss: ideally beyond the trigger candle).
DOW 30
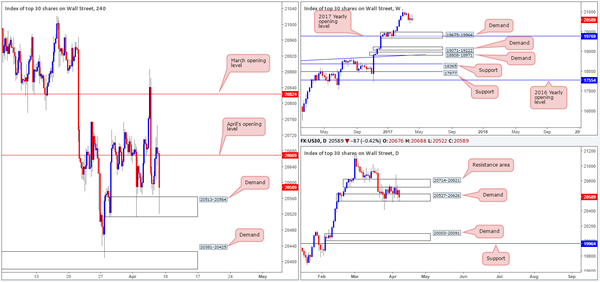
Since price topped at a record high of 21170 and pulled back to lows of 20409, the index entered into a phase of consolidation on the daily chart. The resistance area at 20714-20821 and demand coming in at 20527-20626 have, as you can see, both withstood multiple attacks.
While weekly price shows room to extend down to demand at 19675-19964, we would prefer to see the daily demand zone consumed before any shorts are considered. The next downside hurdle on the daily timeframe can be seen at a demand base drawn from 20003-20091 (positioned just above the weekly demand).
Our suggestions: Neither a long nor short seems attractive at this time. Yes, a long from the current H4 demand at 20513-20564 is interesting, given its connection to daily demand, but not when the weekly chart shows so much space visible to the downside! Personally, we’ll wait for the NFP to do its thing and reassess following the release.
Data points to consider: US non-farm payrolls employment report, Average hourly earnings and unemployment rate at 1.30pm. FOMC member Dudley speaks at 5.15pm GMT.
Levels to watch/live orders:
- Buys: Flat (stop loss: N/A).
- Sells: Flat (stop loss: N/A).
GOLD
In recent hours the US dollar sold off, consequently pushing the price of gold higher. H4 price walloped its way through resistance at 1260.0 (now acting support), and has potentially paved the way for the unit to challenge resistance pegged at 1275.5. Before we all go hunting for longs in this market, however, it might be worth noting that weekly resistance at 1263.7 is currently in play, as is the upper edge of a daily supply at 1265.2.
Our suggestions: Although a long from 1260.0 is tempting, we feel that the higher-timeframe structure will be just too overwhelming here! The H4 161.8% Fib ext. at 1267.9 (taken from the low 1243.6) seems to be holding firm at the moment. Given this factor, and the higher-timeframe resistances in motion, a short from here is high probability. Still, seeing as how there is limited structure to place stops, we will wait for a lower-timeframe confirming sell signal to form here before committing (see the top of this report).

Levels to watch/live orders:
- Buys: Flat (stop loss: N/A).
- Sells: 1267.9 region ([waiting for a lower-timeframe confirming signal to form is advised before pulling the trigger [stop loss: dependent on where one confirms this area).
European Open Briefing: The FX Market Remained Calm
Global Markets:
- Asian stock markets: Nikkei up 0.60 %, Shanghai Composite gained 0.25 %, Hang Seng fell 0.70 %, ASX 200 declined 0.15 %
- Commodities: Gold at $1264 (+0.85 %), Silver at $18.39 (+0.80 %), WTI Oil at $52.50 (+1.60 %), Brent Oil at $55.65 (+1.40 %)
- Rates: US 10-year yield at 2.32, UK 10-year yield at 1.10, German 10-year yield at 0.26
News & Data:
- Australian AIG Construction Index Mar: 51.2 (prev 53.1)
- PBoC Fixes USDCNY Reference Rate At 6.8949 (prev fix 6.8930 prev close 6.8980)
- Stocks skid, safe-haven assets jump as U.S. missiles strike Syria – RTRS
- Oil prices jump 2 percent after U.S. launches missile strike in Syria – RTRS
Markets Update:
It was a risk-off session in Asia after the US announced that it launched missile strikes in Syria. While the reaction in FX was muted, Gold jumped above 1263 resistance and Oil prices rallied more than 2 percent. Gold reached a high of almost 1270, but reversed some of the gains later in the session. Support is now seen at 1260 and 1252.
The FX market remained calm. Traders are waiting for the US employment data today, and are not willing to take much risk ahead of it. The market is anticipating a slightly higher NFP number following the solid ADP figure on Wednesday. Nevertheless, the Dollar remains under pressure against the Yen, as the currency is benefiting from the risk aversion.
Upcoming Events:
- 06:45 GMT – Swiss Unemployment Rate
- 07:00 GMT – German Trade Balance
- 07:00 GMT – German Industrial Production
- 07:45 GMT – French Trade Balance
- 08:30 GMT – UK Halifax House Price Index
- 09:30 GMT – UK Industrial Production
- 09:30 GMT – UK Manufacturing Production
- 09:30 GMT – UK Trade Balance
- 10:00 GMT – Bank of England Governor Carney speaks
- 13:30 GMT – US NFP
- 13:30 GMT – US Unemployment Rate
- 13:30 GMT – US Average Hourly Earnings
- 13:30 GMT – Canadian Unemployment Rate
- 13:30 GMT – Canadian Employment Change
- 15:00 GMT – Canadian Ivey PMI
- 15:00 GMT – Bank of Canada Governor Poloz speaks
Elliott Wave View: EURJPY Further Downside
Short term Elliott Wave view in EURJPY suggests that cycle from 3/12 peak (122.89) is unfolding as a double three Elliott wave structure where Minor wave W ended at 119.28 and Minor wave X ended at 120.45. Minor wave Y is in progress and the internal is unfolding also as a double three Elliott wave structure where Minute wave ((w)) ended at 117.38 and Minute wave ((x)) bounce is proposed complete at 118.79. Pair has resumed the decline lower and the decline is unfolding as a zigzag Elliott wave structure where Subminutte wave a ended at 117.33 and Subminutte wave b ended at 118.43. Near term, while bounces stay below 118.79, but more importantly below 120.45, expect pair to extend lower. We don’t like buying the proposed bounce.
EURJPY 1 Hour Elliott Wave Chart
GBP/JPY Daily Outlook
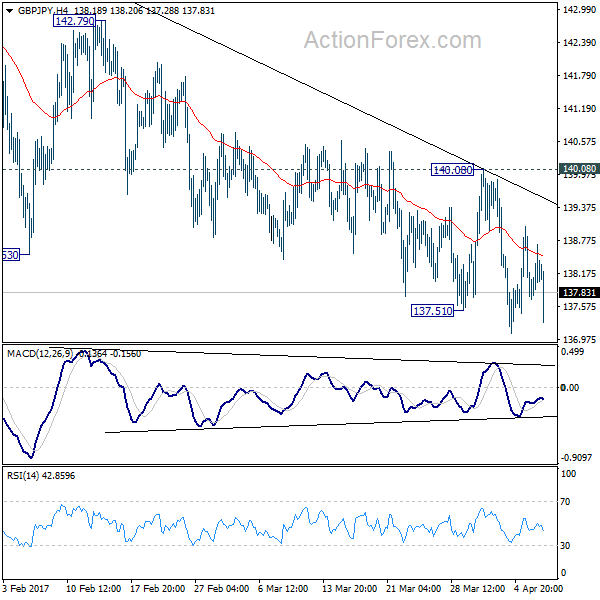
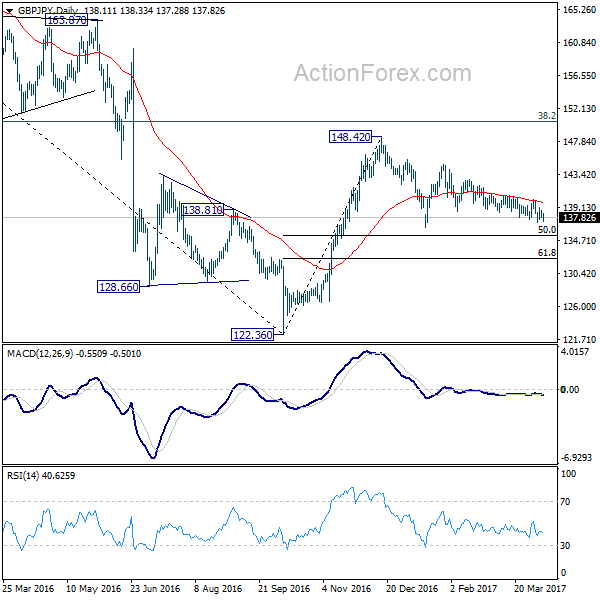
Daily Pivots: (S1) 137.67; (P) 138.19; (R1) 138.67; More...
With 140.08 resistance intact, deeper decline is expected in GBP/JPY. Choppy fall from 144.77 would target medium term fibonacci level at 135.39. Overall, price action from 148.42 are seen as a consolidation pattern. We'll look for bottoming around 135.39. Meanwhile, break of 140.08 resistance is needed to indicate short term reversal. Otherwise, outlook will remain bearish in case of recovery.
In the bigger picture, price actions from 122.36 medium term bottom are still seen as a corrective pattern. Main focus is on 38.2% retracement of 195.86 to 122.36 at 150.42. Rejection from there will turn the cross into medium term sideway pattern. Or, sustained break of 50% retracement of 122.36 to 148.42 at 135.39 will turn outlook bearish for a test on 122.36 low. Though, sustained break of 150.42 will extend the rebound towards 61.8% retracement of 195.86 to 122.36 at 167.78.
EUR/JPY Daily Outlook
Daily Pivots: (S1) 117.38; (P) 117.90; (R1) 118.44; More...
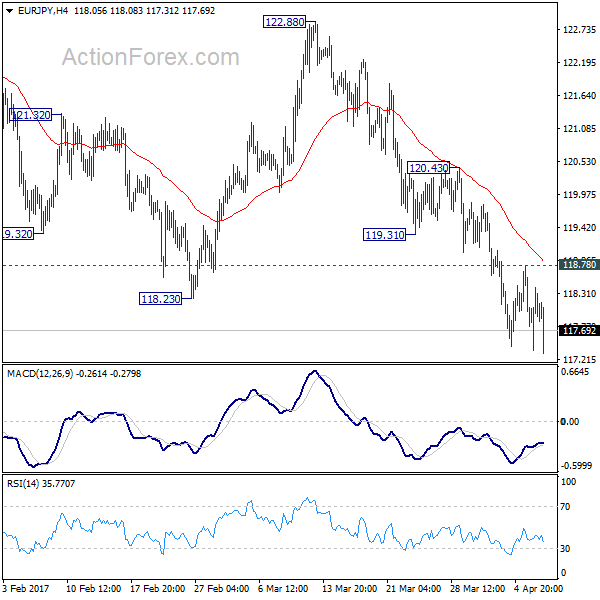
Downside momentum in EUR/JPY is a bit unconvincing with 4 hour MACD staying above signal line. But with 118.78 minor resistance intact, deeper decline is expected. Current development suggests that medium term rise from 109.20 has completed at 124.08 already. Further fall should be seen to 61.8% retracement of 109.20 to 124.08 at 114.88 next. On the upside, above 118.78 will indicate short term bottoming and bring rebound back to 119.31/120.43 resistance zone.
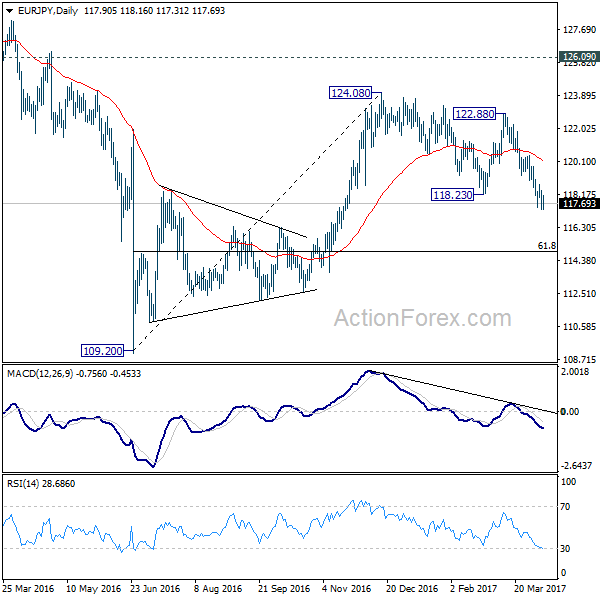
In the bigger picture, the firm break of 38.2% retracement of 109.20 to 124.08 at 118.39 indicates that medium term rise from 109.20 is completed at 124.08. That's well below 126.09 key support turned resistance. Also, EUR/JPY failed to sustain above 55 week EMA. Deeper decline would now be seen back to 109.20 low. Overall, the down trend from 149.76 (2014 high) is not completed yet. Break of 109.20 will resume such down trend towards 94.11 low. In any case, break of 126.09 is needed needed to confirm medium term reversal.
EUR/AUD Daily Outlook
Daily Pivots: (S1) 1.4066; (P) 1.4118; (R1) 1.4156; More...
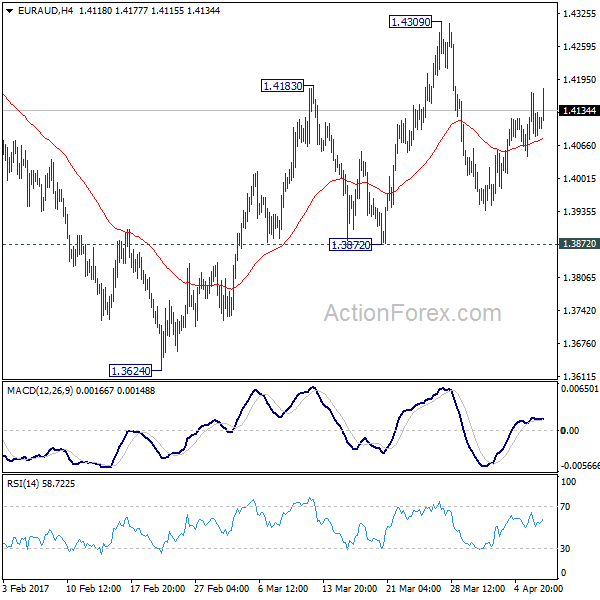
EUR/AUD is staying in range of 1.3872/4309 and intraday bias remains neutral. We're holding on to the view of trend reversal after defending key support level at 1.3671. Another rise is expected as long as 1.3872 minor support holds. Break of 1.4309 will extend the rebound from 1.3624 to 1.4721 key resistance level next. Break should confirm larger trend reversal. However, firm break of 1.3872 support will dampen our bullish view. In such case, intraday bias will be turned back to the downside for 1.3624 low instead.
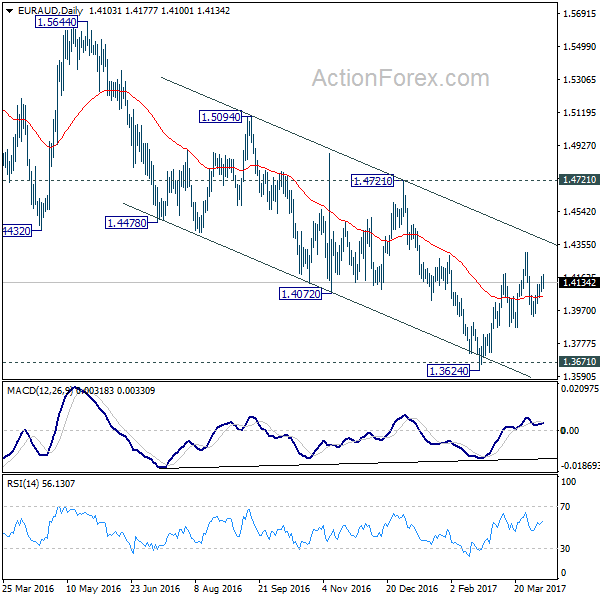
In the bigger picture, price actions from 1.6587 medium term top are viewed as a corrective pattern. Such correction could be completed after testing 1.3671 support. Break of 1.4721 cluster resistance (38.2% retracement of 1.6587 to 1.3624 at 1.4756) should confirm this case and target 61.8% retracement at 1.5455 and above. Overall, we'd expect the up trend from 1.1602 to resume later. However, sustained break of 1.3671 will invalidate our bullish view and would turn extend the fall from 1.6587 towards 1.1602 long term bottom.
EUR/GBP Daily Outlook
Daily Pivots: (S1) 0.8508; (P) 0.8537; (R1) 0.8564; More...
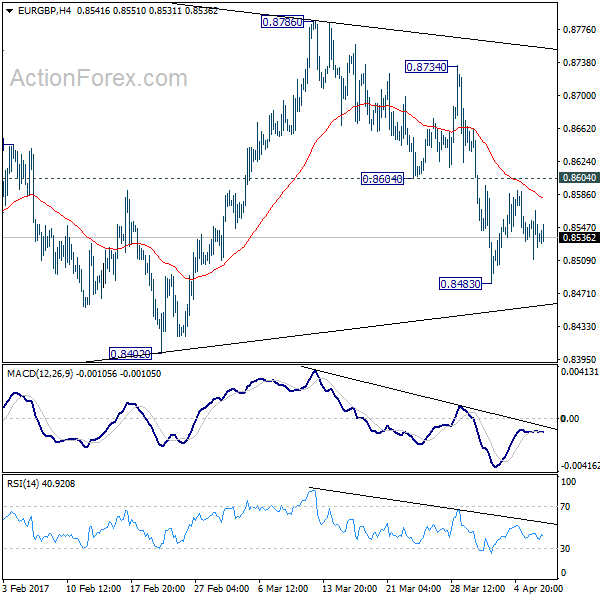
Intraday bias in EUR/GBP remains neutral as it's bounded in tight range between 0.8483/8604. There is no change in the view that price actions from 0.8303 are a consolidation pattern. And, it's the second leg of the correction from 0.9304. Below 0.8430 will target 0.8402. Break of 0.8402 will resume the fall from 0.9304 to 0.8116/20 cluster support, where the correction should end. On the upside, above 0.8604 minor resistance will bring another recovery before fall from 0.9304 resumes.
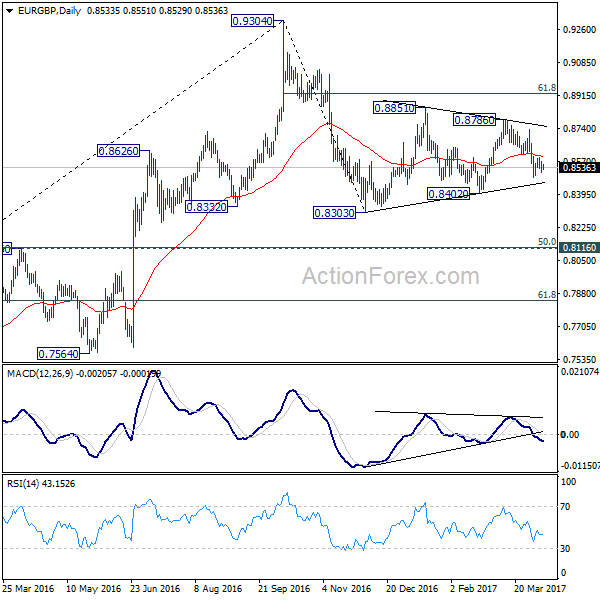
In the bigger picture, price actions from 0.9304 are viewed as a medium term corrective pattern. Such decline is likely ready to resume and should make a new low below 0.8303. At this point, we'd expect strong support from 0.8116 cluster support (50% retracement of 0.6935 to 0.9304 at 0.8120) to contain downside. Break of 0.9304 will pave the way to 0.9799 (2008 high). However, sustained break of 0.8116 could bring deeper decline to next key support level at 0.7564 before the correction completes.
EUR/CHF Daily Outlook
Daily Pivots: (S1) 1.0693; (P) 1.0709; (R1) 1.0731; More...
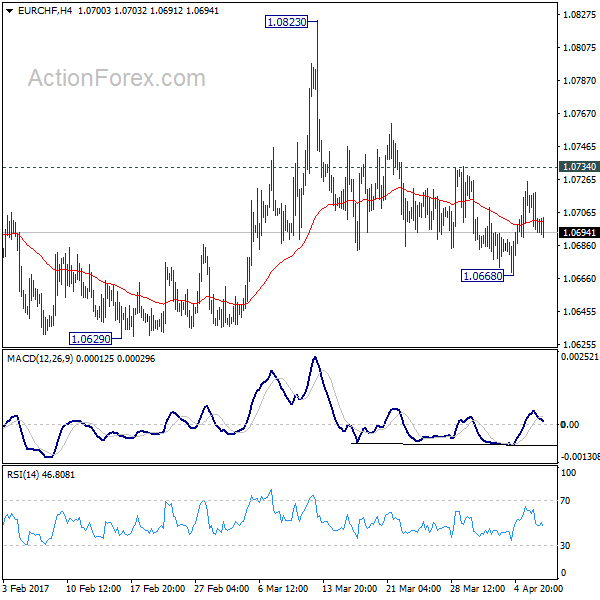
EUR/CHF is staying in range above 1.0668 and intraday bias remains neutral. With 1.0734 minor resistance intact, deeper decline is in favor. Below 1.0668 will target 1.0620/29 key support zone. Decisive break there will resume the larger fall from 1.1198. Nonetheless, break of 1.0734 will turn bias back to the upside for 1.0823 resistance instead.
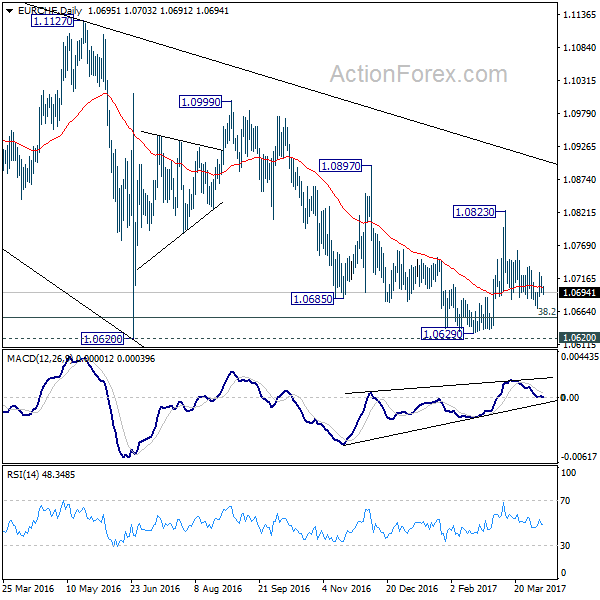
In the bigger picture, the decline from 1.1198 is seen as a corrective move. Current development suggests that it's not completed yet. sustained trading below 38.2% retracement of 0.9771 to 1.1198 at 1.0653 will target 50% retracement at 1.0485. In any case, break of 1.0823 resistance is needed to be the first indication of reversal. Otherwise, deeper fall is still expected even in case of recovery.
AUD/USD Daily Outlook
Daily Pivots: (S1) 0.7525; (P) 0.7551; (R1) 0.7569; More...
AUD/USD drops to as low as 0.7516 so far today and intraday bias remains on the downside for 0.7490 support. Decisive break of 0.7490 will confirm completion of rise from 0.7158. In such case, near term outlook will be turned bearish for 0.7158 support. On the upside, above 0.7586 minor resistance will turn bias neutral first. And, break of 0.7678 minor resistance will turn bias back to the upside and could extend the rise fro 0.7158 through 0.7748 resistance.
In the bigger picture, we're still treating price actions from 0.6826 low as a correction. And, as long as 38.2% retracement of 0.9504 to 0.6826 at 0.7849 holds, long term down trend from 1.1079 is expected to resume sooner or later. Break of 0.6826 low will target 0.6008 key support level. However, firm break of 0.7849 will indicate that rise from 0.6826 is developing into a medium term rebound, rather than a sideway pattern. In such case, stronger rise should be seen to 55 month EMA (now at 0.8165) and above.
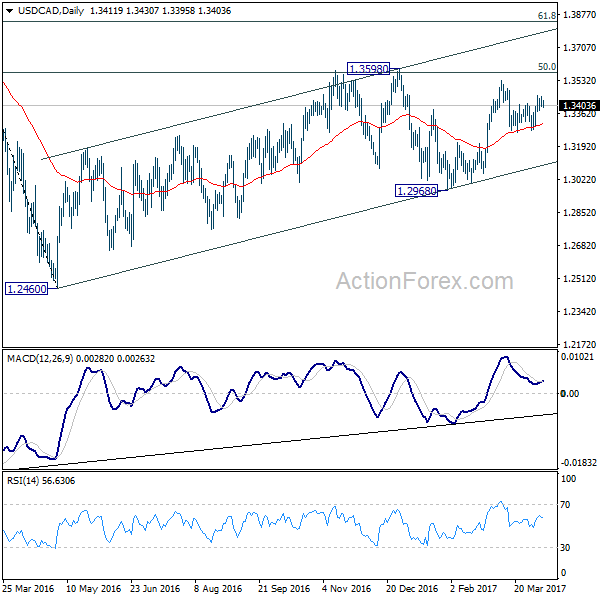
USD/CAD Daily Outlook
Daily Pivots: (S1) 1.3390; (P) 1.3420; (R1) 1.3442; More....
With 1.3373 minor support intact, further rise is mildly in favor in USD/CAD. Break of 1.3534 resistance will extend whole rise from 1.2698 to 1.3598 resistance. On the downside, below 1.3373 minor support will turn bias back to the downside and could extend the correction from 1.3534 with another fall. But we'd expect strong support from 1.3211 cluster level (61.8% retracement of 1.3008 to 1.3534 at 1.3209) to contain downside and bring rebound. Overall, medium term rebound form 1.2460 is still expected to extend through 1.3598.
In the bigger picture, price actions from 1.4689 medium term top are seen as a correction pattern. The first leg has completed at 1.2460. The second leg from 1.2460 is likely still in progress and could target 61.8% retracement of 1.4689 to 1.2460 at 1.3838. We'd look for reversal signal there to start the third leg. Break of 1.2968 will argue that the third leg has already started and should at least bring at retest of 1.2460 low. However, sustained trading above 1.3838 would pave the way to retest 1.4689 high.