Sample Category Title
Bulls Taking Off On Silver
Silver looks to be trading in wave 5) as part of a bullish impulse. That said, as we know after wave 5) finds a top, a three wave reaction may follow in the opposite direction with potential support at the former swing low at 18.02. Wave 5) may see limited upside around the 18.49 level.
SILVER, 4H
Technical Outlook: GBPUSD Is At The Back Foot In Early Friday, BOE Carney And US NFP Data Seen As...
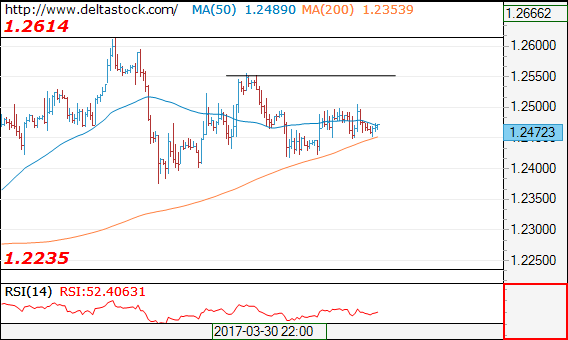
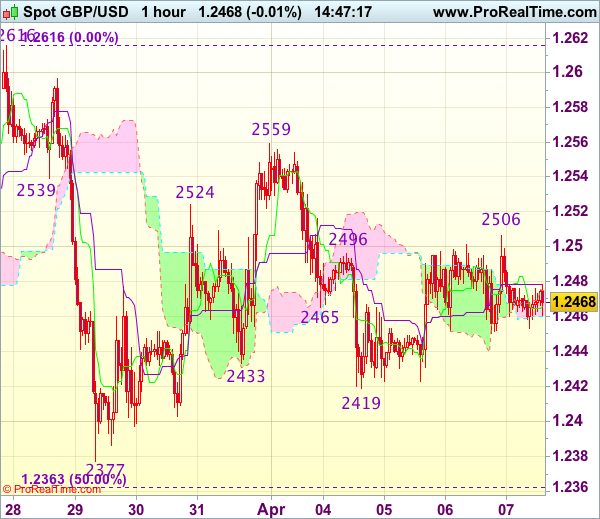
Cable accelerated lower in early Friday following repeated upside rejection at daily Tenkan-sen barrier (1.2494) and broke below hourly cloud, generating negative signal.
Subsequent easing made Thursday's trading ending in red and fresh weakness on Friday, keeping near-term action under pressure.
The pair is holding between 100SMA (1.2414) and Tenkan-sen (currently at 1.2484) and break of either side is needed for clearer direction signals.
Daily technicals are bullishly aligned and expected to support for fresh upside attempts while 100SMA stays intact. The notion is supported by formation of 20/100SMA bull-cross).
Bullish scenario also requires sustained break above daily Tenkan-sen for another bullish signal.
On the other side, narrowing daily cloud is signaling risk of further easing.
Immediate focus is on speech of BOE's Governor Carney, which could drag sterling lower, if dovish tone will prevail in his speech.
Stronger downside risk to be expected on violation of 1.2414/00 (100SMA / 30 May low).
US jobs data are also eyed for stronger signals.
Res: 1.2476, 1.2484, 1.2504, 1.2529
Sup: 1.2438, 1.2414, 1.2400, 1.2360
Technical Outlook: EURUSD – 100SMA Is Holding But Bias Remains Bearish, US NFP Data In Focus
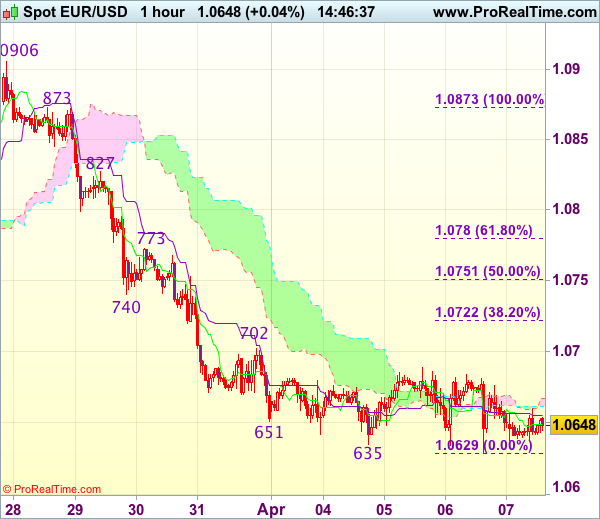
The Euro is still holding above strong 100SMA support (1.0622) but bias is bearish after yesterday's eventual close below 1.0650 (Fibo 61.8% of 1.0493/1.0905 ascend) that generated bearish signal.
The pair is trading within narrow range in early Friday (1.0636/58) ahead of US NFP data (176K f/c vs 235K in Feb) which is expected to signal fresh direction.
Near-term studies are firmly bearish, while dailies give mixed signals.
Pivotal generated bearish signal. points lay at 1.0622/11 (100SMA/daily cloud top) at the downside and 1.0700 (daily Kijun-sen) at the upside and sustained break on either side will give firmer direction signals.
Res: 1.0658, 1.0687, 1.0700, 1.0733
Sup: 1.0627, 1.0622, 1.0611, 1.0583
USD/CAD Candlesticks and Ichimoku Analysis
Weekly
• Last Candlesticks pattern: Bullish engulfing
• Time of formation: 02 May 2016
• Trend bias: Up
Daily
• Last Candlesticks pattern: Hammer
• Time of formation: 19 Oct 2016
• Trend bias: Up
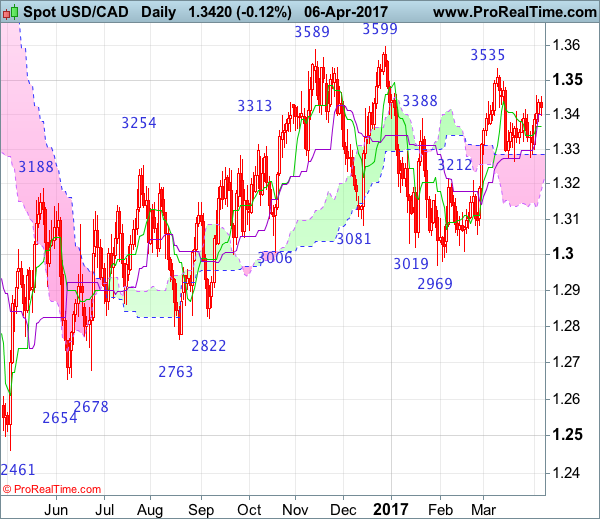
USD/CAD – 1.3395
Although the greenback jumped to 1.3456 earlier this week, lack of follow through buying and the subsequent retreat suggest further consolidation would be seen and pullback to the Tenkan-Sen (now at 1.3367) is likely, however, reckon downside would be limited to 1.3300-10 and support at 1.3264-77 should remain intact and bring further choppy trading later. A daily close below support at 1.3264-77 would revive bearishness and signal another leg of decline from 1.3535 is underway for weakness to 1.3200, then 1.3160-65 but reckon downside would be limited to 1.3100 and price should stay well above support at 1.3056, bring rebound later. Only a drop below this level would retain bearishness and signal the rebound from 1.2969 has indeed ended, bring further fall to 1.3000 first, however, said support at 1.2969 should remain intact.
On the upside, above said resistance at 1.3456 would extend the rebound from 1.3264 to 1.3500, break there would suggest the pullback from 1.3535 top has ended and bring retest of said resistance at 1.3535 which is likely to hold on first testing. Looking ahead, only a break of this level would retain bullishness and extend early erratic upmove from 1.2461 low to 1.3599, then 1.3660-70 but still reckon upside would be limited to 1.3700 and risk from there is seen for a retreat later.
Recommendation: Stand aside for this week.
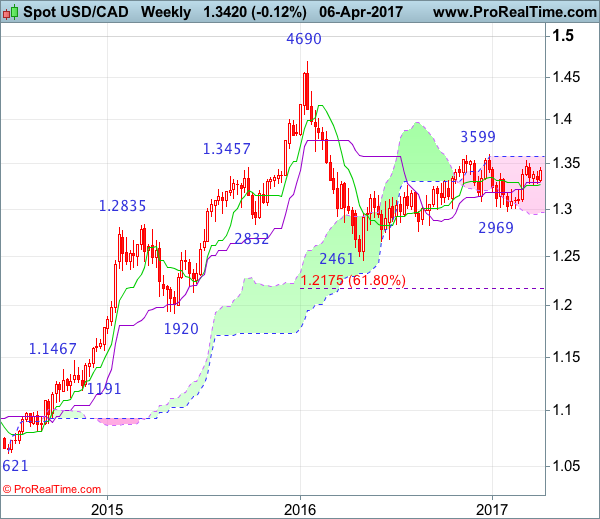
On the weekly chart, as the greenback has rebounded after holding above support at 1.3264 and consolidation with mild upside bias is seen for gain to 1.3455-60, above there would suggest the pullback from 1.3535 has ended, bring retest of this level. A break above there would extend recent rise from 1.2969 to indicated resistance at 1.3599, however, a break of this resistance is needed to retain bullishness and signal upmove from 1.2461 (2016 low) has resumed for headway to 1.3700 and later towards 1.3835-40 (61.8% Fibonacci retracement of 1.4690-1.2461) which is likely to cap upside.
On the downside, expect pullback to be limited to 1.3310-15 and support at 1.3264-77 should remain intact, bring another rebound later. A weekly close below the Tenkan-Sen (now at 1.3271) would signal top has been formed at 1.3535 and test of previous resistance at 1.3210 would follow, however, break there is needed to add credence to this view, bring further fall to 1.3150-60, break there would signal the rebound from 1.2969 has ended, bring subsequent decline towards 1.3083 but indicated support at 1.3056 should hold from here, risk from there has increased for a rebound later.
Forex Technical Analysis: EUR/USD, USD/JPY, GBP/USD
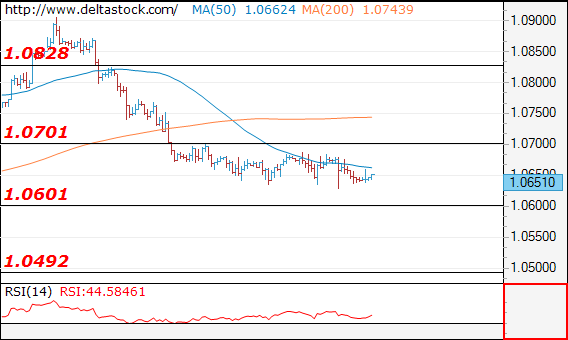
EUR/USD
Current level - 10651
The prolonged consolidation pattern below 1.0700 should be considered a prelude to another sell-off, through 1.0600 support, towards 1.0490 mark. Key resistance lies at 1.0700.
| Resistance | Support | ||
| intraday | intraweek | intraday | intraweek |
| 1.0700 | 1.0904 | 1.0600 | 1.0600 |
| 1.0828 | 1.1010 | 1.0490 | 1.0490 |
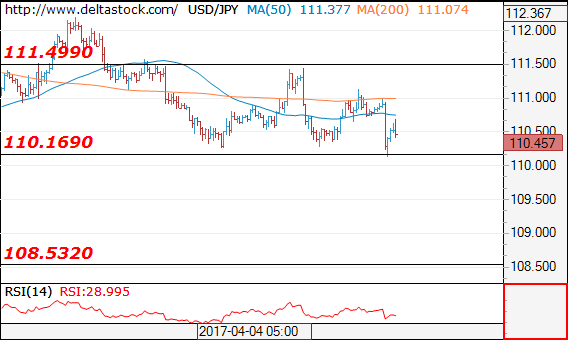
USD/JPY
Current level - 110.45
My outlook here remains bearish, for a break through 110.16 low, towards 108.50 area. Key resistance is projected at 111.45
| Resistance | Support | ||
| intraday | intraweek | intraday | intraweek |
| 111.45 | 113.50 | 110.16 | 109.75 |
| 112.26 | 115.65 | 108.50 | 107.80 |
GBP/USD
Current level - 1.2472
The intraday bias is rather neutral within the tight consolidation range, so my outlook here is neutral.
| Resistance | Support | ||
| intraday | intraweek | intraday | intraweek |
| 1.2550 | 1.2620 | 1.2375 | 1.2230 |
| 1.2620 | 1.2705 | 1.2235 | 1.2107 |
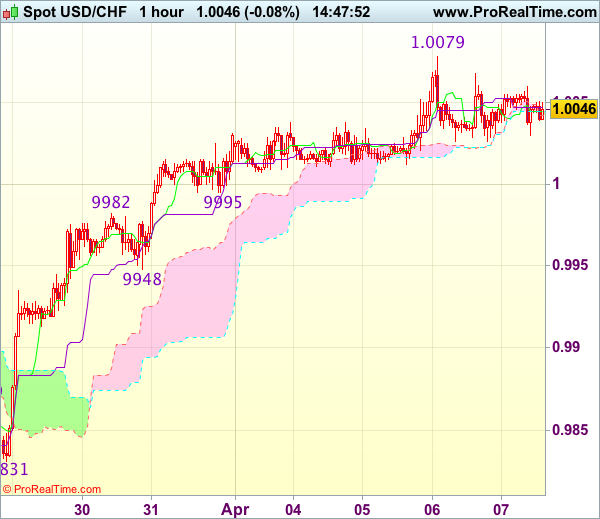
Trade Idea : USD/CHF – Buy at 0.9950
USD/CHF - 1.0050
Most recent candlesticks pattern : N/A
Trend : Near term up
Tenkan-Sen level : 1.0045
Kijun-Sen level : 1.0047
Ichimoku cloud top : 1.0045
Ichimoku cloud bottom : 1.0042
Original strategy :
Buy at 0.9950, Target: 1.0050, Stop: 0.9915
Position : -
Target : -
Stop : -
New strategy :
Buy at 0.9950, Target: 1.0050, Stop: 0.9915
Position : -
Target : -
Stop : -
The greenback remained confined within near term established range and further sideways trading is in store before recent rise from last week’s low at 0.9813 resumes, above resistance at 1.0079 would extend further gain to previous resistance at 1.0109, however, loss of upward momentum should prevent sharp move beyond latter level and reckon 1.0140-50 would hold, risk from there has increased for a retreat to take place later.
In view of this, would not chase this rise here and would be prudent to buy dollar on pullback as support at 0.9948 should limit downside. Below 0.9925-30 would abort and signal top is formed instead, bring correction to 0.9905-10 but reckon previous resistance at 0.9869 would hold from here.
Currencies: Will Payrolls Be Strong Enough To Restore A Better USD Bid?
Sunrise Market Commentary
Rates: Risk off after US attack; focus on payrolls now
US Treasuries spiked higher overnight after the US conducted missile strikes against Syria, retaliating the gas attack earlier this week. The US 10-yr yield tested key 2.3% support, but a break didn't occur. Today's attention turns to the US payrolls report. With risks slightly on the upside of expectations, 2.3% should become even stronger support.
Currencies: Will payrolls be strong enough to restore a better USD bid?
The dollar stabilized yesterday after Wednesday's post-Minutes correction. Overnight, USD/JPY revisited the recent lows on headlines of the US strike against Syria, but no break occurred. Later today, the focus for USD trading will be on the US payrolls. Of late, the dollar gradually lost interest rate support. Will the payrolls be strong enough to reverse this trend?
The Sunrise Headlines
- US equities ended a dull trading session with small gains. Risk sentiment deteriorated after the US conducted missile strikes against Syria. Most Asian equity indices lose around 0.3% with Japan and China outperforming.
- The US military launched nearly 60 Tomahawk cruise missiles against a Syrian air base this morning, responding to mounting calls for a display of force in the wake of this week's suspected chemical-weapons attack in Syria.
- Under rules passed by the US Senate, lawmakers in the minority party will no longer be able to block presidential appointments to the Supreme Court a move so extreme it had been known as “the nuclear option”.
- Overtime pay in Japan, a barometer of strength in corporate activity, edged up in February for the first time in nine months, while real wages remained flat, government data showed on Friday
- The ECB has proposed that large branches of foreign banks in the EU be subject to tighter regulation and capital requirements, a move that would increase US and Asian lenders' costs and also hit British banks after Brexit.
- ECB President Draghi yesterday looked to dull speculation that the ECB will halt its negative rate experiment later this year. In a press conference later in the day, ECB VP Constâncio said that Draghi has “a lot of support” for his stance
- Today's eco calendar contains US payrolls and UK industrial production data. Euro-area finance ministers will try to break a months-long deadlock over Greece's bailout in Malta. BoE Carney is scheduled to speak
Currencies: Will Payrolls Be Strong Enough To Restore A Better USD Bid?
USD going nowhere ahead of the payrolls
The dollar regained slightly ground against the euro and the yen yesterday after Wednesday's soft market reaction to the March Fed Minutes. EUR/USD dropped briefly on soft Draghi comments early in Europe, but the pair soon returned to wait-and-see modus ahead of today's US payrolls. The pair closed the session at 1.0644 (from 1.0663). USD/JPY reversed early losses to finish the session at 110.81 (from 110.70).
Overnight, Asian markets were hit by a (temporary?) risk-off reaction as the US executed a missile strike against Syria in response to the use of chemical weapons. Markets followed the ‘standard risk-off procedure'. Equities and US bond yields declined. The yen rebounded. The oil price jumped also higher as markets feared more instability in the region. However, the reaction was limited and an important part of the moves is already reversed at the time of writing. Several Asian equity markets including Japan returned already in positive territory. USD/JPY dropped close to the recent low in the low 110 area, but the test was again rejected (currently 110.60). The moves in EUR/USD were very limited. The pair is holding a narrow range in the mid 1.06 area.
Today, there are plenty of second tier eco data. However, except for the fall-out from the Syria strike, focus of (FX) trading will be on the US payrolls. Payrolls started 2017 on a strong footing (238K and 235K in January and February). We expect an ongoing healthy labour market in March, but somewhat less buoyant. The market expects a 180K net job gains. Other labour market indicators gave some mixed signals of late. Still, we put the risk somewhat to the upside of expectations with the 6m and 12m average of 195K as our guesstimate. The unemployment rate might have stabilized at 4.7%, while we hope to see earnings to have stabilized at 2.8% Y/Y (consensus 2.7% Y/Y).
Of late, US bond yields drifted back to key support levels and this also weighed on the dollar. Our base scenario of in-line to slightly better than expected payrolls, should be good enough to prevent a sustained break lower of US yields and of the dollar. USD/JPY remains vulnerable to a downside test in case of a weak payrolls report. However, as we don't expect a sustained decline of US yields beyond key support levels(10-j < 2.30%), a real USD sell-off is unlikely. EUR/USD didn't show clear dynamics this week. We expect the topside to be rather well protected, even in case of a soft payrolls report
Last week, the dollar decline slowed, but the subsequent rebound had no strong legs as US yields remain relatively low near key support levels. The Fed Minutes didn't help the dollar even as the Fed confirmed its intention to continue policy normalization. The (FX) market apparently anticipates that reducing the balance sheet might slow the pace of Fed rate hikes. Both measures could go hand in hand if the US economy remains on track. In any case, further down the road, US monetary policy conditions will most likely be tightened which should be USD supportive.
From a technical point of view, USD/JPY last week failed to regain the 111.36/60 previous range bottom. A decline below 110 would signal more trouble ahead. We remain cautious on USD/JPY ST and first want a clear sign that a solid bottom is in place. EUR/USD extensively tested the topside of the MT range, but the test was rejected last week. The 1.0874/1.0906 area now looks a solid resistance. EUR/USD might return lower in the previous 1.0875/1.05 trading range.
EUR/USD: perfectly calm going into the US payrolls release
EUR/GBP
Sterling stays in consolidation modus
Yesterday, sterling was driven by non-UK factors and technical considerations. EUR/GBP spiked briefly lower to the 0.8510/15 area on the Draghi headlines early in the European trading. As was the case for EUR/USD, the decline was almost immediately reversed. EUR/GBP hold a tight range in the mid 0.85 area further out (close at 0.8537 from 0.08542). Cable finished sideways at 1.2470.
Today, the UK calendar is well filled with The Halifax House prices, the production and the trade balance data. The production is expected to rebound after a poor reading in January. The trade deficit is expected more or less stable after a tentative better performance of the previous months. A further narrowing of the trade deficit might be slightly sterling supportive. BoE governor Carney will speak in London. If he says anything on the economy or on monetary policy we expect him to stress the uncertainty of the Brexit process and avoid any signal about policy tightening. Mid-March, sterling found a better bid after higher than expected UK inflation and a more hawkish tone from the BoE. We changed our short-term bias on EUR/GBP from positive to neutral. The EUR/GBP 0.88/0.84 range should guide trading for now. Since late last week, the sterling rally/shortsqueeze shows tentative signs of running into resistance, but we see no trigger for a real change in sentiment yet. Longer term, Brexit-complications remain a potential negative for sterling. We are not convinced that the BoE will raise rates anytime soon, even not after recent higher inflation data.
EUR/GBP sterling short-squeeze is easing, but no sustained sterling correction yet
Trade Idea : GBP/USD – Stand aside
GBP/USD - 1.2465
Most recent candlesticks pattern : N/A
Trend : Near term down
Tenkan-Sen level : 1.2466
Kijun-Sen level : 1.2478
Ichimoku cloud top : 1.2475
Ichimoku cloud bottom : 1.2460
New strategy :
Stand aside
Position : -
Target : -
Stop : -
Although the British pound rebounded yesterday after finding support at 1.2450 and further consolidation above this level would be seen and upside risk remains for recovery to 1.2500-05 and possibly towards 1.2520-25, however, as broad outlook remains consolidative, reckon upside would be limited and price should falter below resistance at 1.2559, bring retreat later.
As near term outlook is still mixed, would be prudent to stand aside in the meantime. Below said support at 1.2450 would revive bearishness and bring weakness to indicated support at 1.2419, break there would bring test of 1.2400 but below there is needed to add credence to our view that the rebound from 1.2377 has ended at 1.2559, bring further fall towards support at 1.2377.
Trade Idea : EUR/USD – Sell at 1.0725
EUR/USD - 1.0650
Most recent candlesticks pattern : N/A
Trend : Near term down
Tenkan-Sen level : 1.0649
Kijun-Sen level : 1.0655
Ichimoku cloud top : 1.0667
Ichimoku cloud bottom : 1.0662
Original strategy :
Sell at 1.0725, Target: 1.0610, Stop: 1.0760
Position : -
Target : -
Stop : -
New strategy :
Sell at 1.0725, Target: 1.0610, Stop: 1.0760
Position : -
Target : -
Stop : -
As the single currency has remained weak after recent selloff, bearishness remains for the decline from 1.0906 to extend further weakness to 1.0620, then test of previous chart support at 1.0600, however, a sustained breach below the latter level is needed to retain downside bias for subsequent selloff to 1.0570-75 first.
In view of this, would not chase this fall here and would be prudent to sell dollar on recovery as 1.0720-30 should limit upside. Only a firm break above resistance at 1.0773 would suggest low is formed instead, bring a stronger rebound to 1.0800 but resistance at 1.0827 should remain intact.
Daily Technical Analysis: US Dollar Builds Consolidation Zone Prior To NFP
Currency pair EUR/USD
The US Dollar (USD) is building a consolidation zone before the important Non-Farm Payroll (NFP) and unemployment rate data from the United States. The NFP news event could lead to increased volatility during and after event which could potentially break the price range.
The EUR/USD specifically is challenging the support level of the sideways consolidation zone (blue/red). The breakout direction could be critical for the direction of the EUR/USD but be aware of new support (green line) and resistance (Fibonacci levels).
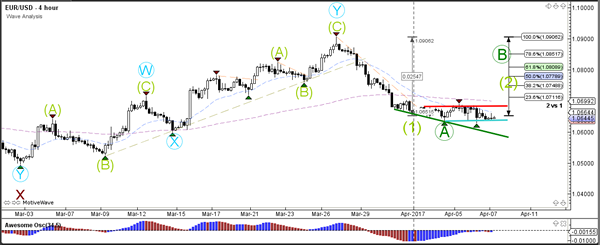
The EUR/USD sideways zone is offering multiple support and resistance trend lines that could play a key role in any breakout or continuation of the consolidation.
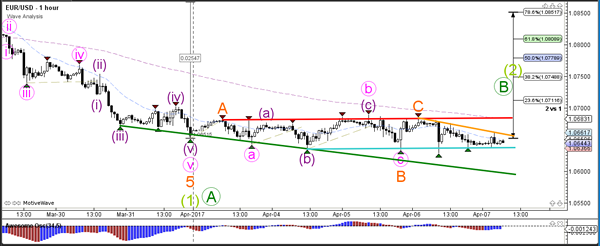
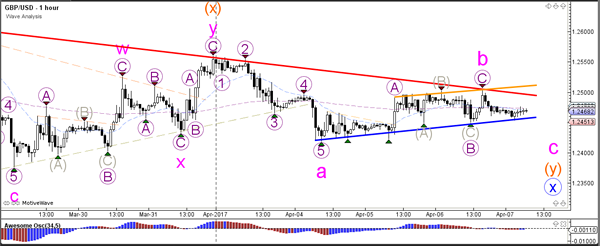
Currency pair GBP/USD
The GBP/USD continues to move within a contracting triangle chart pattern (red/blue lines). A break below support (blue) could see price challenge the 61.8% Fibonacci level of wave X vs W (blue), whereas a break above resistance (red) could see price complete wave E (green) most likely near 1.27.
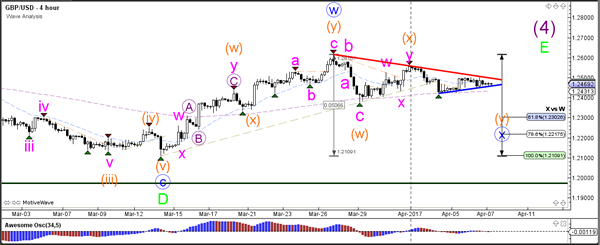
The GBP/USD is also building a shallow angled bullish channel (orange/blue lines). The break of the channel could indicate the new direction the GBP/USD.
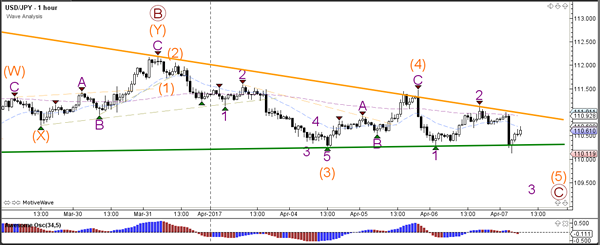
Currency pair USD/JPY
The USD/JPY is building a descending wedge chart pattern (orange/green lines). A break below support (green) could see price challenge the 50% Fibonacci support level of wave 4 vs 3 (purple). A break above resistance (orange) could expand wave B (brown).
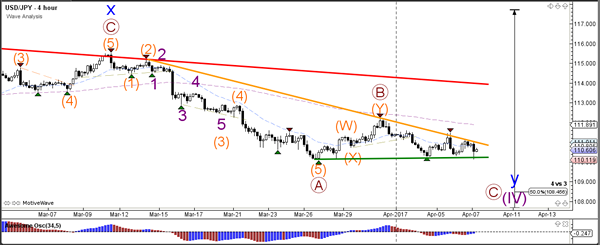
The USD/JPY trend lines could play a critical role in any breakout. The wave count favours a wave 5 (orange) within wave C (purple) at the moment.