
Sample Category Title
Euro Dived on ECB Wake Up Call, More Downside ahead
Euro was sold off broadly last week as the markets got a wake up call regarding expectation on ECB policy path. The common currency topped the top mover chart with EUR/GBP losing -1.96% and EUR/CAD lost -1.81%. Weakness in Euro also dragged down the Swiss Franc as GBP/CHF rose 1.77% while CAD/CHF rose 1.58%. On the other hand, Sterling ended as the strongest major currency last week, after some volatility on UK's trigger of Brexit finally. Yen followed as the second strongest major currency as the recovery in US stocks and yields were disappointing. Meanwhile, Canadian dollar ended as the third major currency as WTI crude oil rebounded and closed above 50 psychological level.
Markets misinterpreted ECB's Hawkish Twist
A Reuters report quoted unnamed sources saying that markets have misinterpreted ECB's hawkish twist during the March meeting. And ECB policy makers would be wary to make any more changes in the April statement. Traders seemed to be back to the "reality" that ECB's asset purchase program will continue at least till the end of the year. And ECB will only raise interest rates after the program ends, even if that means keeping rates negative. Adding to the pressure on Euro, inflation data was rather disappointing. March CPI flash for Eurozone slowed sharply to 1.5% yoy, down from February's 2.0% yoy and missed expectation of 1.8% yoy. Core CPI also deteriorated to 0.7% yoy, down from 0.9% yoy and missed expectation of 0.8% yoy.
Focus turns to French Election
Meanwhile, Euro will now turn to uncertainty of French elections in April. Latest opinion polls showed that the race has tightened in France. First round voting intentions for centrist Emmanuel Macron and anti-Euro Marine Le Pen slipped 1% to 25% and 24% respectively. On the other hand, support for conservative Francois Fillon rose 2% to 19%. 38% of people remained unsure on who they would vote. The first round will be held on April 23 and the run-off on May 7.
Weakness in Euro will likely continue at least in near term with ECB stimulus exit taken off the table. Some volatility could be seen from France elections, but that should be temporary. Revival in Euro, at this point, could only be provided by improvements in economic data, in particular inflation data.
UK triggered Brexit
UK has finally submitted a formal request for exiting European Union, triggering the Article 50 of the Lisbon Treaty. There are two important points to note. Firstly, European Council President Donald Tusk set out the guidelines for Brexit negotiation with UK. The foremost principle is that talks on trade relationship would only start after the enough progress is made on separation. And a final agreement on trade would not be concluded before Brexit. This is in the opposite to UK Prime Minister Theresa May's parallel approach.
Meanwhile, Tusk also mentioned four issues for the first phase of the negotiation. Those include protecting rights of EU citizens in UK and UK citizens in EU; the bill for Brexit based on financial commitments and liabilities; clear legal framework to avoid uncertainties for businesses and institutions; how to maintain a "soft" border between Ireland and Northern Ireland. Tusk also said that EU would "firmly stand by" the proposals while "the talks which are about to start will be difficult, complex and sometimes even confrontational."
But markets looking through Brexit
Sterling's strength last week is a reflection that markets are looking past the "noises" of Brexit. Indeed, the focus is on economic and BoE outlook. Traders should be reminded that in the March BoE meeting, Kristin Forbes voted in favor of a 25 bps rate hike, indicating that policy makers could be getting more impatient on inflation. UK CPI has indeed jumped to 2.3% yoy in February, while core CPI rose to 2.0% yoy. The Pound will likely remain resilient until inflation tops.
Two more hikes as Fed's base case
A number of Fed officials spoke last week and generally speaking, the base case of Fed is still three hikes in total this year. And that hasn't taken into account fiscal policies due to uncertainties around. Stocks and yields were paring back prior gains based on expectation of US President Donald Trump's expansive policies. The failure of the health care act raised much doubt on Trump's ability to push through his agendas. Tax reform is now the focus of the markets and stocks would need to have Trump to deliver in the very near term. However, there are already reports on the lack of clear plan and adequate staff in Trump's team on taxes. Hence, that could yet be another disappointment.
For now, Dollar trader will look into economic data to solidify the base case of two more Fed hikes this year. Key data will be released this week including ISM indices and non-farm payroll. Wage growth will stay as a focus for the markets. Fed will also release March meeting minutes but overall, traders will likely stay calm as we don't expect much new information from the minutes.
DJIA recovery disappointing
Technically, the rebound in DJIA last week was mildly disappointing. NASDAQ did surge to record high and stayed firm there. But equivalent strength was not seen in DJIA. DJIA drew support from 55 day EMA last week but upside was limited by 20757.89 near term resistance. Note that rejection from this resistance will very likely drag the index down through 55 day EMA to 38.2% of 17883.56 to 21169.11 at 19914.02 before drawing support from another key level. Meanwhile, a break of 20757.89 will bring a retest of 21169.11. But that doesn't necessarily mean up trend resumption. Rather, that should have just set the range for consolidations.
Same for 10 year yield
The recovery in 10 year yield was also disappointing. Some support was seen ahead of 2.314 support. But TNX was limited firmly by 55 day EMA so far. And the sideway pattern last week argues that fall from 2.615 is not completed. We're holding on to the view that there are two main interpretations of the price actions. Firstly, consolidation from 2.621 is extending with fall from 2.615 as the third leg. Secondly, rise from 2.314 to 2.615 is a failure fifth that ends the whole impulsive rally from 1.336. In both case, further fall should be seen through 2.314. But we'd expect strong support from around 38.2% retracement of 1.336 to 2.621 at 2.130 to contain downside and bring up trend resumption.
Dollar rebound unconvincing
Dollar index's rebound last week does suggest short term bottoming at 98.85. However, firstly, it was mainly driven by weakness in Euro. Secondly, it's held below 55 day EMA so far. Thirdly, it's not accompanied by a surge in yields. Hence, we'll be skeptical on the strength in the greenback. On the upside, sustained trading above 55 day EMA would bring a test on 102.26. And decisive break there will be a strong sign of up trend resumption. However, rejection from 55 day EMA will likely send the index through 98.85. In that case, the correction from 103.82 could only end after testing 50% retracement of 91.91 to 103.82 at 97.86.
To sell AUD/JPY
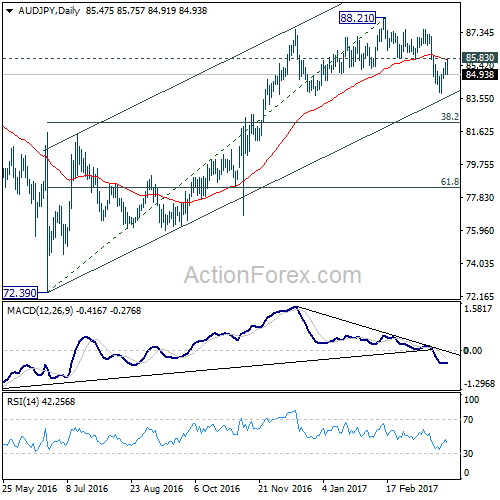
Regarding trading strategy, we tried to sell AUD/JPY last week on recovery to 85.83. The cross first hit 83.81 but quickly recovery to as high as 85.75, before weakening again. That is, our sell order was NOT filled, missing 8 pips! Nonetheless, the rejection from 55 day EMA is consistent with our bearish view. And considering the above bearish outlook in stocks and yields, we'd stay bearish in AUD/JPY too. As the recovery looks over, we'll just sell AUD/JPY at market this week, with a tight stop set at 86.00. Downside target is 38.2% retracement of 72.39 to 88.21 at 82.16.
And sell EUR/GBP
Meanwhile, we're also looking for opportunity to sell Euro. We'd prefer to avoid Dollar as we're not convinced with its strength as mentioned above. EUR/JPY is too close to 118.23/45 key support zone. EUR/GBP and EUR/CAD are two options to consider. Sterling is having a mild upper hand considering GBP/CAD's rebound since early this year. Canadian Dollar is lifted by the rebound in oil price. But current 50 handle overlaps with 55 day EMA (now at 50.70). Hence, we'll choose EUR/GBP as the pair to short. We'll try to sell EUR/GBP on recovery to 0.8550 with stop at 0.8610.
EUR/GBP Weekly Outlook
After recovering to 0.8734, EUR/GBP reversed and dropped sharply to as low as 0.8483 last week. The development argues that consolidation pattern from 08303 is completed with three waves to 0.8786. And larger corrective fall from 0.9304 is resuming for a new low below 0.8303.
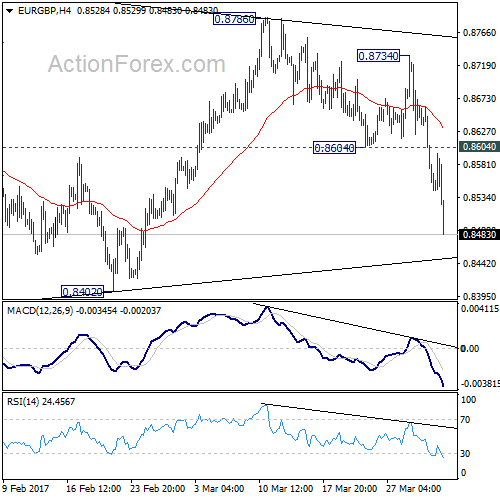
Initial bias in EUR/GBP stays on the downside this week for 0.8402 support. Break will indicate that larger decline from 0.9304 is resuming. In such case, EUR/GBP should target 0.8303 low and below. As fall from 0.8304 is viewed as a corrective move, we'd expect strong support at 0.8116/20 cluster support to contain downside and bring rebound. On the upside, break of 0.8604 support turned resistance is needed to indicate completion of fall from 0.8786. Otherwise, outlook will remain cautiously bearish in case of recovery.
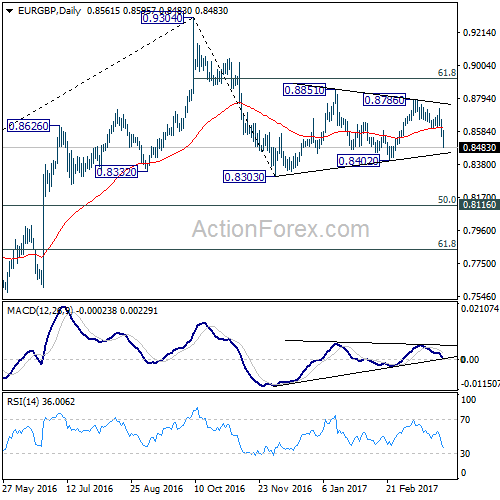
In the bigger picture, price actions from 0.9304 are viewed as a medium term corrective pattern. Such decline is likely ready to resume and should make a new low below 0.8303. At this point, we'd expect strong support from 0.8116 cluster support (50% retracement of 0.6935 to 0.9304 at 0.8120) to contain downside. Break of 0.9304 will pave the way to 0.9799 (2008 high). However, sustained break of 0.8116 could bring deeper decline to next key support level at 0.7564 before the correction completes.
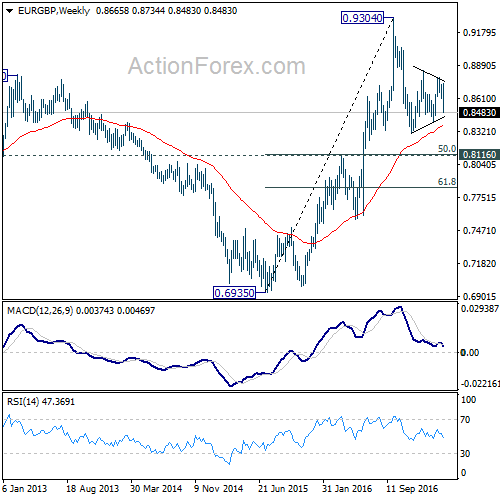
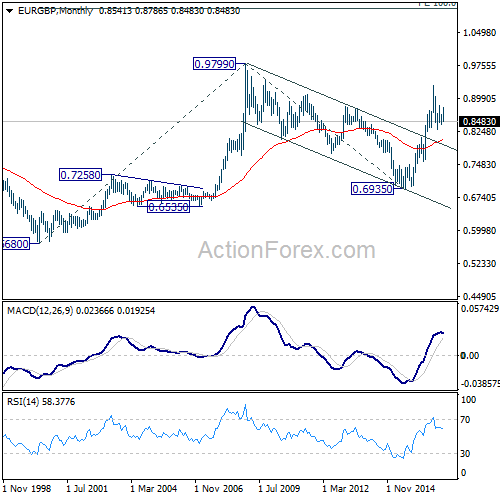
In the long term picture, firstly, price action from 0.9799 is seen as a long term corrective pattern and should have completed at 0.6935. Secondly, rise from 0.6935 is likely resuming up trend from 0.5680 (2000 low). Thirdly, this is supported by the impulsive structure of the rise from 0.6935 to 0.9304. Hence, after the correction from 0.9304 completes, we'd expect another medium term up trend to target 0.9799 high and above.
EUR/USD Weekly Outlook
EUR/USD edged higher to 1.0905 last week but was rejected by 55 week EMA and reversed. The development argues that corrective rise from 1.0339 is completed and larger down trend is ready resume. Firm break of 1.0494 support will affirm this bearish case.
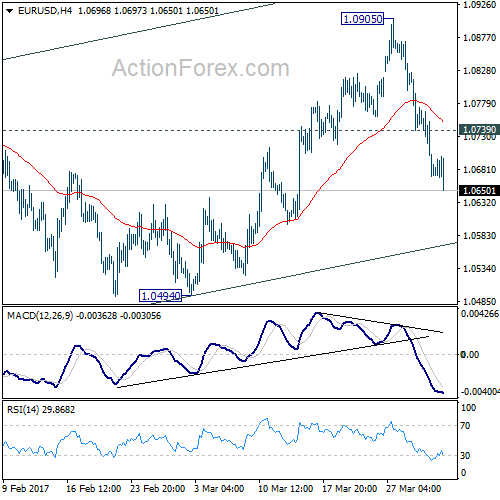
Initial bias in EUR/USD remains on the downside this week for 1.0494 support. Break should confirm completion of the corrective rise from 1.0339. And, larger down trend is likely resuming in this case. Break of 1.0339 will confirm down trend resumption and target parity next. On the upside, above 1.0739 minor resistance will delay the bearish case and turn focus back to 1.0905 resistance instead.
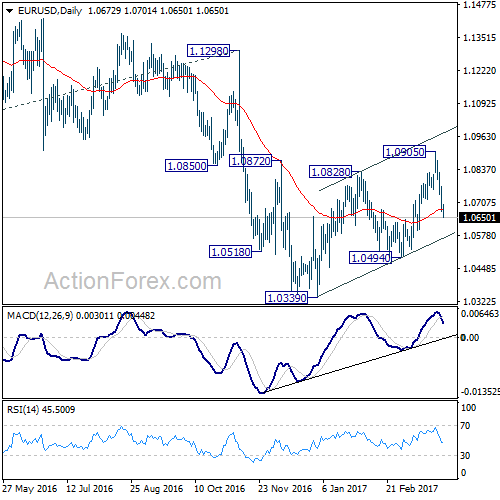
In the bigger picture, as long as 1.1298 key resistance holds, whole down trend from 1.6039 (2008 high) is still expected to continue. Break of 1.0339 low will send EUR/USD through parity to 61.8% projection of 1.3993 to 1.0461 from 1.1298 at 0.9115. However, considering bullish convergence condition in weekly MACD, break of 1.1298 will indicate term reversal. this would also be supported by sustained trading above 55 week EMA.
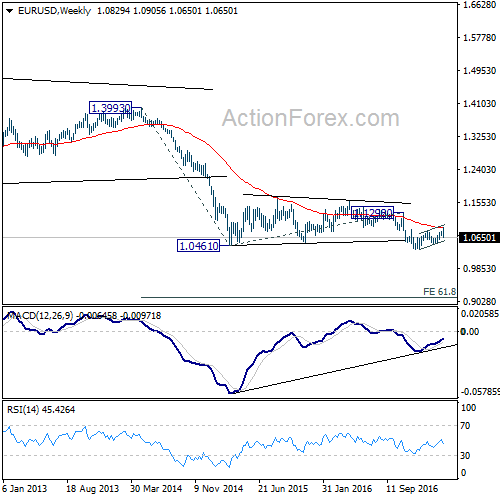
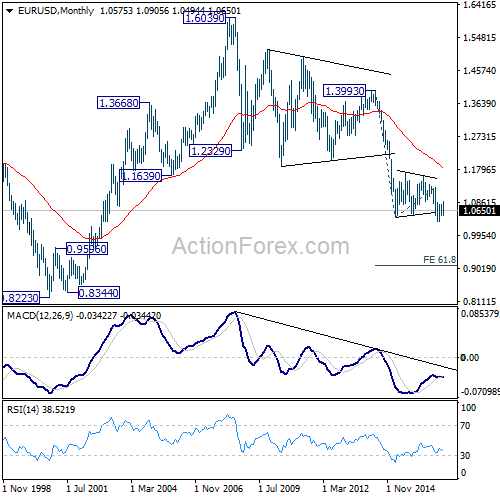
In the long term picture, the down trend from 1.6039 (2008 high) is still in progress and there is no clear sign of completion. We'd expect more downside towards 0.8223 (2000 low) as long as 1.1298 resistance holds. However, firm break of 1.1298 should now confirm long term reversal.
USD/JPY Weekly Outlook
USD/JPY edged lower to 110.10 last week then recovered. Such recovery was relatively weak and was held well below 55 day EMA before losing momentum and retreated. Overall, price actions from 118.65 are seen as a corrective pattern. But there is no confirmation that such correction is finished yet.
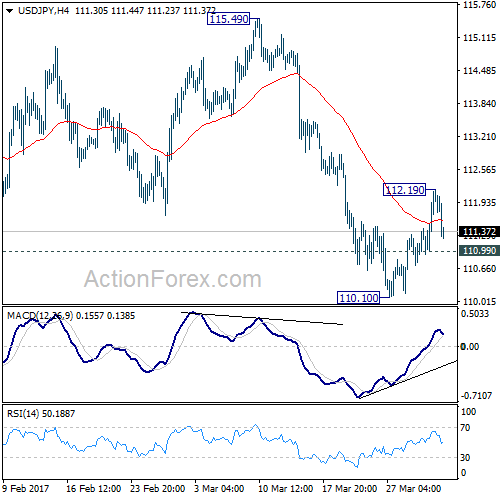
Initial bias in USD/JPY is neutral this week first. On the upside, above 112.19 will turn bias back to the upside. Sustained break of 55 day EMA (now at 112.86) will raise the chance of near term reversal and target 115.49 resistance for confirmation. On the downside, though, below 110.99 minor support will turn bias back to the downside for 110.10 and break will extend the corrective fall from 118.65.
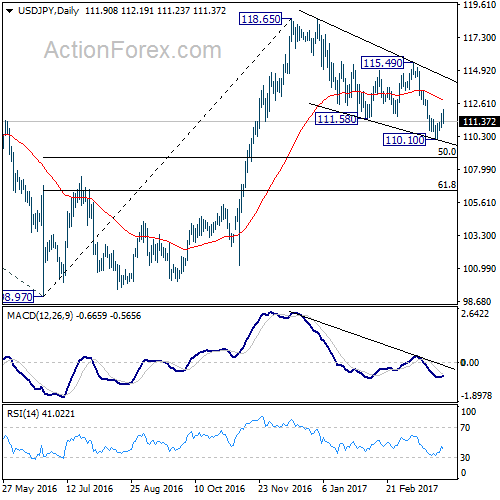
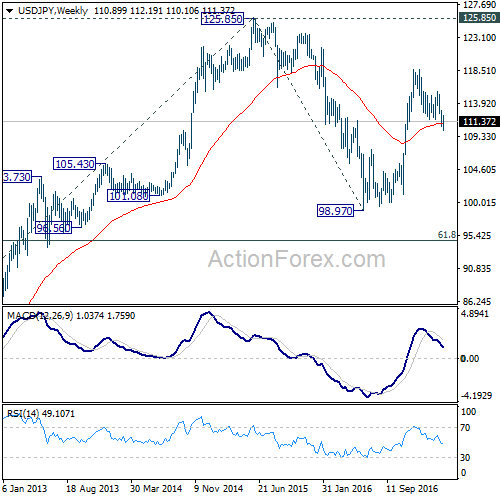
In the bigger picture, price actions from 125.85 high are seen as a corrective pattern. The impulsive structure of the rise from 98.97 suggests that the correction is completed and larger up trend is resuming. Decisive break of 125.85 will confirm and target 61.8% projection of 75.56 to 125.85 from 98.97 at 130.04 and then 135.20 long term resistance. Nonetheless, sustained trading below 55 week EMA (now at 111.08) will extend the consolidation from 125.85 with another fall through 98.97 before completion.
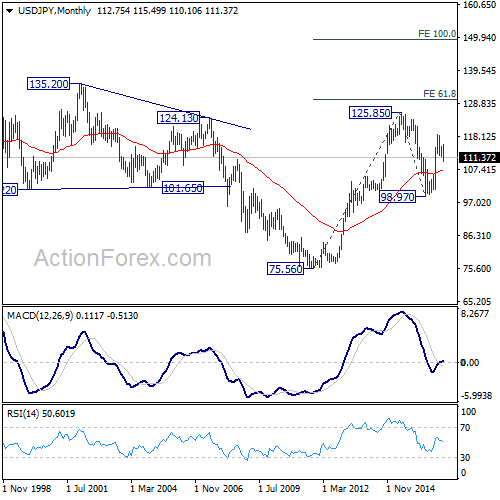
In the long term picture, the rise from 75.56 long term bottom to 125.85 medium term top is viewed as an impulsive move. Price actions from 125.85 are seen as a corrective move which could still extend. But, up trend from 75.56 is expected to resume at a later stage for above 135.20/147.68 resistance zone.
GBP/USD Weekly Outlook
GBP/USD engaged in sideway trading last week without a clear direction. The supported from 55 day EMA favors more upside near term but break of 1.2614 resistance is at least needed to indicate upside momentum. Overall, price actions from 1.1946 are seen as a corrective pattern and could extend for a while.
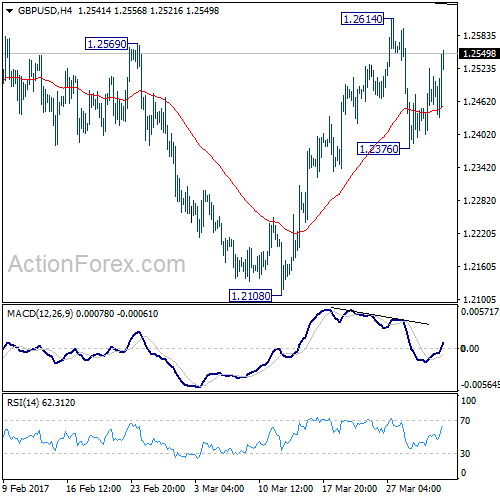
Initial bias in GBP/USD remains neutral this week first. On the upside, break of 1.2614 will extend the rise from 1.2108. Overall, price actions from 1.1946 are viewed as a consolidation pattern pattern. Upside should be limited by 1.2705/2774 resistance zone to bring larger down trend resumption eventually. On the downside, below 1.2376 will target 1.2108 support next. Break there will be an early sign of larger down trend resumption.
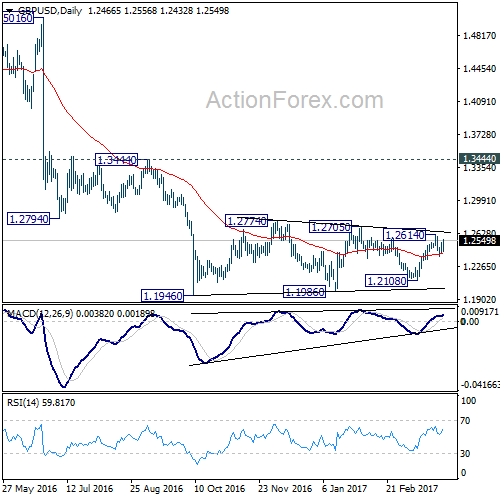
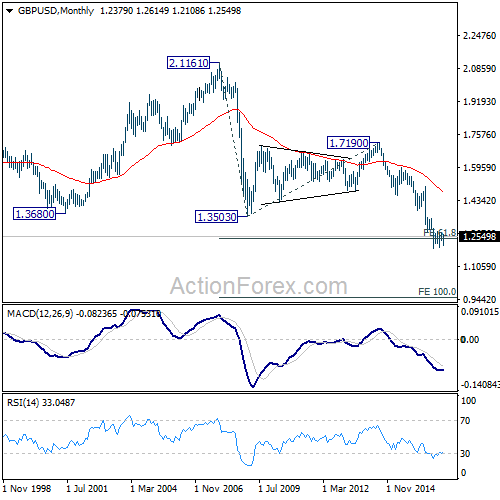
In the bigger picture, fall from 1.7190 is seen as part of the down trend from 2.1161. There is no sign of medium term reversal yet. Sustained trading below 61.8% projection of 2.1161 to 1.3503 from 1.7190 at 1.2457 will target 100% projection at 0.9532. Overall, break of 1.3444 resistance is needed to confirm medium term bottoming. Otherwise, outlook will remain bearish.
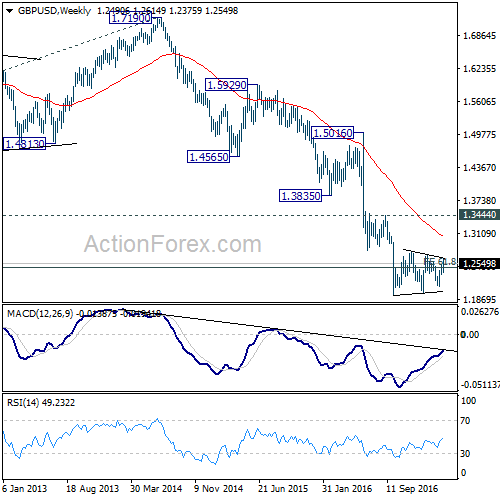
In the longer term picture, no change in the view that down trend from 2.1161 is still in progress. Current momentum suggests that the down trend will go deeper than originally expected to 100% projection of 2.1161 to 1.3503 from 1.7190 at 0.9532.
USD/CHF Weekly Outlook
USD/CHF dipped to 0.9812 last week but rebounded strongly since then. The development indicates short term bottoming at 0.9812. And it's raising the chance that decline from 1.0342 is completed. More upside is expected in near term. The corrective structure of such decline points to underlying bullishness. But strong break of 1.0342 key resistance is still needed to confirm medium term momentum. Otherwise, it's possibly just part of a larger consolidation pattern.
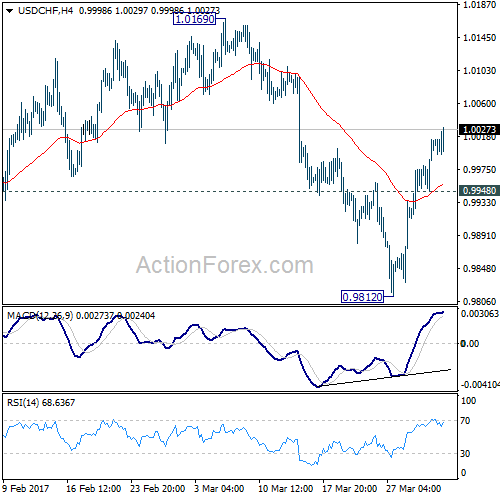
Initial bias in USD/CHF stays on the upside this week. Sustained trading above 55 day EMA (now at 1.0023) will argue that whole decline from 1.0342 has completed. Further rise should then be seen to 1.0169 resistance for confirmation. On the downside, below 0.9948 minor support will turn bias back to the downside for 0.9812 instead.
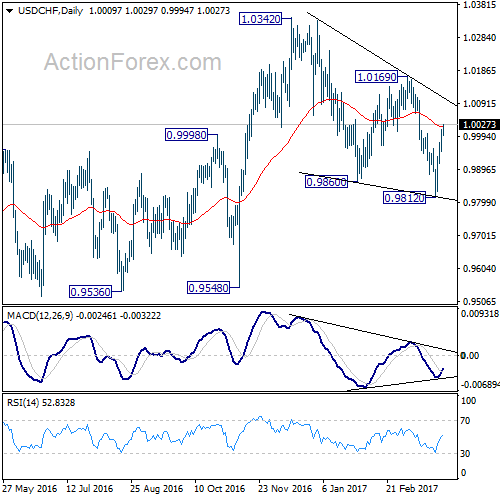
In the bigger picture, USD/CHF is staying in medium term sideway pattern between 0.9443/1.0342. In any case, decisive break of 1.0342 resistance is needed to confirm underlying strength. Otherwise, we'll stay neutral in the pair first. In case of another fall, we'd expect strong support from 0.9443/9548 support zone.
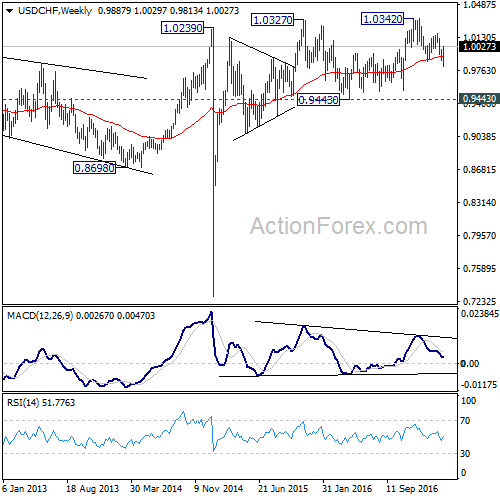
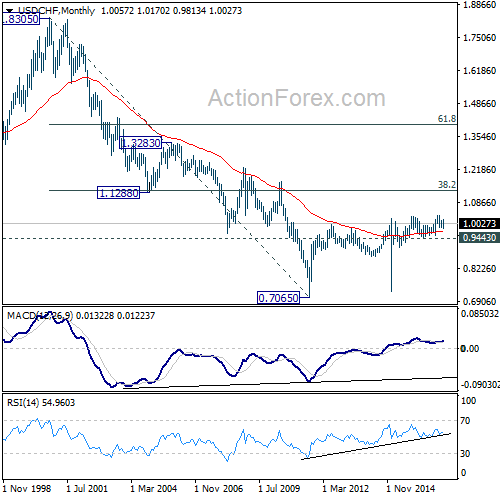
Meanwhile firm break of 1.0342 will target 38.2% retracement of 1.8305 to 0.7065 at 1.1359.
AUD/USD Weekly Outlook
AUD/USD recovered after dipping to 0.7586 and mixed up near term outlook. We'll be neutral for the moment until a break of neither 0.7748 resistance or 0.7490 support.
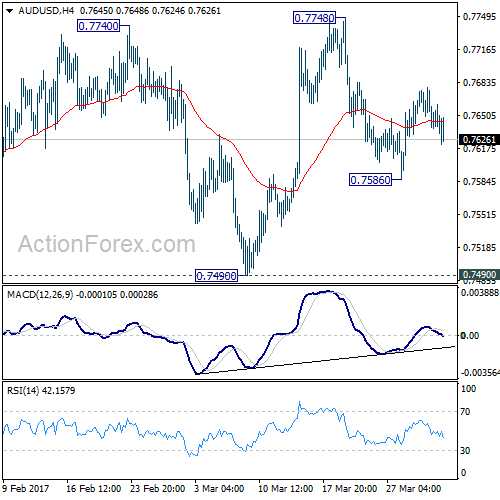
Initial bias in AUD/USD is neutral this week first. On the upside, break of 0.7748 will extend the rally from 0.7158. In that case, we'd expect strong resistance from long term retracement level at 0.7849 to limit upside. On the downside, below 0.7586 will turn bias back to the downside for 0.7490 support. Firm break there will confirm completion of rise from 0.7158. In such case, near term outlook will be turned bearish for 0.7158 support next.
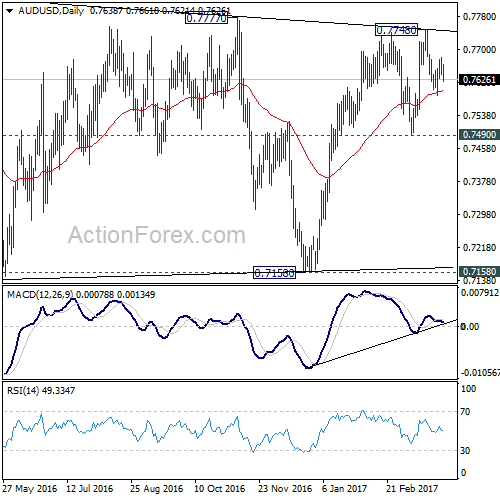
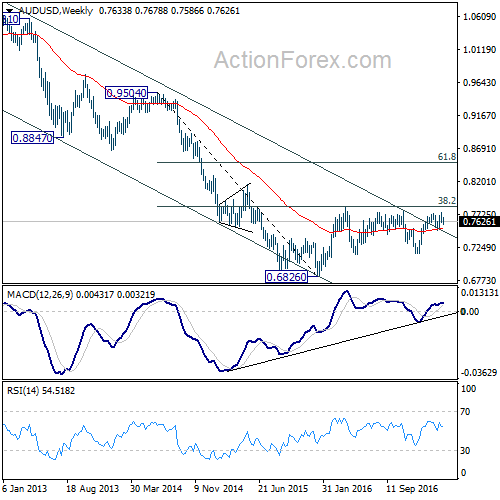
In the bigger picture, we're still treating price actions from 0.6826 low as a correction. And, as long as 38.2% retracement of 0.9504 to 0.6826 at 0.7849 holds, long term down trend from 1.1079 is expected to resume sooner or later. Break of 0.6826 low will target 0.6008 key support level. However, firm break of 0.7849 will indicate that rise from 0.6826 is developing into a medium term rebound, rather than a sideway pattern. In such case, stronger rise should be seen to 55 month EMA (now at 0.8165) and above.
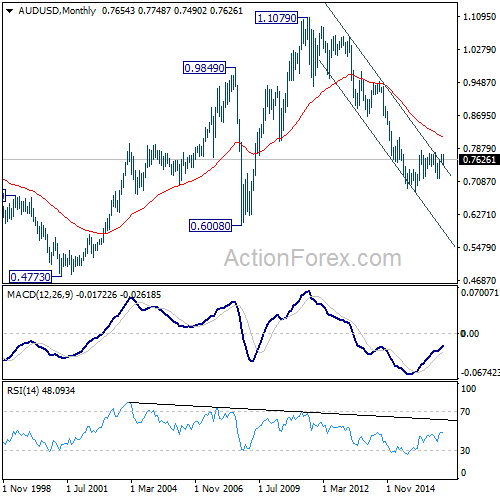
In the longer term picture, while the down trend from 1.1079 might extend lower, we're not anticipating a break of 0.6008 (2008 low) yet. We'll look for bottoming above there to reverse the medium term trend.
USD/CAD Weekly Outlook
USD/CAD weakened mildly last week but recovered ahead of 1.3263 support. The development argues that corrective decline from 1.3534 is noted completed yet. And, another fall could be seen. But in that case, we'd expect strong support from 1.3211/09 to contain downside and bring rise resumption. Overall, whole medium term rise from 1.2460 is expected to resume later through 1.3598 high.
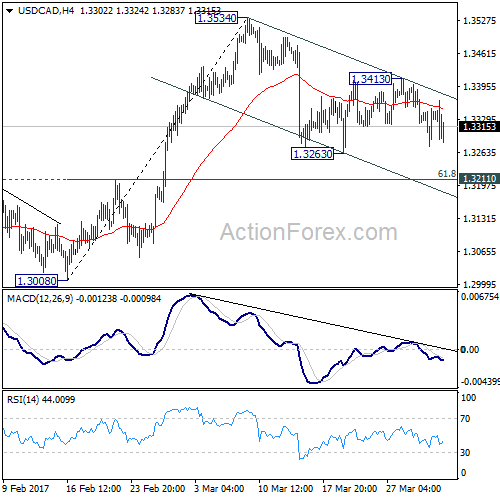
Initial bias stays neutral this week first. On the upside, above 1.3413 minor resistance will turn bias to the upside for 1.3534. Break will target 1.3598 high next. On the downside, below 1.3263 will extend the fall from 1.3534. But in that case, we'd expect strong support from 1.3211 cluster level (61.8% retracement of 1.3008 to 1.3534 at 1.3209) to contain downside and bring rebound.
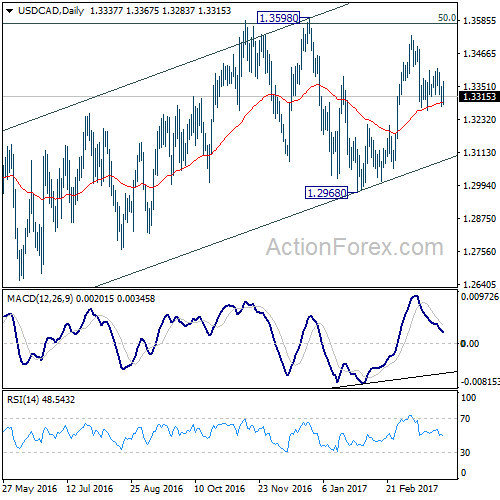
In the bigger picture, price actions from 1.4689 medium term top are seen as a correction pattern. The first leg has completed at 1.2460. The second leg from 1.2460 is likely still in progress and could target 61.8% retracement of 1.4689 to 1.2460 at 1.3838. We'd look for reversal signal there to start the third leg. Break of 1.2968 will argue that the third leg has already started and should at least bring at retest of 1.2460 low. However, sustained trading above 1.3838 would pave the way to retest 1.4689 high.
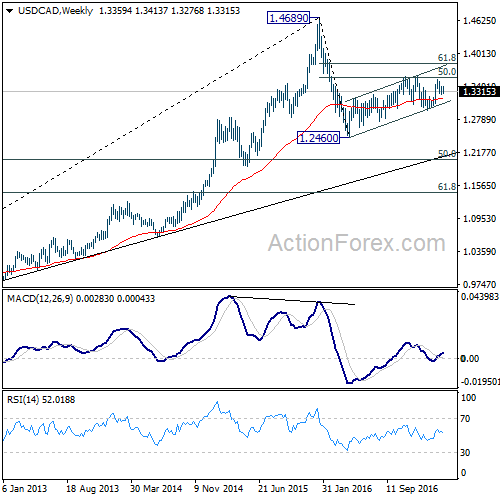
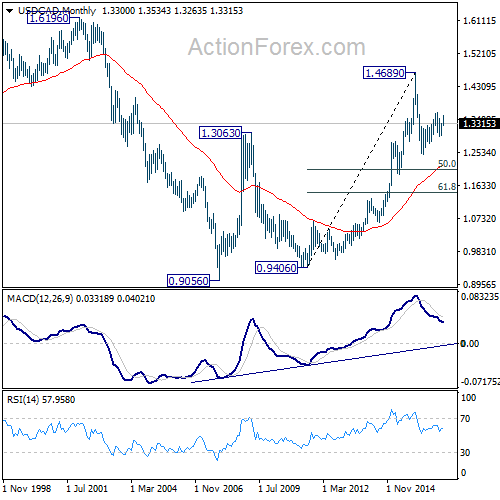
In the longer term picture, rise from 0.9056 (2007 low) is viewed as a long term up trend. It's taking a breath after hitting 1.4689. But such rise expected to resume later to test 1.6196 down the road.
GBP/JPY Weekly Outlook
GBP/JPY edged lower to 137.51 last week but recovered. The development argues that choppy fall from 142.79 is completed already. Further rise is in favor in near term. Meanwhile, there is no change in the overall view that price actions from 148.42 are forming a consolidation pattern.
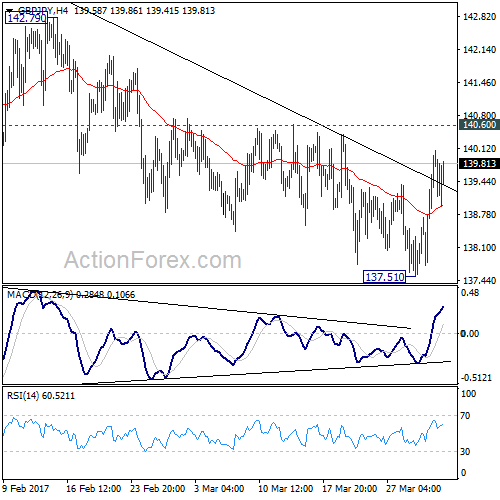
Initial bias in GBP/JPY is mildly on the upside this week. Break of 140.60 resistance should confirm near term reversal and target 142.79 resistance first. Break there will send the cross through 144.77 resistance to 148.42 high. On the downside, below 137.51 minor support will extend the fall from 142.79 towards 136.44 support. But still, we'd expect support from 50% retracement of 122.36 to 148.42 at 135.39 to contain downside and bring rebound.
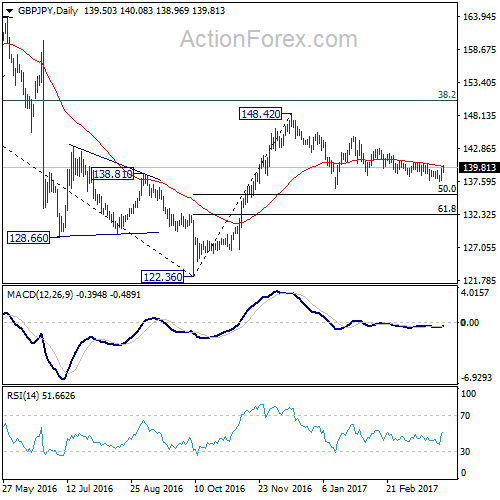
In the bigger picture, price actions from 122.36 medium term bottom are still seen as a corrective pattern. Main focus is on 38.2% retracement of 195.86 to 122.36 at 150.42. Rejection from there will turn the cross into medium term sideway pattern. Or, sustained break of 50% retracement of 122.36 to 148.42 at 135.39 will turn outlook bearish for a test on 122.36 low. Though, sustained break of 150.42 will extend the rebound towards 61.8% retracement of 195.86 to 122.36 at 167.78.
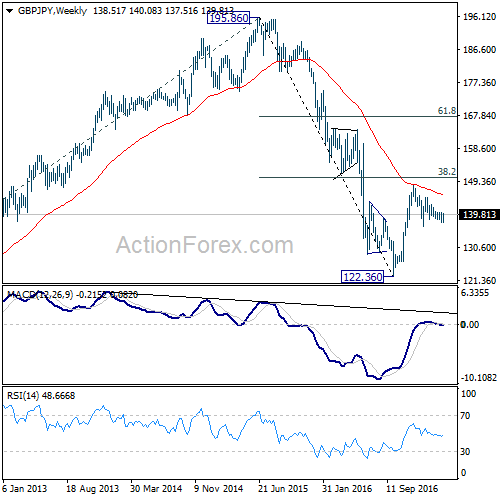
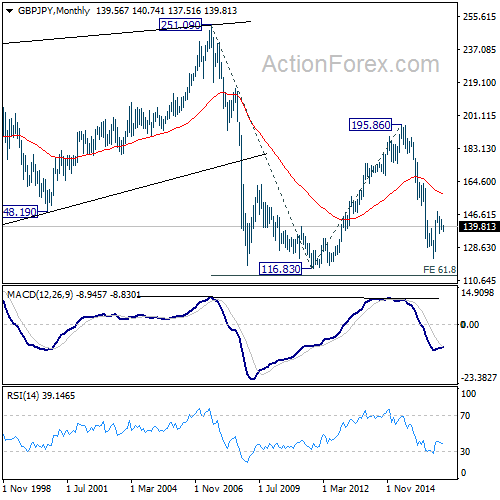
In the longer term picture, while price actions from 122.36 would develop into a medium term correction, fall from 195.86 is still seen as resuming the down trend from 251.09 (2007 high). Hence, after the correction from 122.36 completes we'd expect another fall through 116.83 low.
EUR/JPY Weekly Outlook
EUR/JPY dropped sharply to as low as 118.62 last week as the decline from 122.88 resumed. Further fall is expected but overall, price actions from 124.08 are still viewed as a consolidation pattern. Hence we're expecting strong support from 118.39/45 to contain downside. Medium term rise from 109.20 should extend higher. But sustained break of 118.39/45 will indicate medium term reversal.
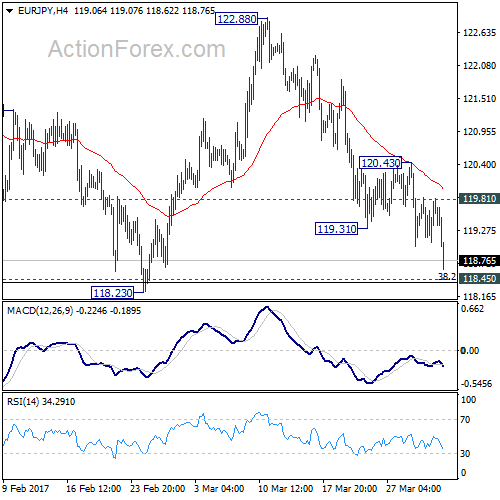
Intraday bias in EUR/JPY stays on the downside this week. At this point, we'd still expect strong support from 118.45 key cluster support level (38.2% retracement of 109.20 to 124.08 at 118.39) to contain downside and bring rebound. On the upside, break of 119.81 resistance will indicate short term bottoming. In such case, intraday bias will be turned back to the upside for 120.43 resistance first. However, sustained trading below 118.39/45 will invalidate our view and bring deeper fall.
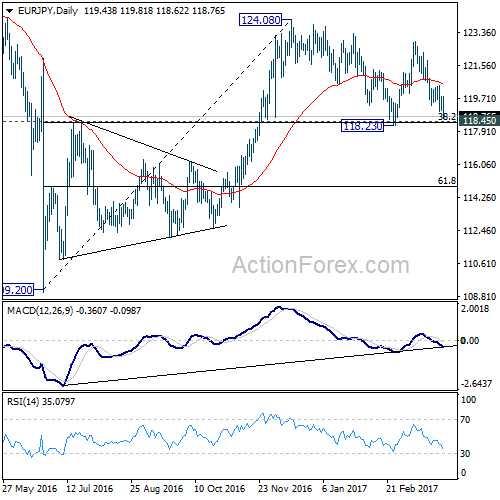
In the bigger picture, we're holding on to the view that medium term rise from 109.20 is still in progress. Focus is on 126.09 key resistance level. Sustained break will confirm completion of the whole decline from 149.76. And rise from 109.20 is of the same degree as the fall from 149.76. In such case, further rally would be seen to 104.04 resistance and possibly above before topping. Meanwhile, rejection from 126.09, or firm break of 118.45 cluster support, will likely extend the fall from 149.76 through 109.20 low.
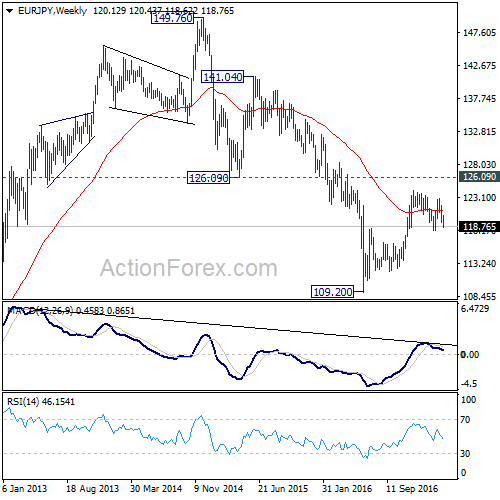
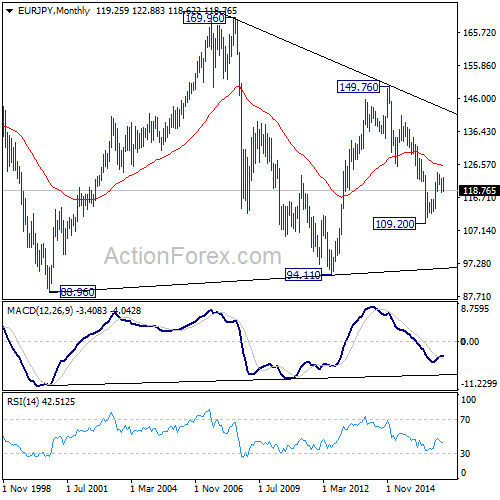
In the long term picture, medium term decline from 149.76 is seen as part of a long term sideway pattern from 88.96. Decisive break of 126.09 will indicate that such decline is completed and EUR/JPY has started another medium term rally already. Before that, deeper fall is mildly in favor towards 94.11 low. Overall, long term rang trading will continue.
EUR/GBP Weekly Outlook
After recovering to 0.8734, EUR/GBP reversed and dropped sharply to as low as 0.8483 last week. The development argues that consolidation pattern from 08303 is completed with three waves to 0.8786. And larger corrective fall from 0.9304 is resuming for a new low below 0.8303.
Initial bias in EUR/GBP stays on the downside this week for 0.8402 support. Break will indicate that larger decline from 0.9304 is resuming. In such case, EUR/GBP should target 0.8303 low and below. As fall from 0.9304 is viewed as a corrective move, we'd expect strong support at 0.8116/20 cluster support to contain downside and bring rebound. On the upside, break of 0.8604 support turned resistance is needed to indicate completion of fall from 0.8786. Otherwise, outlook will remain cautiously bearish in case of recovery.
In the bigger picture, price actions from 0.9304 are viewed as a medium term corrective pattern. Such decline is likely ready to resume and should make a new low below 0.8303. At this point, we'd expect strong support from 0.8116 cluster support (50% retracement of 0.6935 to 0.9304 at 0.8120) to contain downside. Break of 0.9304 will pave the way to 0.9799 (2008 high). However, sustained break of 0.8116 could bring deeper decline to next key support level at 0.7564 before the correction completes.
In the long term picture, firstly, price action from 0.9799 is seen as a long term corrective pattern and should have completed at 0.6935. Secondly, rise from 0.6935 is likely resuming up trend from 0.5680 (2000 low). Thirdly, this is supported by the impulsive structure of the rise from 0.6935 to 0.9304. Hence, after the correction from 0.9304 completes, we'd expect another medium term up trend to target 0.9799 high and above.