
Sample Category Title
Trade Idea : USD/JPY – Stand aside
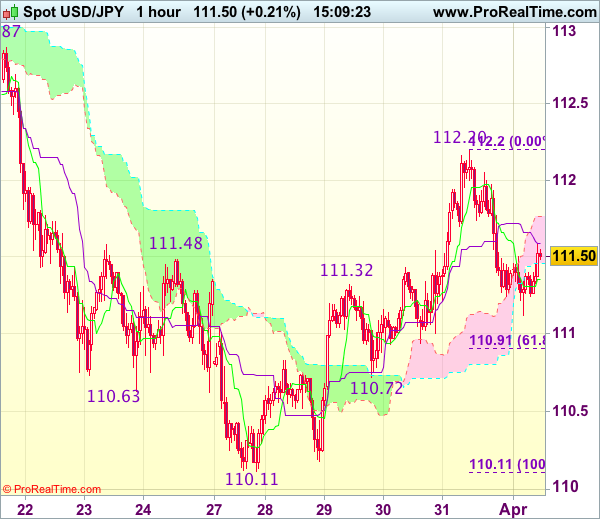
USD/JPY - 111.47
Most recent candlesticks pattern : N/A
Trend : Near term up
Tenkan-Sen level : 111.36
Kijun-Sen level : 111.59
Ichimoku cloud top : 111.76
Ichimoku cloud bottom : 111.46
New strategy :
Stand aside
Position : -
Target : -
Stop : -
Dollar’s retreat after last week’s strong rebound to 112.20 suggests top has possibly been formed there and consolidation with mild downside bias is seen for weakness to 110.91-94 (61.8% Fibonacci retracement of 110.11-112.20 and previous support), however, break there is needed to add credence to this view, bring further fall to support at 110.72, once this level is penetrated, this would signal the rebound from 110.11 has ended and further decline to 110.50 would follow.
In view of this, would not chase this fall here and would be prudent to stand aside in the meantime. Above 111.75-80 would bring recovery to 112.00-05 but price should falter below resistance at 112.20, bring further consolidation. Only break of 112.20 would revive bullishness and extend the rise from 110.11 low to 112.50-55 but price should falter below previous resistance at 112.87-90, bring retreat later.
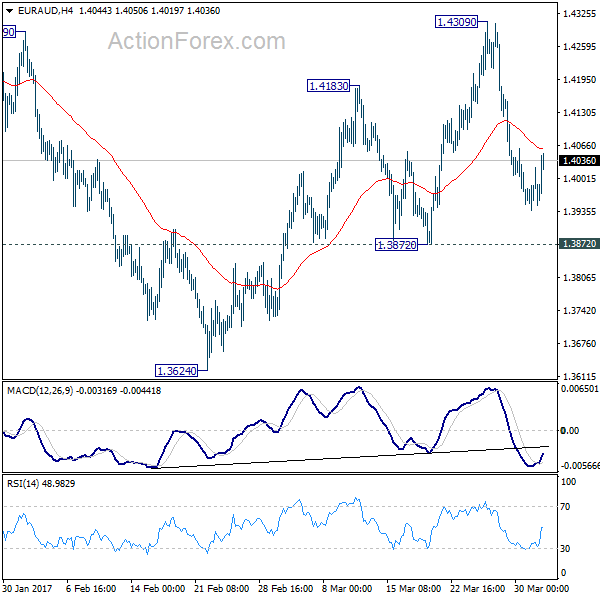
EUR/AUD Daily Outlook
Daily Pivots: (S1) 1.3925; (P) 1.3975; (R1) 1.4009; More...
Intraday bias in EUR/AUD remains neutral for the moment. We're still mildly favoring the case of trend reversal after defending key support level at 1.3671. Another rise is expected as long as 1.3872 minor support holds. Break of 1.4309 will extend the rebound from 1.3624 to 1.4721 key resistance level next. Break should confirm larger trend reversal. However, firm break of 1.3872 support will dampen our bullish view. In such case, intraday bias will be turned back to the downside for 1.3624 low instead.
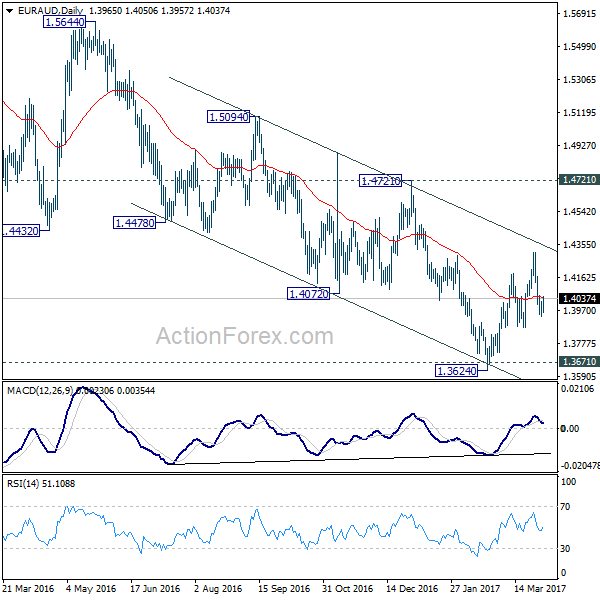
In the bigger picture, price actions from 1.6587 medium term top are viewed as a corrective pattern. Such correction could be completed after testing 1.3671 support. Break of 1.4721 cluster resistance (38.2% retracement of 1.6587 to 1.3624 at 1.4756) should confirm this case and target 61.8% retracement at 1.5455 and above. Overall, we'd expect the up trend from 1.1602 to resume later. However, sustained break of 1.3671 will invalidate our bullish view and would turn extend the fall from 1.6587 towards 1.1602 long term bottom.
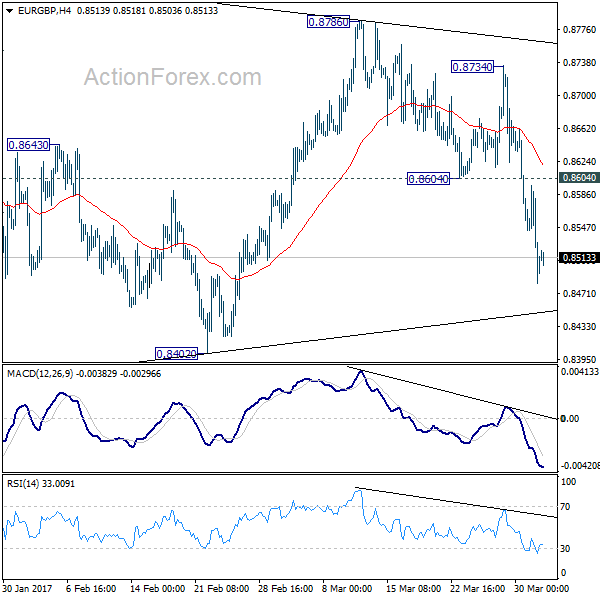
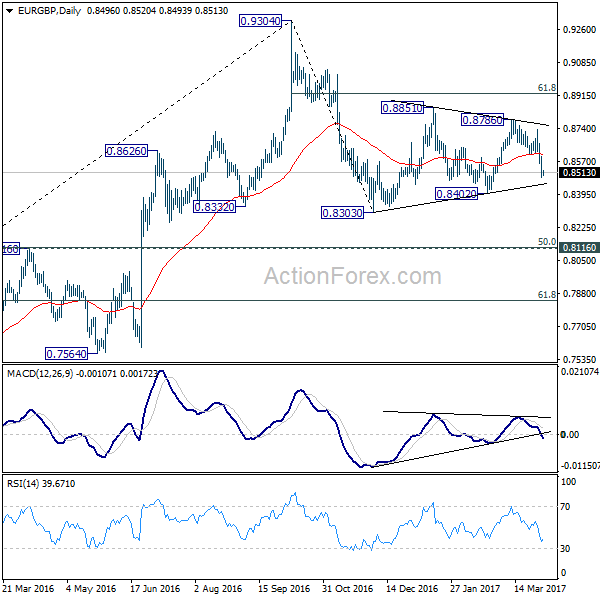
EUR/GBP Daily Outlook
Daily Pivots: (S1) 0.8447; (P) 0.8522; (R1) 0.8559; More...
Intraday bias remains on the downside for 0.8402 support. Consolidation pattern from 0.8303 could have finished at 0.8786 already. Break of 0.8402 will resume that larger decline from 0.9304 and target 0.8303 and below. Nonetheless, as fall from 0.9304 is viewed as as a corrective move, we'd expect strong support at 0.8116/20 cluster support to contain downside and bring rebound. On the upside, break of 0.8604 support turned resistance is needed to indicate completion of fall from 0.8786. Otherwise, outlook will remain cautiously bearish in case of recovery.
In the bigger picture, price actions from 0.9304 are viewed as a medium term corrective pattern. Such decline is likely ready to resume and should make a new low below 0.8303. At this point, we'd expect strong support from 0.8116 cluster support (50% retracement of 0.6935 to 0.9304 at 0.8120) to contain downside. Break of 0.9304 will pave the way to 0.9799 (2008 high). However, sustained break of 0.8116 could bring deeper decline to next key support level at 0.7564 before the correction completes.
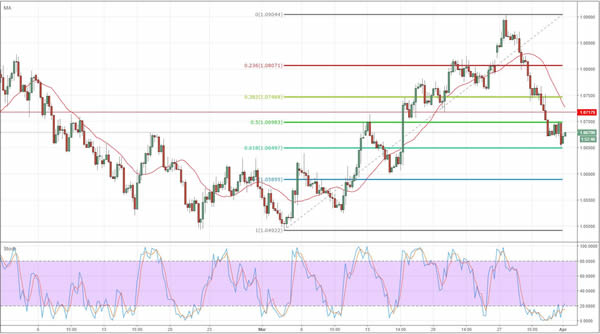
GBP/USD Breaks Triangle Pattern At 1.25 Resistance
Currency pair GBP/USD
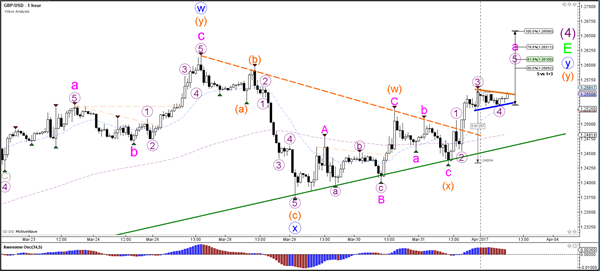
The GBP/USD broke above the resistance of the triangle (dotted orange) chart pattern, which makes it likely that a wave X (blue) has been completed. Price could be building a wave Y (blue) correction towards the Fibonacci targets.
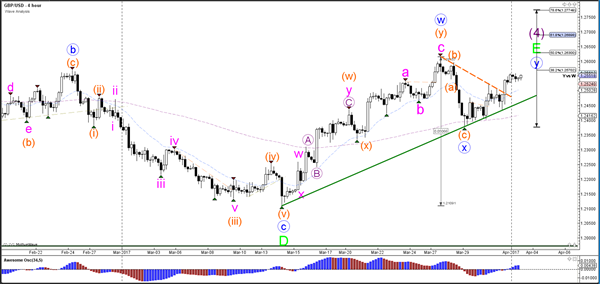
The GBP/USD broke above the resistance trend line (dotted orange). The breakout will probably turn out to be an ABC zigzag (pink). The trend lines are forming a contracting chart pattern and the current formation could be part of a wave 4 (purple) retracement.
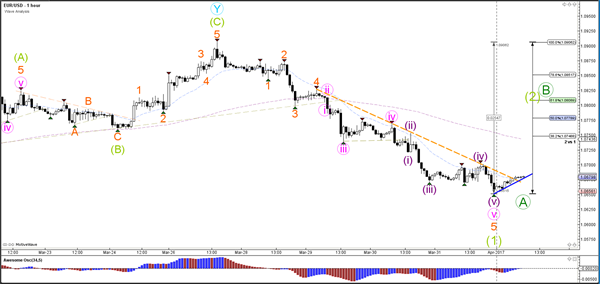
Currency pair EUR/USD
The EUR/USD showed strong bearish impulse which has been marked as either a wave 1 (light green) or wave A (dark green). Price is trying to break above the resistance trend line (orange), which could spark a retracement back to the Fibonacci levels for wave 2 or B.
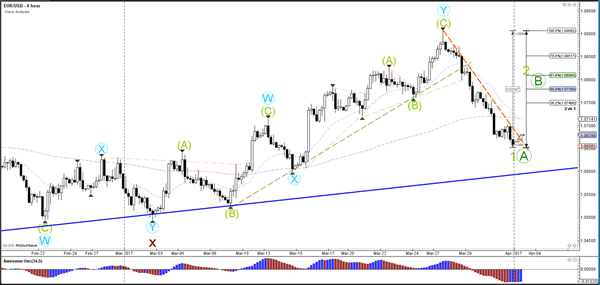
The EUR/USD break above resistance has been mild. A push above the 1.07 round resistance level could start a larger wave 2 or wave B retracement.
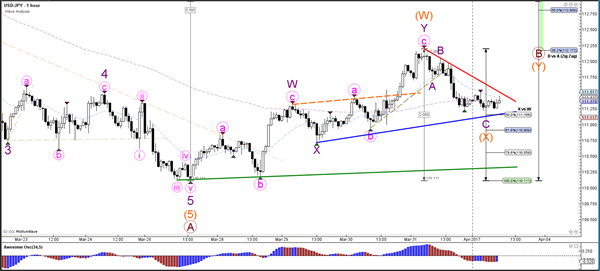
Currency pair USD/JPY
The USD/JPY indeed bounced at the 38.2% Fibonacci level of wave B vs A (brown). The current bearish price action could be part of a larger WXY (orange) correction within wave B (brown).
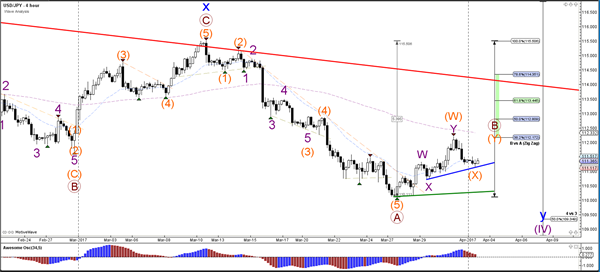
The USD/JPY seems to be building an ABC (purple) zigzag which is a corrective pattern. A break above the resistance trend line (red) would confirm a bullish breakout within wave Y (orange).
Weekly Technical Outlook And Review
EUR/USD
Price is showing oversold conditions on the 4H and Daily chart, suggesting that a bounce could follow in the near-term. Nevertheless, the technical outlook for the currency pair is negative, and selling rallies the preferred strategy.
Expect solid resistance at 1.0720 and 1.0750 (38.2 % Fibonacci of the March rally). Support is noted at 1.0650 (61.8 % Fibonacci and last week's low). Should the pair break below 1.06 support, a test of the March low at 1.05 should follow soon.
GBP/USD
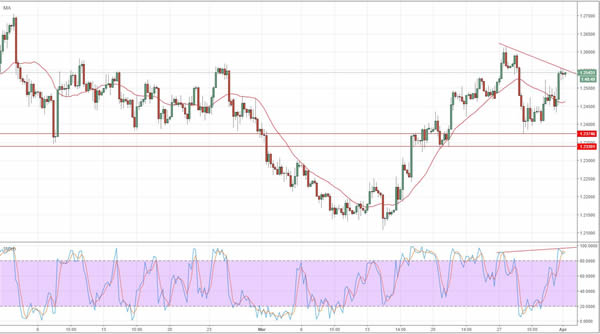
GBP/USD had a strong bounce off the 1.24 level and the recent price action has been fairly bullish. However, the Stochastic indicator on the 4H Chart is showing negative divergence, suggesting the rally could pause in the short-term. Initial support is noted at 1.2450, but the important levels in GBP/USD are 1.2375 and 1.2340.
Strong demand can be expected in this area, and GBP bulls are likely to add to their long positions there. To the topside, 1.26 is the next major obstacle. A break above would then signal a move towards 1.27. However, techs suggest we will first a see a correction before the rally continues.
USD/JPY
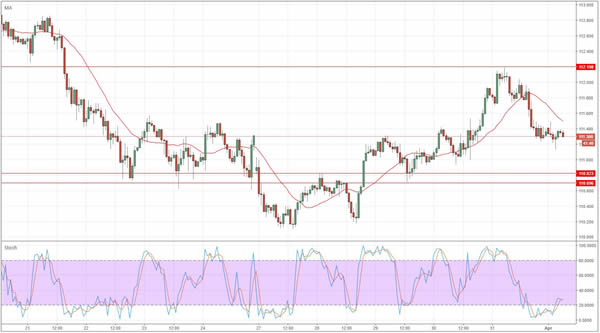
The short-term outlook for USD/JPY is mixed. The currency pair failed at 112.20 resistance and had a correction of almost 100 pips. This shows that selling interest remains high, and that the overall downtrend is still intact. Traders should watch the support area between 110.70 and 110.80. If we see a clear bounce off that, USD/JPY might have another test of 112 soon.
Should it break below, it will likely head towards 110 quickly. Given the lack of momentum at the moment, trading the range between 110 and 112.20 is the preferred strategy for now.
AUD/USD
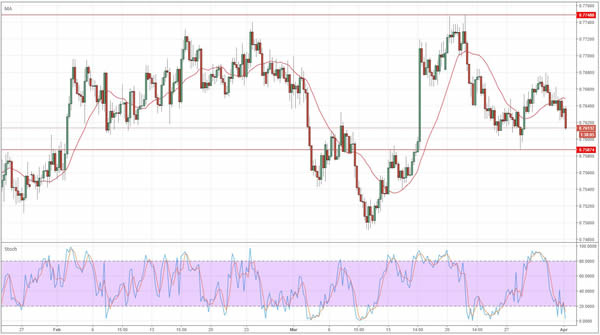
AUD/USD continues to consolidate in a relative tight range. The currency pair came under pressure overnight and is moving towards the 0.76 level. Solid support is noted at 0.7587. A break below would likely trigger momentum selling and push the Australian Dollar towards the 0.75 level.
Overall, the risk lies to the downside as the pair has been struggling with strong resistance above 0.77 and failed to gather momentum to the upside. Resistance is noted at 0.7680 and 0.7720/50.
USD/CHF
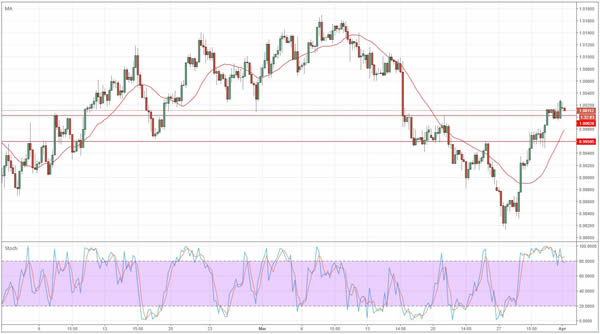
USD/CHF broke above an important resistance level at 1.00, but the currency pair is running out of momentum. Short-term, expect a minor correction before the rally continues.
Good support is seen at 0.9960, and is likely to attract decent buy interest.
XAUUSD:
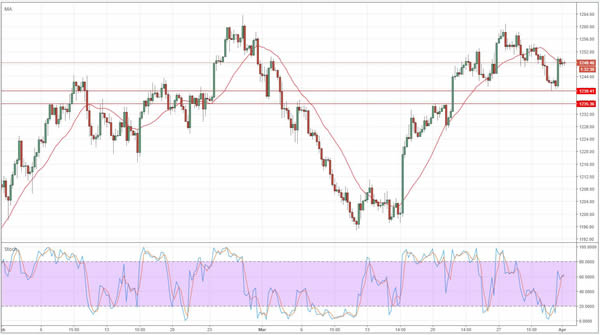
Gold ran out of momentum last week and failed once again at 1260 resistance. Nevertheless, it attracted strong demand at 1240 and managed to recover to 1250. The technical outlook remains bullish, with the uptrend clearly intact.
Expect strong support in the area between $1235 and $1239. To the topside, 1260/61 remains the major obstacle. Should Gold break above it, a move towards 1300 should follow quickly.
EUR/CHF Daily Outlook
Daily Pivots: (S1) 1.0674; (P) 1.0692; (R1) 1.0701; More...
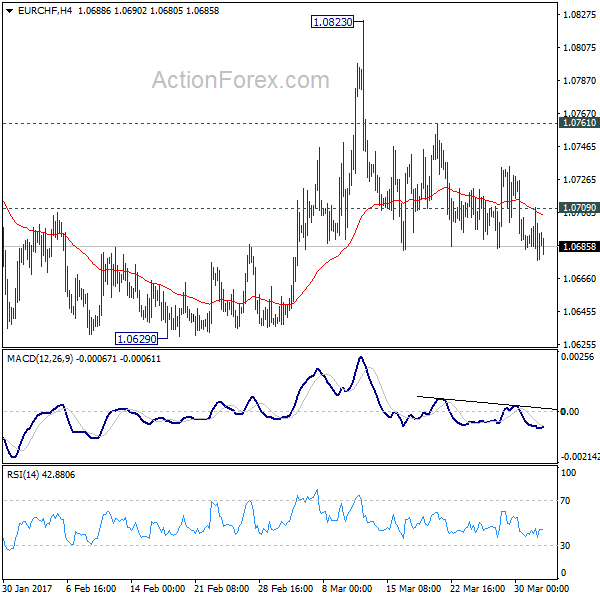
Intraday bias in EUR/CHF remains mildly on the downside for the moment. Rebound from 1.0629 should have completed at 1.0823 already. Deeper fall would now be seen back to 1.0620/29 key support zone. Decisive break there will resume the larger fall from 1.1198. On the upside, above 1.0709 minor resistance will turn intraday bias neutral. But outlook will be cautiously bearish as long as 1.0761 resistance holds.
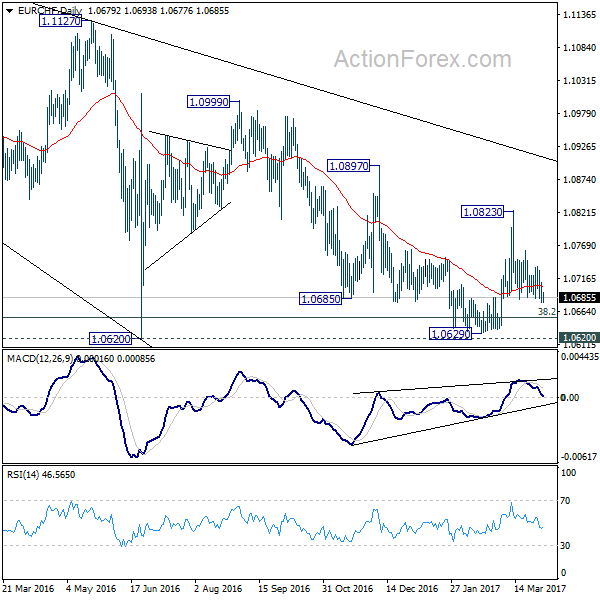
In the bigger picture, the decline from 1.1198 is seen as a corrective move. Current development suggests that it's not completed yet. sustained trading below 38.2% retracement of 0.9771 to 1.1198 at 1.0653 will target 50% retracement at 1.0485. In any case, break of 1.0823 resistance is needed to be the first indication of reversal. Otherwise, deeper fall is still expected even in case of recovery.
European Open Briefing
Global Markets:
- Asian stock markets: Nikkei up 0.25 %, Hang Seng gained 0.45 %, ASX 200 fell 0.30 %, Shanghai Composite closed for holiday
- Commodities: Gold at $1250 (-0.05 %), Silver at $18.24 (-0.10 %), WTI Oil at $50.50 (-0.15 %), Brent Oil at $53.40 (-0.20 %)
- Rates: US 10-year yield at 2.40, UK 10-year yield at 1.14, German 10-year yield at 0.33
News & Data:
- Australian AIG Manufacturing Index Mar: 57.5 (prev 59.3)
- Australian Retail Sales (MoM) Feb: -0.1% (exp 3.0%; prior 0.4%)
- Australian Building Approvals (MoM) Feb: 8.3% (exp -1.0%; prior 1.8%)
- Japanese Tankan Large Manufacturing Index 1Q: 12 (exp 14; prior 10)
- Japanese Large Manufacturing Outlook 1Q: 11 (exp 13; prior 8)
- Japanese Large Non-Manufacturing Index 1Q: 20 (exp 20; prior 18)
- Japanese Large Non-Manufacturing Outlook 1Q: 16 (exp 18; prior 16)
- Japanese Large All Industry CAPEX 1Q: 0.6% (exp -0.1%; prior 5.5%)
- Japanese Nikkei Manufacturing PMI Mar: 52.4 (prior 52.6)
- South Korean Nikkei Manufacturing PMI Mar: 48.4 (prior 49.2)
CFTC Positioning Data:
- EUR short 8K vs 20K short last week. Shorts trimmed by 12K
- GBP short 104K vs 108K short last week. Shorts trimmed by 4K
- JPY short 53K vs 67K short last week. Shorts trimmed by 14K
- CHF short 16K vs 12K short last week. Shorts increased by 4K
- CAD short 28K vs 24K short. Shorts increased by 4K
- AUD long 53K vs 45K long. Longs increased by 8K
- NZD short 13K vs 13K short last week. No change
Markets Update:
The FX market had a quiet start into the new trading week. The Euro recovered slightly, rising from 1.0650 to 1.0680 against the US Dollar. Selling interest is noted at 1.07 and 1.0720, while the next notable support level now lies at 1.06.
GBP/USD increased from 1.2525 to 1.2555 in Asia. The Pound remains strong, despite worries around the Brexit process. Recent UK economic data has been solid, putting the Bank of England back into the spotlight. The central bank might be forced to increase interest rates soon, amid rising inflation.
USD/JPY started the new trading week around 111.40 and declined to 111.10, as equity markets fell as well. Support is seen at 110.80, followed by 110.20 and the key level at 110.00. AUD/USD also came under pressure as risk appetite decrease. The currency pair declined from 0.7640 to 0.7610.
Upcoming Events:
- 08:45 GMT – Italian Manufacturing PMI
- 08:50 GMT – French Manufacturing PMI
- 08:55 GMT – German Manufacturing PMI
- 09:00 GMT – Euro Zone Manufacturing PMI
- 09:30 GMT – UK Manufacturing PMI
- 10:00 GMT – Euro Zone Unemployment Rate
- 14:45 GMT – US Markit Manufacturing PMI
- 15:00 GMT – US ISM Manufacturing PMI
- 15:30 GMT – FOMC Member Dudley speaks
- 22:00 GMT – FOMC Member Lacker speaks
The Week Ahead:
Tuesday, April 4th
- 05:30 GMT – RBA Rate Decision
- 05:30 GMT – RBA Statement
- 09:30 GMT – UK Construction PMI
- 10:00 GMT – Euro Zone Retail Sales
- 10:15 GMT – RBA Governor Lowe speaks
- 13:30 GMT – Canadian Trade Balance
- 14:30 GMT – ECB President Draghi speaks
- 15:00 GMT – US Factory Orders
Wednesday, April 5th
- 08:45 GMT – Italian Services PMI
- 08:50 GMT – French Services PMI
- 08:55 GMT – German Services PMI
- 09:00 GMT – Euro Zone Services PMI
- 09:30 GMT – UK Services PMI
- 13:15 GMT – US ADP Nonfarm Employment Change
- 14:45 GMT – US Markit Services PMI
- 15:00 GMT – US ISM Services PMI
- 15:30 GMT – US Crude Oil Inventories
- 19:00 GMT – FOMC Meeting Minutes
Thursday, April 6th
- 02:45 GMT – Chinese Caixin Services PMI
- 07:00 GMT – German Factory Orders
- 08:00 GMT – ECB President Draghi speaks
- 08:15 GMT – Swiss CPI
- 12:30 GMT – ECB Meeting Minutes
- 13:30 GMT – US Initial Jobless Claims
- 14:30 GMT – FOMC Member Williams speaks
- 17:40 GMT – ECB Member Praet speaks
- 18:15 GMT – ECB Member Constancio speaks
Friday, April 7th
- 06:45 GMT – Swiss Unemployment Rate
- 07:00 GMT – German Trade Balance
- 07:00 GMT – German Industrial Production
- 07:45 GMT – French Trade Balance
- 08:30 GMT – UK Halifax House Price Index
- 09:30 GMT – UK Industrial Production
- 09:30 GMT – UK Manufacturing Production
- 09:30 GMT – UK Trade Balance
- 10:00 GMT – Bank of England Governor Carney speaks
- 13:30 GMT – US NFP
- 13:30 GMT – US Unemployment Rate
- 13:30 GMT – US Average Hourly Earnings
- 13:30 GMT – Canadian Unemployment Rate
- 13:30 GMT – Canadian Employment Change
- 15:00 GMT – Canadian Ivey PMI
- 15:00 GMT – Bank of Canada Governor Poloz speaks
Xi-Trump Summit In The Spotlight The Week Ahead
Recap
The U.S. dollar bulls finally regained some control of the market after three weeks of consecutive declines. Nonetheless, despite a 1% rally last week, the dollar index suffered 1.9% declines in the first quarter. The weakness in the greenback may be attributed to multiple factors, but the major one was the tax reform uncertainty. The failure to pass the healthcare reform vote by Trump’s administration cast doubt on the President’s ability to deliver on other promised policies, and the market's primary concern have become on whether he could unite Republicans behind his pro-growth plans.
The economic data released was rather mixed last week. U.S. PCE continued to firm in February, rising above the Fed’s 2% target and personal income rose 0.4%. Consumption, on the other hand, wasn’t encouraging as real personal spending slipped back by 0.1% in February, suggesting a lack of confidence amongst U.S. citizens, but given that many workers faced delays in tax refunds we’re likely to see spending figures recover in March.
Monetary policy makers have spent the last two weeks reminding investors of their intention to keep tightening monetary policy, which indicates that the Fed officials are going ahead with their plans regardless of what the U.S. administration achieve on the fiscal side.
Xi-Trump Summit
Finally, the time has come for the leaders of the two largest economies to meet. According to the White House, the meeting will be focused on global, regional, and bilateral issues of mutual concern. In fact, the meeting will more likely be focused on the US trade deficits with China. What makes this summit more complicated is the U.S. President’s intention to penalize currency manipulators, which China likely to be on the top of the list. If tensions escalated between the both Presidents, we’re likely to experience a wave of risk aversion, which will not only hurt the U.S. dollars but even global equities.
Fed minutes
After the Fed raised interest rates by 25 basis points in March, the dollar tumbled sharply due to what was interpreted a dovish hike. The little tweaks in the statement and economic projections suggested that the economy is still moving on the right path, but there was no evidence of overheating economy, and no requirement to fasten the pace of tightening. However, most of the recent speeches by Fed officials seemed more hawkish, and Wednesday will reveal more insight on how monetary policymakers are thinking when the minutes are released.
Non-farm payrolls
Traders’ favorite indicator is due to release on Friday. After a robust reading last month of 235,000, economists expect the number of jobs to slow down to 180,000. If the pace of job growth started showing signs of weakness, it might be bad news for U.S. dollar bulls. However, I believe earning growth will play a more important role, so it’s better to have a full picture of the jobs report before trading on the data.
Asian Market Update: Australia Retail Sales Slump
Australia Retail Sales slump
Asia Mid-Session Market Update: China, Japan, Korea manufacturing PMIs retreat; Australia Retail Sales slump
Friday US Session Highlights
(US) FEB PERSONAL INCOME: 0.4% V 0.4%E; PERSONAL SPENDING: 0.1% V 0.2%E; Real Personal Spending (PCE): -0.1% v +0.1%e
(US) FEB PCE DEFLATOR M/M: 0.1% V 0.1%E; Y/Y: 2.1% V 2.1%E
(US) FEB PCE CORE M/M: 0.2% V 0.2%E; Y/Y: 1.8% V 1.7%E
(US) Fed's Dudley (dove, FOMC voter): Rate hikes to be data dependent; couple of more hikes in 2017 is reasonable
(US) MAR CHICAGO PURCHASING MANAGER: 57.7 V 56.9E
(US) Atlanta Fed cuts Q1 GDP to 0.9% from 1.0% on 3/24
Friday US markets on close: Dow -0.3%, S&P500 -0.2%, Nasdaq flat
Best Sector in S&P500: Real Estate
Worst Sector in S&P500: Financials
Biggest gainers: FMC +13.2%; MLM +3.2%; cBT +2.9%
Biggest losers: INCY -3.0%; URBN -2.9%; AN -2.8%
At the close: VIX 12.4 (+0.8pts); Treasuries: 2-yr 1.27% (-2bps), 10-yr 2.40% (-2bps), 30-yr 3.02% (-1bps)
Politics
(AU) Approval rating for Australia's ruling Coalition slips to 47% v 53% for opposition Labor party in two-party terms - Australian
(US) President Trump: Will handle North Korea without China's help if need to - FT
(US) Pres Trump tweets, calls on media to investigate "Obama SURVEILLANCE SCANDAL and stop with the Fake Trump/Russia story"
Weekend US/EU Corporate Headlines
4503.JP: Acquires privately owned drug discovery company, Ogeda SA for €800M
TSLA: Reports Q1 deliveries just over 25.0K (~13.5K Model S; ~11.6K Model X), +69% y/y; Production 25.4K (deliveries and production fresh record highs)
Key economic data:
(CN) CHINA MAR CAIXIN PMI MANUFACTURING: 51.2 V 51.7E (9th consecutive expansion)
(JP) JAPAN Q1 TANKAN LARGE MANUFACTURING INDEX: 12 V 14E; MANUFACTURERS OUTLOOK: 11 V 13E; ALL-INDUSTRY CAPEX: 0.6% V -0.3%E
(JP) JAPAN MAR FINAL PMI MANUFACTURING: 52.4 V 52.6 PRELIM
(AU) AUSTRALIA FEB RETAIL SALES M/M: -0.1% V +0.3%E
(AU) AUSTRALIA FEB BUILDING APPROVALS M/M: +8.3% (7-month high) V -1.5%E; Y/Y: -4.9% (smallest decline in 3 months) V -14.5%E
(AU) AUSTRALIA MAR MELBOURNE INSTITUTE INFLATION M/M: 0.1% V -0.3% PRIOR; Y/Y: 2.2% (14-month high) V 2.1% PRIOR
(AU) AUSTRALIA MAR CORELOGIC RPDATA HOUSE PRICES M/M: 1.4% V 1.4% PRIOR; Y/Y: 12.9% (7-year high)
(AU) AUSTRALIA MAR AIG MANUFACTURING INDEX: 57.5 V 59.3 PRIOR; 6th month of expansion
(KR) SOUTH KOREA MAR PMI MANUFACTURING: 48.4 V 49.2 PRIOR; 8th consecutive month of contraction
Asia Session Notable Observations, Speakers and Press
Asian equity markets are trading mixed, tracking underwhelming US Friday session where PCE inflation data were in line with consensus, Chicago PMI numbers saw decent growth, but personal spending data missed expectations. Oil prices have remained supported above the $50/brl level, while US Treasuries were bid somewhat higher within their recent range. FX market volatility was also somewhat dulled by the start of a holiday break in China - USD majors saw little change with the exception of AUD/USD, which slid some 40pips from the highs toward $0.76 on the release of weaker than expected Retail Sales.
Aussie retail figures came in unexpectedly negative, with a -0.1% slide against expected 0.3% rise, sending AUD down to its lows. This may allow RBA some flexibility as it prepares to crafts its monetary policy statement on tap for tomorrow. Slowing Australia spending as well as recent slump in exports is mitigated by continued price pressures in the property sector - just today, CoreLogic for March saw prices nationwide rise by 12.9% on the year - a 7-year high. Building Approvals data were also higher, with m/m increase registering its 7-month high rate of growth.
Over the weekend, China March Caixin manufacturing PMI missed expectations at 51.2 V 51.7E. Caixin economists noted continued downward trend in employment, weakest new export sales this year, and further slowdown in the rate of input price inflation, even though the overall figure was in expansion territory for the 9th straight month. Also of note in China, BoC released its FY16 results that saw a miss on the bottom line, a 200bp drop in ROE and 30bp slide in NIMs. The bank warned domestic and international picture will remain "complicated this year" amid China's economic transition as its shares fell over 2% in Hong Kong.
Other PMI figures from the far east were mixed. South Korea's was most troubling, remaining in contraction for 8th straight month amid "sharpest decline in employee numbers" since the end of 2008. New export orders also slumped due to weaker demand from China amid THAAD system deployment dispute. Japan final PMI also retreated somewhat from the prelim figure, even though Q1 Tankan showed more signs of economic recovery.
China
(CN) China announces property curbs in city of Tianjin - China Daily (update)
(CN) PBOC raises interest rates on Standing Lending Facility (SLF) Loans by 0.2pts to 3.3% effective Mar 16th - press
(HK) Macau Mar Gaming Rev MOP21.23B v MOP22.99B prior; y/y: 18.1% v +11%e
Japan
(JP) Japan megabanks said to be planning to raise mortgage rates - Nikkkei
Australia/New Zealand
(NZ) New Zealand Treasury March Monthly Economics Indicators report: Inflation was near 2% in Q1; sees inflation below 2% later in 2017
Korea
(KR) South Korea, Japan, and US naval forces to hold 3-day anti-submarine training - press
Asian Equity Indices/Futures (00:00ET)
Nikkei +0.1%, Hang Seng +0.3%, Shanghai Composite closed, ASX200 -0.3%, Kospi +0.2%
Equity Futures: S&P500 flat; Nasdaq +0.1%, Dax flat, FTSE100 flat
FX ranges/Commodities/Fixed Income (00:00ET)
EUR 1.0650-1.0680 (3-month high); JPY 111.10-111.50; AUD 0.7610-0.7640; NZD 0.7000-0.7015; GBP 1.2530-1.2555
Apr Gold flat at 1,250/oz; May Crude Oil -0.1% at $50.53/brl; May Copper -0.3% at $2.65/lb
(US) Weekly Baker Hughes US Rig Count: 824 v 809 w/w (+1.9%) (11th straight weekly rise)
iShares Silver Trust ETF daily holdings fall to 10,274 tonnes from 10,292 tonnes prior; 3rd straight decline
(KR) South Korea MoF sells 3-yr bonds; avg yield 1.67%
Asia equities/Notables/movers
Australia
DOW.AU Downer -1.9% (Cut at Morgan Stanley)
MLD.AU Maca +3.9% (contract)
Japan
4613.JP Kansai Pain +2.2% (raised at Nomura)
8750.JP Daichi Life -3.7% (medium term growth target speculation)
6502.JP Toshiba -6.6% y/y (may miss Q3 earnings results again)
Hong Kong
1919.HK Cosco Shipping +0.6% (FY16 results)
1186.HK China Railway Constructino (CRCC) +2.7% (FY16 results)
1893.HK China National Materials Company +4.7% (FY16 results)
0661.HK China Daye Non Ferrous Metals Mining +3.3% (FY16 results)
3988.HK Bank of China -2.1% (FY16 results)
3688.HK Top Spring International Holdings Ltd +5.7% (FY16 results)
ISM Manufacturing Has Soared Over The Past Couple Of Months
Market movers today
Today, ISM manufacturing for March is due out in the US. ISM manufacturing has soared over the past couple of months, emphasising that there is progress in manufacturing. In the same period, we have seen a divergence between ISM and PMI manufacturing emerge. Based on this, one would argue that ISM manufacturing could be in for a fall. However, regional manufacturing indices cont inued rising in March. Thus, there are mixed signals concerning the March ISM figures. We est imate that the ISM manufacturing fell back slight ly to 56.0 in March. Today also brings a number of speeches by FOMC members and we will also get the minutes from the 14-15 March FOMC meet ing on Wednesday. We will in part icular look for discussions on t he Fed's desire t o begin shrinking its balance sheet , as Fed Chair Janet Yellen said at the press conference that the FOMC members discussed it at the meet ing.
The absolute highlight of the week in the US will be the labour market report for March on Friday. The labour market has been in good shape over the past two months and we expect this t rend to cont inue. We est imate a total of 160,000 new jobs were created in March of which the service sector provided 160,000 and manufacturing 15,000. We furthermore expect the unemployment rat e remained at 4.7% aft er last mont h's decrease. As a warm -up for the labour market report , ADP employment for March is due out on Wednesday. Although not a perfect predictor, ADP tends to give a relat ively good idea of what to expect from the official jobs report .
In the euro area, it is today t ime for PMIs for both for single count ries and the eurozone. In general, consensus is looking for a consolidat ion at an already high level. If anything, the risk is also skewed to the downside in Europe as in the US. The unemployment figure for February is also due for release today. From its January level of 9.6%, we est imate unemployment fell to 9.5%, cont inuing its steady decline since 2013. Business sent iment suggests that unemployment will cont inue declining as the PMI employment indicator, especially within services, showed st rength in January and February.
Selected market news
After the lower-than-expected inflat ion data from Germany and Spain on Thursday, it was no major surprise that euro area HICP inflat ion on Friday came out at just 1.5% y/y and that core inflat ion dropped to 0.7% y/y in March. Together wit h last week's comments from ECB officials, especially the Reuters stories of unconfirmed ‘ECB sources' that the ECB was surprised about t he ‘hawkish' market interpretation after its latest meet ing, the EUR money market curve has once again been repriced. The market is once again looking for the first rate hike in summer 2018. We cont inue to hold the view that the ECB will extend the QE programme into 2018 at the September ECB meet ing.
Spain has together with Portugal been the posit ive growth surprise in southern Europe. On Friday, this was acknowledged by S&P, which changed the out look for Spain from stable to posit ive, indicat ing that a rat ing upgrade could be next . S&P said that it believed the st rong economic performance would cont inue over the next two years.