
Sample Category Title
NZDUSD Bearish Channel In Progress
The NZD/USD has been trading within the bearish channel, with a very low ATR. Slow zig-zag that has been forming this downtrend points out to new POC zone where price could reject and a breakout/continuation level just below it. The POC (EMA89, D H3, ATR pivot, Upper channel line) 0.7000-7015 could reject the price towards 0.6980. Breakout and 4h close below 0.6980 suggests 0.6960 as the next target. Break of 0.6960 could pull the price lower to 0.6930.
D H3 - Daily Camarilla Pivot (Daily Resistance)
POC - Point Of Confluence (The zone where we expect price to react - aka entry zone)
W L3 - Weekly L3 Camarilla (Strong Weekly Support)
D L4- Daily L4 Camarilla ( Very Strong Daily Support)
D L5- Daily L4 Camarilla ( Strongest Daily Support)
Foreign Exchange Market Commentary: EUR/USD, USD/JPY, GBP/USD, GOLD, WTI CRUDE, DJIA, FTSE 100, DAX
EUR/USD
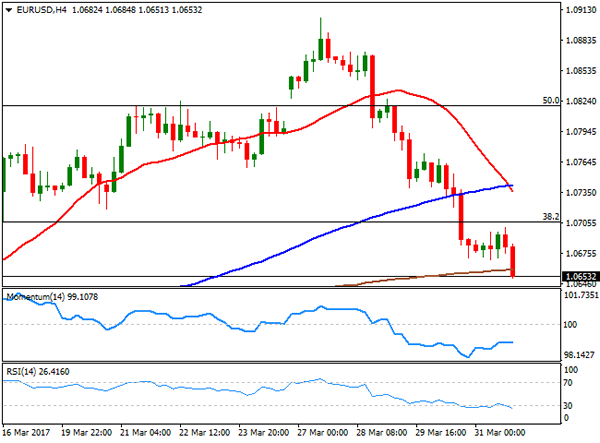
The EUR/USD pair maintained the sour tone on Friday, ending the week at 1.0656, its lowest since mid March. The release of worse-than-expected EU preliminary inflation for March weighed on the common currency, further reinforcing early week talks on the ECB being concerned about yields raise and that therefore, was not considering retrieving its massive stimulus program. Dollar's performance was uneven across the board, but ended it generally stronger, except against the Pound that managed to end the week with gains, in spite of softer final growth figures for the last quarter of 2016, as Fed's Dudley stated that the Central Bank could begin shrinking its balance sheet as soon as this year, should the economy perform in line with their expectations.
The week will start with the release if the final Markit manufacturing PMIs for the EU, expected with modest revisions from the flash readings, still showing that the EU's private sector kept growing at its fastest pace in years, and another speech from Fed's Dudley.
From a technical point of view, the EUR/USD pair has turned strongly bearish after toping at 1.0905 at the beginning of last week, given that in the daily chart, the price has faltered around the 200 DMA before turning south, now trading also below the 20 DMA and not far above a horizontal 100 DMA, this last around 1.0620, now the immediate support. Technical indicators in the mentioned time frame head sharply lower within negative territory, indicating strong momentum within sellers. In the shorter term, and according to the 4 hours chart, the RSI indicator turned south after being unable to recover from oversold territory, now around 26, whilst the Momentum indicator turned flat within bearish territory, as the price develops far below its 20 and 100 SMAs, all of which supports additional declines, with the downward momentum expected to accelerate on a break below 1.0590.
Support levels: 1.0620 1.0590 1.0565
Resistance levels: 1.0670 1.0710 1.0745
USD/JPY
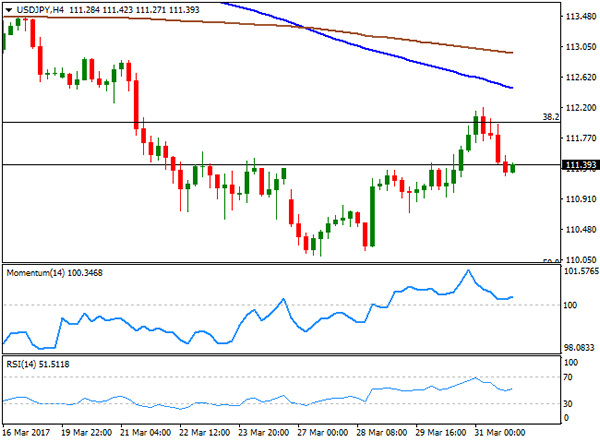
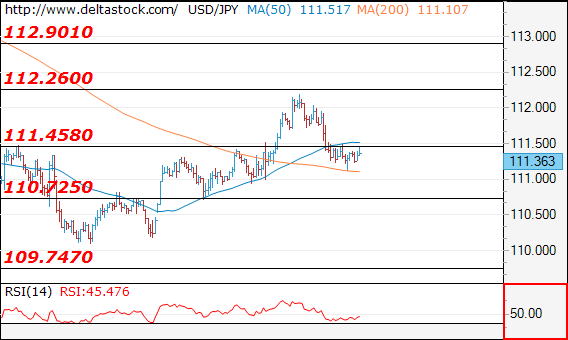
The USD/JPY pair advanced up to 112.19 early Friday, its highest for the week, but closed the day in the red around 111.36 as the positive momentum faded on mute yields. The advance, was triggered by better-than-expected Japanese inflation figures that picked up in February, whilst the unemployment rate fell to a two-decade low. Core yearly inflation surged for a second consecutive month up by 0.2% still far away from the BOJ's 2% target, but at least out of negative territory. The poor performance of equities and yields, however, pushed the pair into the red during the last two sessions of the week. The daily chart shows that, despite closing with gains, the pair set a lower low and a lower high, indicating that the bearish dominant trend remains firm in place in the longer run. Daily basis, the pair is trading between the 100 and 200 SMAs, with the shortest capping the upside around 114.40, and the longest providing support at 109.20. Technical indicators in the mentioned chart diverge from each other, with the Momentum recovering and the RSI heading south, both within negative territory. Shorter term, the 4 hours chart shows that the 100 and 200 SMAs keep heading south above the current level, whilst technical indicators have turned flat within neutral territory. Renewed selling pressure below 111.00, will likely favor additional declines towards the 110.10 level, last week low.
Support levels: 110.95 110.50 110.10
Resistance levels: 111.60 112.00 112.50
GBP/USD
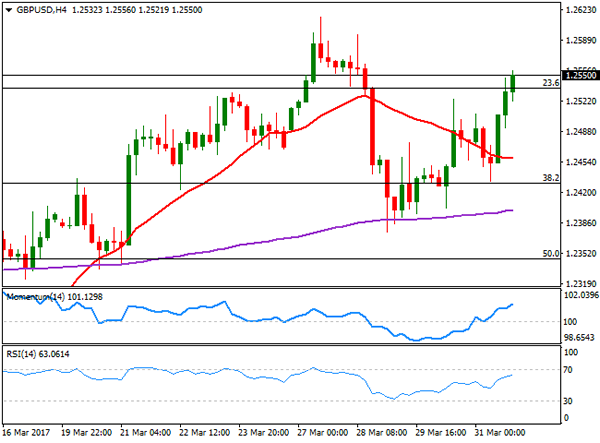
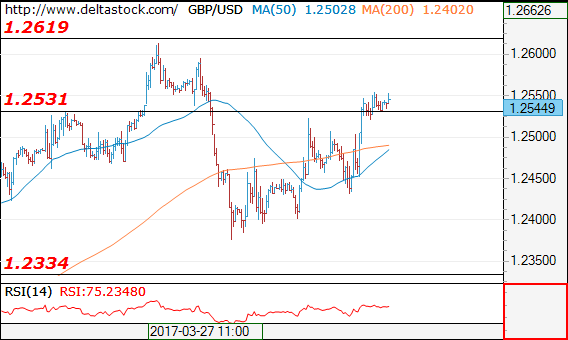
The GBP/USD pair closed Friday at 1.2550, marginally higher weekly basis and at its highest settlement since early February. The pair fell to 1.2375 last Wednesday, when the UK formally triggered the Brexit through a letter to the EU, further undermined by news that the Scottish Parliament backed FM minister Sturgeon desire to trigger a second independence referendum. The Pound, however, managed to recover the ground lost, despite UK's final Q4 GDP suffered a modest downward revision, down to 1.9% from previous 2.0%, whilst Total Business investment fell by 0.9% in the last three months of 2016. The current account balance however, improved in the same period, printing a deficit of £12 billion against a previously revised one of £25 billion. Technically, the daily chart for the pair shows that the upside is favored as the price settled above the 23.6% retracement of its January's rally and well above a bullish 20 SMA, whilst the RSI indicator resumed its advance within positive territory, now heading north around 60. In the 4 hours chart, technical indicators maintain upward slopes well into positive territory, whilst the 20 SMA has turned flat well below the current level, in line with the longer term perspective.
Support levels: 1.2520 1.2480 1.2445
Resistance levels: 1.2579 1.2620 1.2660
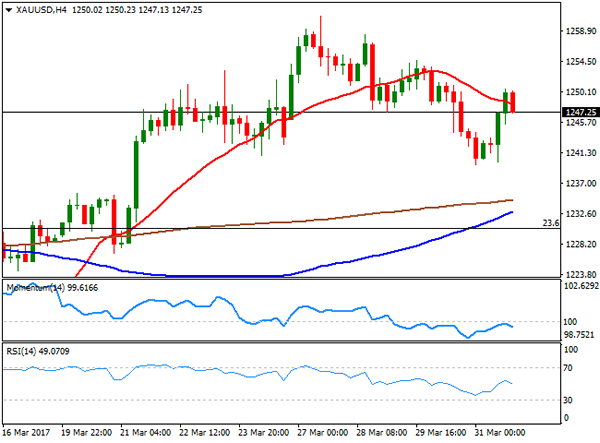
GOLD
The GBP/USD pair closed Friday at 1.2550, marginally higher weekly basis and at its highest settlement since early February. The pair fell to 1.2375 last Wednesday, when the UK formally triggered the Brexit through a letter to the EU, further undermined by news that the Scottish Parliament backed FM minister Sturgeon desire to trigger a second independence referendum. The Pound, however, managed to recover the ground lost, despite UK's final Q4 GDP suffered a modest downward revision, down to 1.9% from previous 2.0%, whilst Total Business investment fell by 0.9% in the last three months of 2016. The current account balance however, improved in the same period, printing a deficit of £12 billion against a previously revised one of £25 billion. Technically, the daily chart for the pair shows that the upside is favored as the price settled above the 23.6% retracement of its January's rally and well above a bullish 20 SMA, whilst the RSI indicator resumed its advance within positive territory, now heading north around 60. In the 4 hours chart, technical indicators maintain upward slopes well into positive territory, whilst the 20 SMA has turned flat well below the current level, in line with the longer term perspective.
Support levels: 1.2520 1.2480 1.2445
Resistance levels: 1.2579 1.2620 1.2660
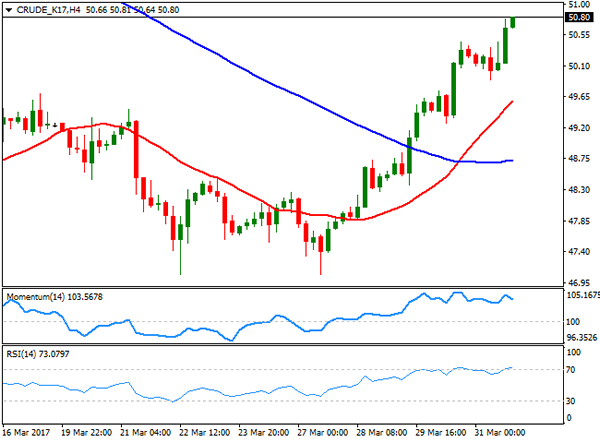
WTI CRUDE
Crude oil prices were in steady recovery mode this past week, with West Texas Intermediate crude oil futures settling at $50.80 a barrel. On Friday, the Baker Hughes report showed that the number of active US oil rigs drilling in the US rose by 10 to 662 in the week ending March 31st, but hopes that the OPEC would extend its output cut pass June lifted sentiment. During the weekend, OPEC’s Secretary-General Mohammad Barkindo said that stockpiles are starting to decline in the region, and bringing the market to balance, with a drag of an estimated of 285 million barrels of oil in storage, and therefore oil prices will likely hold on to gains. In the daily chart, the price has recovered far above its 20 and 200 DMAs, whilst technical indicators re-entered positive territory, although losing their upward momentum, somehow limiting chances of a steeper advance, but far from suggesting upward exhaustion. Shorter term, the 4 hours chart shows that indicators have settled in overbought territory, lacking directional strength, but also that the 20 SMA heads sharply higher above the 100 SMA and both below the current level, in line with the longer term perspective.
Support levels: 50.45 49.70 49.00
Resistance levels: 51.25 51.90 52.50
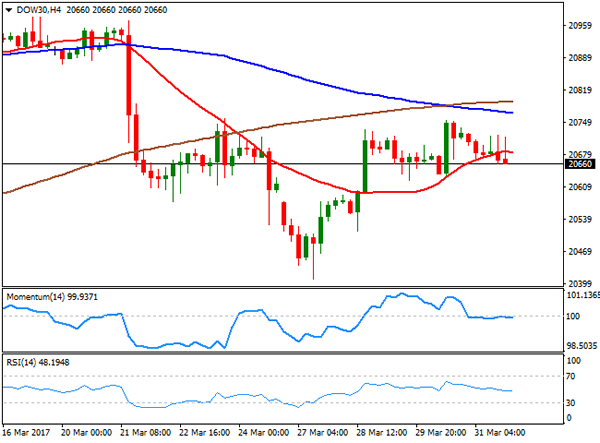
DJIA
US equities closed Friday in the red, although with solid gains for the first quarter of this 2017. The Dow Jones Industrial Average ended at 20,663.22, down 65 points on the day, but up 4.6% in the three months. The Nasdaq Composite shed 2 points to 5,911.74, while the S&P lost 0.23%, to 2,362.72 up 10% and 5.5% respectively in the quarter. Within the Dow, Intel was the best performer, adding 0.90%, followed by Wal-Mart that advanced 0.68%. Exxon Mobile was the worst performer, down 2.02%, followed by El du Pont that lost 1.60%. The DJIA daily chart shows that the index consolidated near its weekly high, but also that the risk remains towards the downside, as it was unable to advance beyond its 20 DMA, whilst technical indicators pared gains below their mid-lines, and resumed their slides. In the 4 hours chart, the benchmark presents a neutral-to-bearish stance, developing below its 100 and 200 SMAs and currently struggling with a horizontal 20 SMA, whilst technical indicators are stick around their mid-lines, with modest downward slopes.
Support levels: 20,623 20,562 20,513
Resistance levels: 20,717 20,757 20,806
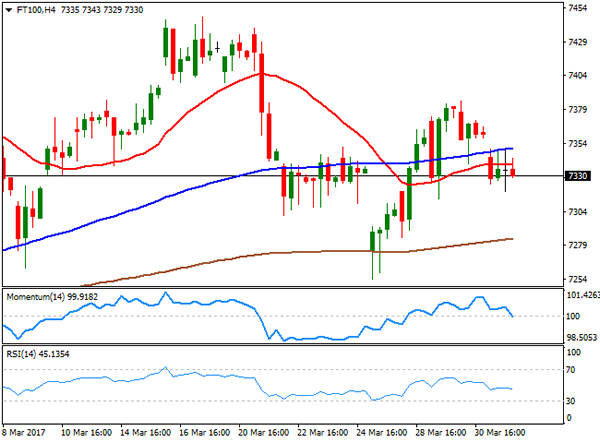
FTSE 100
The FTSE closed in the red last Friday, down 46 points or 0.63%, to 7,322.92, undermined by news coming from South Africa, as companies with business in the country led the decline following news that Finance Minister Gordhan was dismissed. Mining-related equities also weighed on the benchmark as metals fell on renewed dollar's demand. Old mutual was the worst performer, down 7.51%, followed by Mediclinic International that shed 6.19% and Anglo American that closed 3.41% lower. The best performer was ITV that gained 3.55%. The daily chart for the Footsie shows that the index has settled below its 20 DMA whilst technical indicators turned south within neutral territory, increasing the risk of a bearish extension, although not enough to confirm it, given that the benchmark closed the week well off its low of 7,254. In the 4 hours chart, the index is now below horizontals 20 and 100 SMAs, whilst technical indicators are also easing around their mid-lines, in line with the longer term perspective. Friday's low of 7,319 is the immediate support, the level to break to confirm another leg lower towards the mentioned 7,254.
Support levels: 7,319 7,289 7,254
Resistance levels: 7,349 7,387 7,415
DAX
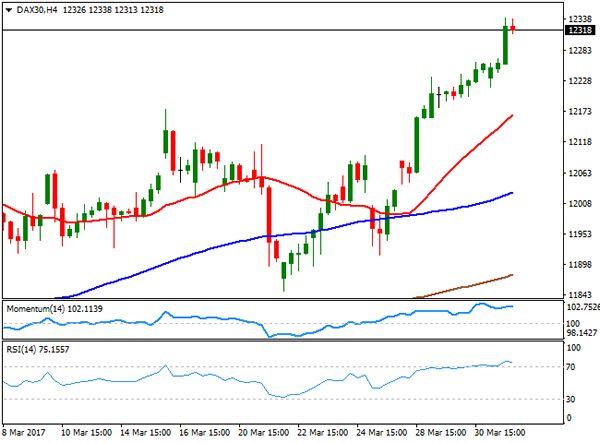
European equities closed mixed on Friday, but the German DAX managed to extend its advance, adding 56 points to end as 12,312.87, its highest settlement since April 2015. A weaker EUR underpinned the benchmark, while better-than-expected local employment data offsetting softer inflation figures released earlier in the week. RWE AG was the best performer, up 2.68% followed by E.ON that added 1.84%. Only six components closed in the red, with Commerzbank leading the decline, down 0.82%, followed by Daimler that shed 0.72%. The index holds not far from record highs settle two years ago at 12,399, maintaining the bullish reading according to technical readings, given that in the daily chart, it advanced further above a bullish 20 SMA, whilst technical indicators maintain their bullish slopes within positive territory, although with limited upward momentum. In the 4 hours chart, technical indicators consolidate within overbought territory, lacking directional strength, whilst the 20 SMA maintains its strong bullish slope far below the current level, indicating that the risk remains towards the upside.
Support levels: 12,275 12,221 12,180
Resistance levels: 12,341 12,399 12,450
EUR/USD Elliott Wave Analysis
EUR/USD – 1.0677
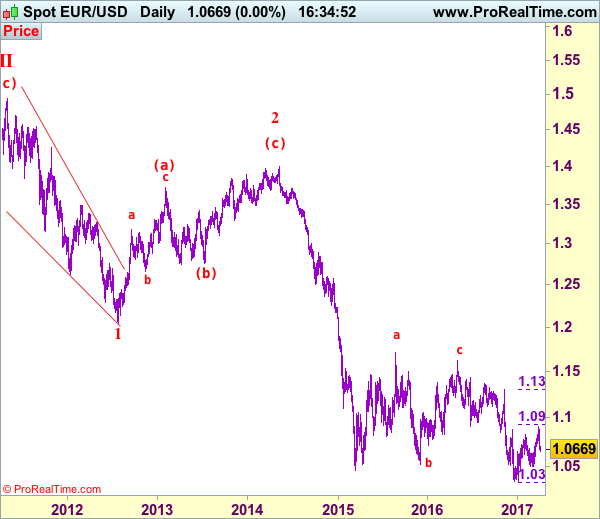
EUR/USD: Wave (c) of 2 ended at 1.3993 and wave 3 of III has commenced for weakness to 1.0411 (1.236 of wave 1), then 1.0000.
Although the single currency opened higher last week and rose to as high as 1.0906, the subsequent selloff dampened our previous bullish view and suggest top is formed there, hence consolidation with downside bias is seen for test of 1.0600, break there would add credence to this view and suggest the erratic rise from 1.0340 has ended at 1.0906, hence further fall to 1.0525 would be seen but a daily close below support at 1.0493 is needed to provide confirmation, bring further decline to 1.0450-55 first.
Our preferred count on the daily chart remains that a wave (II) from 1.2329 ended at 1.5145 with A-leg ended at 1.4720, followed by wave B at 1.2457, the wave C from there was also a 3 legged move and is labeled as (a): 1.3739, (b): 1.2885, the wave iii of the 5-waver (c) from 1.2885 has ended at 1.4339 and wave iv is a triangle ended at 1.3878 and wave v formed a top at 1.5145. The decline from there is a 5-waver (C) with minor wave (i) of I of (C) ended at 1.4218 with wave (ii) ended at 1.4580, wave (iii) ended at 1.3267 and wave (iv) ended at 1.3692 and wave (v) ended at 1.1876, this is also the low of wave I of (C) and wave II ended at 1.4940, hence wave III is now in progress with a diagonal wave 1 ended at 1.2042, the breach of previous support at 1.1876 (wave I trough) adds credence to our view that the wave 2 has ended at 1.3993, wave 3 has commenced for further weakness to 1.0411, then towards 1.0000.
On the upside, whilst initial recovery to 1.0700 cannot be ruled out, reckon upside would be limited to 1.0740-50 and bring another decline. Above 1.0800 would defer and risk a stronger rebound to 1.0870-75 but price should falter below said resistance at 1.0906, bring further choppy trading. Only above 1.0906 would revive near term bullishness and extend the erratic rise from 1.0340 low for retracement of early downtrend to 1.0930-35 (61.8% Fibonacci retracement of 1.1300-1.0340), then 1.1000. Having said that, reckon upside would be limited to 1.1065-70 and price should falter below 1.1100, bring retreat later.
Recommendation: Sell at 1.0750 for 1.0550 with stop above 1.0850.
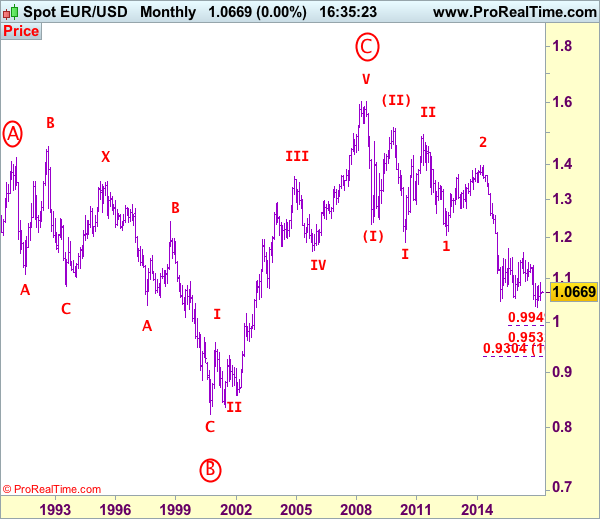
Euro's long-term uptrend started from 0.8228 (26 Oct 2000) with an impulsive structure. The rise from 0.8228 to 0.9593 (5 Jan 2001) is labeled as wave I, the retreat to 0.8352 (6 Jul 2001) is wave II and the rally to 1.3670 (31 Dec 2004) is wave III. Wave IV from there ended at 1.1640 (15 Nov 2005), the subsequent upmove to 1.6040 (July 15, 2008) is treated as wave V, the major selloff from the record high of 1.6040 to 1.2329 (October 27, 2008) signals a reversal has taken place with (I) leg ended at 1.2329 and once (II) ended at 1.5145, wave (III) itself is an extended move with I: 1.1876 and complex wave II ended at 1.4902, wave III has commenced with wave 1 and 2 ended at 1.2042 and 1.3993 respectively, wave 3 of III is now unfolding for weakness towards parity.
USD/JPY Elliott Wave Analysis
USD/JPY - 111.39
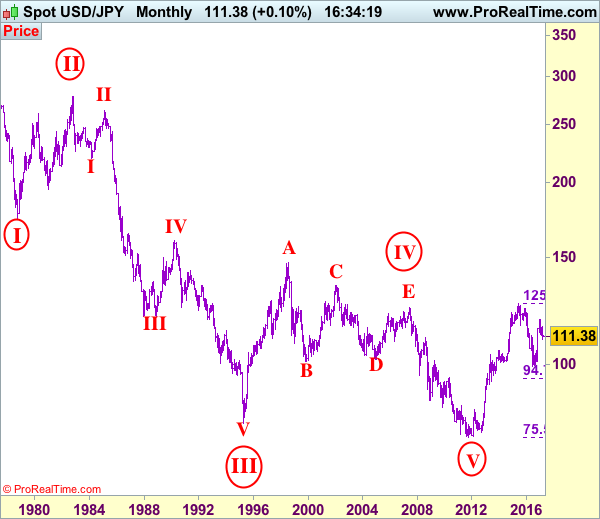
USD/JPY – Wave V of larger degree circle V has possibly ended at 75.31 and major correction has commenced and already met indicated target at 125.00.
As the greenback has recovered after falling to 110.11 early last week, suggesting consolidation above this level would be seen and corrective bounce to 112.20 cannot be ruled out, however, reckon upside would be limited to 112.80-85 and bring another decline later. A break of said support at 110.11 would signal the erratic decline from 118.66 top is still in progress, bring retracement of early upmove to 109.90-95 (50% Fibonacci retracement of 101.19-118.66) and then 109.50 but reckon downside would be limited to 109.00 and price should stay well above 107.85-90 (61.8% Fibonacci retracement), bring rebound later.
Our preferred count is that, triangle wave IV (with circle) ended at 101.45 and the circle wave V brought dollar down to the record low of 75.31 in 2011 and the subsequent rebound signal major correction has commenced with A leg ended at 84.19, followed by wave B at 77.14 and impulsive wave C is now unfolding (indicated upside target at 125.00 had been met) for gain towards 127.00 level. In the event dollar drops below support at 99.01, this would confirm medium term decline from 125.86 top (2015 high) has resumed for subsequent weakness to 98.00 and possibly 97.00.
Under this count, this wave C is unfolding as impulsive waves with (1) (2), 1 2 ended at 80.67, 79.07, 82.84 and 81.69 respectively, hence the extended wave 3 has ended at 103.74 and wave 4 correction of recent upmove should bring weakness to 92.57, then towards 90.88 but psychological support at 90.00 should limit downside and bring another rally later in wave 5, indicated target at 125.00 had been met and gain to 127.00 cannot be ruled out but reckon price would falter below 130.00.
On the upside, whilst initial recovery to 112.20-25 cannot be ruled out, reckon upside would be limited to 112.80-85 and bring another decline later. A daily close above 113.54 would abort and signal low is formed instead, bring a stronger rebound to 114.00-10 and possibly 115.10-20 but resistance at 115.51 should remain intact, bring another decline.
Recommendation: Sell at 112.80 for 110.80 with stop above 113.80.
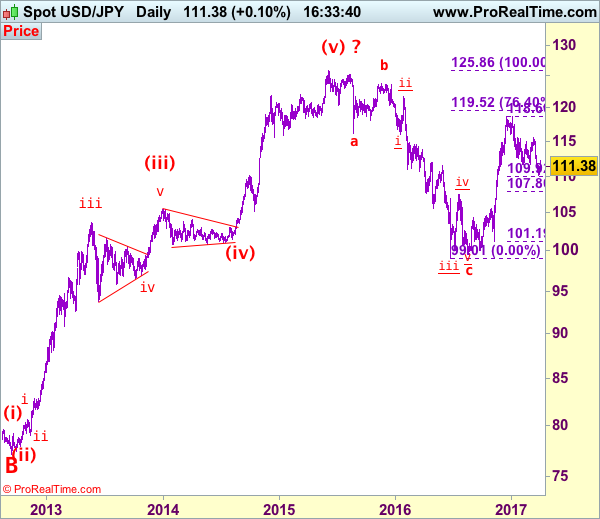
On the monthly chart, we have changed our preferred count that an impulsive wave is unfolding with major wave III with circle ended at 79.75, then followed by wave IV with circle and is labeled as a triangle with A: 147.64 (11 August, 1998), B: 101.25, C: 135.20, D: 101.67 and E leg ended at 124.14 to end the wave IV with circle. Hence, wave V with circle commenced from there and hit a record low of 75.31, however, the subsequent strong rebound signals this circle wave V has possibly ended there, hence gain to (indicated upside target at 122.00 and 125.00 had been met), the retreat from 125.86 suggests wave A of major correction has ended there and wave B correction back to 99.00, then 95.00 would be seen, however, reckon downside would be limited to 90.00, bring another rebound in wave C next year.
British Pound Still Strengthening after Brexit Trigger
We heard overnight that Australian Retail Sales slipped again in February. A 0.1% fall on the month doesn't sound like much, but it is a continuation of a developing trend. Hence, the Reserve Bank of Australia is highly unlikely to change the 1.5% Aussie base rate when they meet tomorrow, in spite of concerns they have expressed over increasingly overheated sectors of the property market. The Aussie Dollar is a cent or so weaker this morning against most other currencies.
Part of the rise in the GBP-AUD rate is driven by Sterling's decent performance since the triggering of Article 50. Spain sneaking a clause about Gibraltar into the EU's opening negotiating stance has got the hackles up in the UK. Clever from the EU and silly from the UK side; who have been wrong-footed by the EU document. Get it together, Theresa and Co.; you'll need to be savvier than that over the next two years. The markets, nonetheless, did give us a sort of relief rally once 'that letter' had been delivered to the EU.
The first week of the month generally brings a plethora of data releases and this one is no exception. Business Confidence Indices abound and there will be a number of employment reports and central banker speeches to boot. The week ends with the traditional 'first Friday of the month' counting of US employees. The expectation is that this will be a positive report and the US Dollar, which has weakened a little over the last few weeks, could well burst forth again.
Friday will also bring the oft overlooked Canadian employment report. That, too, should show employment growth. The Canadian Dollar has the capacity to strengthen on the back of that data…assuming the forecasters have done their sums right.
Welcome to April and have a great week.
At the photo shop
A guy arrives to collect his prints. The technician who had processed them noticed that most were posed snaps of a woman.
"Here you go," says the technician, handing over the prints. "Would you like the negatives?"
"Oh, yes please," says the customer.
"Well her hair's a mess and she should ease up on the eyeliner."
Technical Outlook: EURUSD – Bears Favor Fresh Attempt Through 1.0650 Fibo 61.8% Support After Limited Correction
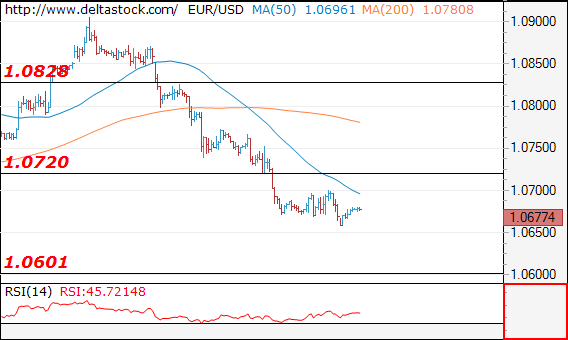
The Euro is consolidating above fresh two-week low at 1.0650, hit last Friday in extension of steep bear-leg from 1.0905 peak. Support at 1.0650 marks Fibo 61.8% of 1.0493/1.0905 rally, close below which would generate bearish signal for test of next strong support at 1.0622 (top of daily Ichimoku cloud/100SMA). Consolidation is so far holding under previous key support at 1.0700 (daily Kijun-sen/base of thick hourly cloud), which is expected to ideally cap upside attempts, before bears resume. Clear break below 1.0650/22 would triggers further bearish acceleration below 1.0600 trough which may attract key short-term support at 1.0500 zone. Strong near-term bears may be delayed on sustained break above 1.0700 barrier that would signal extended correction.
Res: 1.0680, 1.0700, 1.0748, 1.0777
Sup: 1.0650, 1.0622, 1.0600, 1.0583
Trade Idea: EUR/JPY – Sell at 120.40
EUR/JPY - 118.90
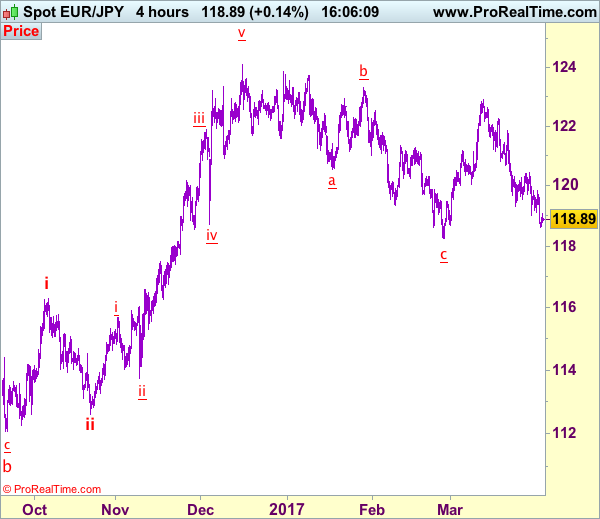
Recent wave: wave v of (C) ended at 94.12 and major correction in wave A has ended at 149.79
Trend: Near term down
Original strategy:
Sell at 120.40, Target: 118.40, Stop: 121.00
Position: -
Target: -
Stop: -
New strategy :
Sell at 120.40, Target: 118.40, Stop: 121.00
Position: -
Target: -
Stop:-
Although the single currency has remained under pressure and the decline from 122.89 top may extend further weakness to 118.50, loss of near term downward momentum should prevent sharp fall below indicated previous chart support at 118.25 and reckon 117.90-00 would hold on first testing, price should stay well above 117.40-50, risk has increased for a corrective rebound to take place soon.
In view of this, would not chase this fall here and would be prudent to sell euro on subsequent rebound as resistance at 120.44 should cap upside and bring another decline. Above 1121.00 would abort and suggest low is possibly formed, risk rebound to 121.50 but resistance at 121.84 should hold from here, bring another decline later.
Our latest preferred count is that wave (ii) is ABC-X-ABC which ended at 123.33 and wave (iii) is unfolding with wave iii ended at 100.77, followed by wave iv at 111.57 and wave v as well as the wave (iii) has ended at 97.04, followed by wave (iv) at 111.43 and wave (v) has ended at 94.12 which is also the end of the larger degree v, this also implied the major wave (C) has also ended there, hence major correction has commenced from there with (A) leg unfolding in its lower degree wave c which has possibly ended at 145.69. Under this count, A-B-C wave (B) has commenced with A leg ended at 136.23, wave B at 143.79 and wave C has possibly ended at 149.79.
Our larger degree count is that the decline from 139.26 is wave (C) and is sub-divided into a diagonal triangle i-ii-iii-iv-v with wave i - 105.44, wave ii- 123.33, wave iii - 97.03, wave iv - 111.43, followed by the final wave v as well as the end of wave (C) at 94.12, this also mark the bottom of larger degree wave B. Under this count, major rise in wave C has commenced as an impulsive wave with minor wave III ended at 145.69, wave V is still in progress for further gain to 150.00. Having said that, this so-called wave V could well be the first leg of larger degree 5-waver wave C and this wave C should bring at least a retest of wave A top at 169.97 (July 2008).
Forex Technical Analysis: EUR/USD, USD/JPY, GBP/USD
EUR/USD
Current level - 10677
My outlook remains negative, for a slide towards 1.0600 support area. Crucial on the upside is 1.0700 high.
| Resistance | Support | ||
| intraday | intraweek | intraday | intraweek |
| 1.0700 | 1.0904 | 1.0600 | 1.0600 |
| 1.0828 | 1.1010 | 1.0490 | 1.0490 |
USD/JPY
Current level - 111.36
The recent slide below 111.45 support zone has neutralized the positive bias and the situation here is neutral. Initial minor resistance lies at 111.70 and key support is projected at 110.70.
| Resistance | Support | ||
| intraday | intraweek | intraday | intraweek |
| 111.70 | 113.50 | 110.70 | 109.75 |
| 112.90 | 115.65 | 111.00 | 107.80 |
GBP/USD
Current level - 1.2544
The intraday bias is positive and only a break through 1.2430 crucial low will reinstate the bearish outlook for 1.2230.
| Resistance | Support | ||
| intraday | intraweek | intraday | intraweek |
| 1.2620 | 1.2620 | 1.2530 | 1.2230 |
| 1.2620 | 1.2705 | 1.2430 | 1.2107 |
Trade Idea: AUD/USD – Stand aside
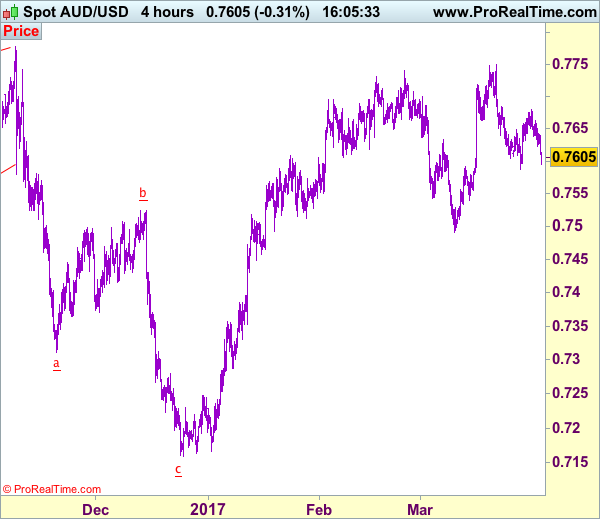
AUD/USD – 0.7602
Recent wave: Wave 5 ended at 1.1081 and major correction has commenced for fall to 0.7000 and then towards 0.6500-10
Trend: Near term up
Original strategy :
Bought at 0.7645, stopped at 0.7605
Position: - Long at 0.7645
Target: -
Stop: - 0.7605
New strategy :
Stand aside
Position: -
Target: -
Stop:-
As aussie met renewed selling interest at 0.7680 last week and has slipped again, dampening our bullishness and test of support at 0.7585 cannot be ruled out, break there would signal top has indeed been formed at 0.7750 last month, bring further fall to 0.7530-40 but indicated support at 0.7491 should remain intact due to near term oversold condition, risk from there is seen for a rebound later.
In view of this, would not chase this fall here and would be prudent to stand aside in the meantime. Above 0.7650 would bring another bounce to 0.7680-85 resistance but break there is needed to revive bullishness and signal low is formed there and bring further gain to 0.7720-25, then retest of said resistance at 0.7750. Looking ahead, above this resistance would extend gain to 0.7778 (last year’s high), however, only break there would extend headway to 0.7840-50.
On the 4-hour chart, the move from 0.8066 is the wave 5 with i: 0.8860, ii: 0.8315, wave iii is an extended move ended at 1.0183, iv: 0.9706 and wave v has ended at 1.1081 (also the top of entire wave 5). The subsequent selloff is the major correction which is unfolding as ABC-X-ABC and 2nd A leg has ended at 0.8848, followed by a-b-c wave B which ended at 0.9758, hence, 2nd C wave is now in progress and indicated downside target at 0.7000 and 0.6950 had been met, so further fall to 0.6710-20 cannot be ruled out.
Reserve Bank of Australia (RBA) to Remain on Hold and Maintain a Neutral Tone
During the Asian morning Tuesday, the Reserve Bank of Australia will announce its rate decision. The forecast is for the RBA to remain on hold once again, a view that we share given that the Bank's latest communications suggested that officials are keen to hold rates unchanged for some time. Even though we got some dovish signals from the latest meeting statement and minutes, those were balanced out by a repetition that high housing prices continue to pose risks to financial stability and that any more rate cuts could amplify such risks further.
Since that gathering, data showed that the unemployment rate rose in February, while retail sales for the same month unexpectedly fell. As such, although we do not expect these data to alter the Bank's overall bias, they tilt the risks towards a somewhat dovish narrative from policymakers. In such a case, we could see the Aussie coming under renewed selling interest.
AUD/USD tumbled during the Asian morning Monday after retail sales for February disappointed. The pair dipped below the 0.7625 (R1) barrier and during the early European morning, it looks to be headed towards the key support zone of 0.7600 (S1). Even though the pair trades within a downward sloping channel since the 17th of March, a clear break below 0.7600 (S1) is needed to confirm a forthcoming lower low on the 4-hour chart and make us more confident on more downside extensions. For now, we expect the rate to settle around that obstacle and wait for the RBA meeting tonight. A dovish tilt by the Bank could prove the trigger for such a dip.
Japan's Tankan survey signals improved business sentiment
The sentiment of Japanese firms improved further in Q1 according to the BoJ's quarterly Tankan business survey. The index measuring the sentiment of large manufacturers rose for a second consecutive quarter, though it missed its forecast, while the large non-manufacturers' figure rose in line with expectations. In our view, these prints are consistent with the BoJ keeping its current policy framework unchanged for the foreseeable future. The gradual improvement in business conditions diminishes the likelihood for any further easing, but the survey was not strong enough to fuel expectations for an eventual end to BoJ stimulus.
With regards to the yen, the currency has strengthened notably in the past weeks, perhaps due to fiscal-year-end demand by Japanese firms trying to repatriate funds. Considering that the fiscal year is officially over, it would be interesting to see whether this move is reversed in the coming weeks.
Another driver of JPY over the coming weeks may be incoming polls with regards to the French election, which have lately shown Le Pen losing ground versus her main rivals. If this continues, we would expect EUR/JPY to recover some of its recent losses, as European political risk diminishes and investors turn away from safe havens.
EUR/JPY traded lower on Friday, falling below the support (now turned into resistance) barrier of 119.10 (R1). The slide was stopped slightly above the key support obstacle of 118.50 (S1). Although the price structure on the 4-hour chart still suggests a short-term downtrend, given our proximity to that key hurdle, we prefer to stand pat for now. The fact that the rate rebounded several times in the past from that zone combined with the aforementioned fundamentals, make us cautious that another recovery may be on the cards. We prefer to wait for a clear close below 118.50 (S1) before we turn our eyes to the downside again.
Today's highlights:
From the UK, we get the manufacturing PMI for March. The forecast is for the index to have remained unchanged, in which case the reaction in GBP could be limited.
In the US, the ISM manufacturing PMI for March is due out. The figure is forecast to decline somewhat, but to still remain well above the 50 barrier that separates expansion from contraction. Although the reaction in USD may be negative, given that the index is expected to remain at a healthy level, we don't expect such a reaction to be major.
As for the rest of the week:
On Tuesday, during the Asian session, the RBA rate decision will be in focus, as we outlined above. On Wednesday, we get the US ADP employment report for March and later during the day, the Fed will release the minutes of the March FOMC meeting. On Thursday, we have a relatively light day, while on Friday, the US employment report for March will take center stage. We also get employment data for March from Canada.
AUD/USD
Support: 0.7600 (S1), 0.7580 (S2), 0.7550 (S3)
Resistance: 0.7625 (R1), 0.7650 (R2), 0.7680 (R3)
EUR/JPY
Support: 118.50 (S1), 117.70 (S2), 116.50 (S3)
Resistance: 119.10 (R1), 119.80 (R2), 120.35 (R3)