Sample Category Title
ECB Praet Said Probability of Additional Easing Reduced, Euro Shrugs and Stays Weak
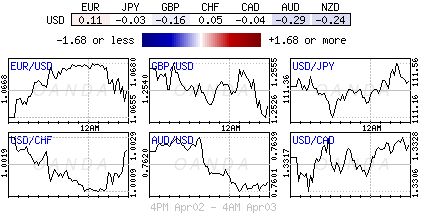
Movements in the forex markets are very limited today. Sterling dips mildly after PMI manufacturing missed expectation. Euro stays soft in general even though comments from policy makers should be Euro supportive. Aussie weakened earlier in the day on retail sales disappointment but no follow through selling is seen so far. Yen stays in tight range after uninspiring release of Tankan survey. Dollar on the other hand, trades mixed as markets await ISM indices and employment data later in the week, as well as FOMC minutes. In other markets, Gold continues to struggle in tight range around 1250. WTI crude oil is staying firm above 50 handle but can't extend gains so far.
ECB chief economist Praet: Probability of additional easing reduced considerably
ECB chief economist Peter Praet said in an interview that policy makers are "more confident that the economic expansion will continue to firm and broaden." However, "underlying inflation, which is an indicator of price stability over the medium term, remains subdued." And, could inflation head back to target without the current "expansionary monetary policy"? Praet's answer was "no". Nonetheless, the "probability" for additional stimulus "has reduced considerably". On the other hand, ECB executive board member Benoit Coeure said today that "the financial sector and the economy and states should prepare for an environment of higher rates." And he warned again that "negative rates were very effective but they shouldn't go on for too long as that penalizes the banking sector".
UK manufacturing growth slowed
UK PMI manufacturing dropped to 54.2 in March, down from 54.6, below expectation of 55.0. That's the third straight decline in a row. Markit noted that "UK manufacturers continued to benefit from solid inflows of new business". And, "part of the increase in new orders reflected further growth of foreign demand." However, "high costs and weak wage growth are sapping the strength of consumers, with rates of expansion in output and new orders for these (consumer) products slowing further." Overall, "the outlook for the sector also remained positive, with business optimism rising to a ten-month high."
Also released from Europe, Eurozone PPI rose 0.0% mom, 4.5% yoy in February. Eurozone manufacturing PMI was finalized at 56.2 in March, unrevised. Swiss SVME PMI rose to 58.6 in March, above expectation of 58.0. Swiss retail sales rose 0.6% yoy in February, better than expectation of -0.8% yoy fall.
Japan Business Sentiment Improved in First Quarter, but Outlook Not as Bright
Japan released its quarterly Tankan survey earlier today. The large manufacturer DI improved to 12 in 1Q17, from 10 in the prior quarter. However, this missed expectations of a bigger improvement to 14. The large non-manufacturer DI rose to 20, compared with consensus of 19% and 4Q16's 18, mainly driven by higher confidence in services and construction sectors. Note the pickup in sentiment was modest given the depreciation in Japanese yen (USDJPY rallied) during the period. For SMEs, the manufacturer DI added 4 points to 5 while the non-manufacturer DI doubled to 4, during the period. The DI for all industry and all firms gained 3 points to 10.
Corporate confidence over the coming 3 months, however, deteriorated. The large manufacturer expectations DI was +11 while that for non-manufacturers was 16. The former marked an improvement from the previous reading but signaled deterioration from the current conditions. The expectations DI for all firms, at +4, also dropped -5 points from the current conditions DI. On the capex plan outlook, large companies projected a 0.6% yoy increase for FY17, compared with a -0.9% contracted for the same period last year, suggesting that the sentiment in large companies has improved this year. BOJ's USDJPY assumption for large manufacturers came in at 108.43, up from 104.9 for FY16 in 4Q16 survey. USDJPY currently is trading around 111.
Aussie dives after weak retail sales
Australian dollar tumbles sharply today after weaker than expected retail sales. Sales dropped -0.1% mom in February versus expectation of 0.3% rise. Apparels was the biggest drag in sales, posting -2.5% mom fall. Meanwhile, sales of household goods dropped -0.4%. Executive director of the Australian Retailers Association noted that "discretionary spend" is showing impact in the data. Also from Australia TD securities inflation expectation rose 0.1% mom in March. Building approvals jumped 8.3% mom in February.
RBA rate decision is a main focus tomorrow and the central bank is widely expected to keep interest rate unchanged at 1.50%. There is little prospect of a rate cut this year as housing markets heat up again in recent months. Little new information would be given from this week's meeting as RBA would wait for the set of Q1 data to be released later before adjusting economic outlook. But for the moment, some notable weakness is seen in Aussie broadly.
EUR/USD Mid-Day Outlook
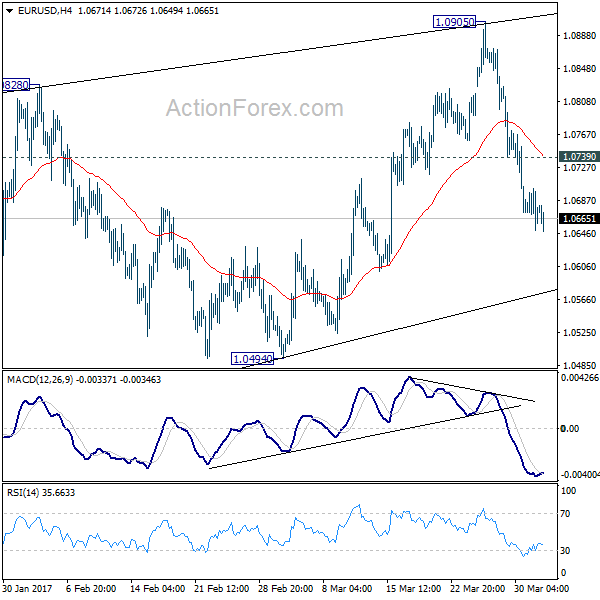
Daily Pivots: (S1) 1.0632; (P) 1.0666 (R1) 1.0687; More....
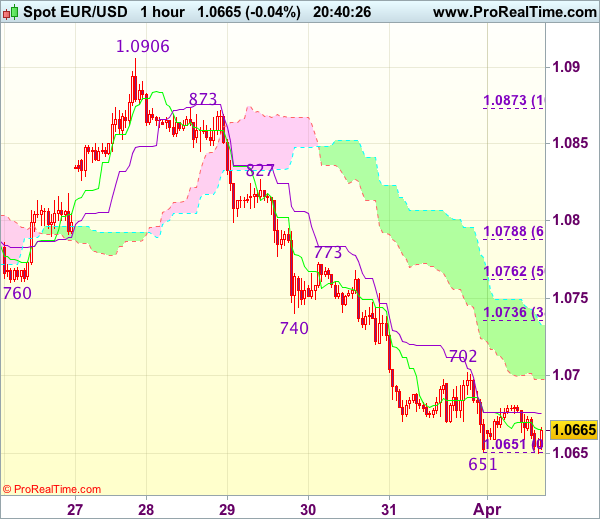
With 1.0739 minor resistance intact, intraday bias in EUR/USD remains on the downside for 1.0494 support. We're holding on to the view that corrective rise from 1.0339 is completed at 1.0905. And, larger down trend is probably resuming. Break of 1.0494 should confirm this bearish case and target 1.0339 low and below. Break of 1.0339 will target parity next. On the upside, above 1.0739 minor resistance will delay the bearish case and turn focus back to 1.0905 resistance instead.
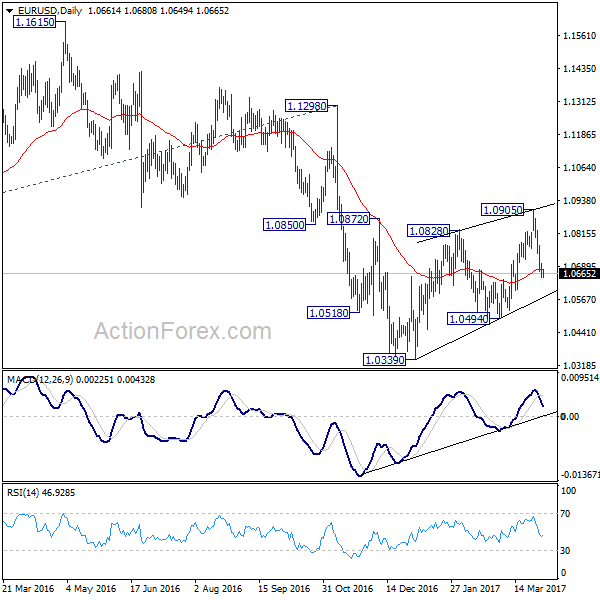
In the bigger picture, as long as 1.1298 key resistance holds, whole down trend from 1.6039 (2008 high) is still expected to continue. Break of 1.0339 low will send EUR/USD through parity to 61.8% projection of 1.3993 to 1.0461 from 1.1298 at 0.9115. However, considering bullish convergence condition in weekly MACD, break of 1.1298 will indicate term reversal. this would also be supported by sustained trading above 55 week EMA.
Economic Indicators Update
| GMT | Ccy | Events | Actual | Forecast | Previous | Revised |
|---|---|---|---|---|---|---|
| 23:50 | JPY | Tankan Large Manufacturers Index Q1 | 12 | 14 | 10 | |
| 23:50 | JPY | Tankan Large Manufacturers Outlook Q1 | 11 | 13 | 8 | |
| 23:50 | JPY | Tankan Non-Manufacturing Index Q1 | 20 | 19 | 18 | |
| 23:50 | JPY | Tankan Non-Manufacturing Outlook Q1 | 16 | 19 | 16 | |
| 23:50 | JPY | Tankan Large All Industry Capex Q1 | 0.60% | -0.30% | 5.50% | |
| 23:50 | JPY | Tankan Small Mfg Index Q1 | 5 | 3 | 1 | |
| 23:50 | JPY | Tankan Small Mfg Outlook Q1 | 0 | 1 | -4 | |
| 23:50 | JPY | Tankan Small Non-Mfg Index Q1 | 4 | 2 | 2 | |
| 23:50 | JPY | Tankan Small Non-Mfg Outlook Q1 | -1 | -1 | -2 | |
| 0:30 | JPY | PMI Manufacturing Mar F | 52.4 | 52.6 | 52.6 | |
| 1:00 | AUD | TD Securities Inflation M/M Mar | 0.10% | -0.30% | ||
| 1:30 | AUD | Retail Sales M/M Feb | -0.10% | 0.30% | 0.40% | |
| 1:30 | AUD | Building Approvals M/M Feb | 8.30% | -1.50% | 1.80% | |
| 7:15 | CHF | Retail Sales (Real) Y/Y Feb | 0.60% | -0.80% | -1.40% | |
| 7:30 | CHF | SVME PMI Mar | 58.6 | 58 | 57.8 | |
| 7:45 | EUR | Italy Manufacturing PMI Mar | 55.7 | 55.1 | 55 | |
| 7:50 | EUR | France Manufacturing PMI Mar F | 53.3 | 53.4 | 53.4 | |
| 7:55 | EUR | Germany Manufacturing PMI Mar F | 58.3 | 58.3 | 58.3 | |
| 8:00 | EUR | Eurozone Manufacturing PMI Mar F | 56.2 | 56.2 | 56.2 | |
| 8:30 | GBP | PMI Manufacturing Mar | 54.2 | 55 | 54.6 | 54.5 |
| 9:00 | EUR | Eurozone PPI M/M Feb | 0.00% | 0.10% | 0.70% | 1.10% |
| 9:00 | EUR | Eurozone PPI Y/Y Feb | 4.50% | 4.30% | 3.50% | 3.90% |
| 9:00 | EUR | Eurozone Unemployment Rate Feb | 9.50% | 9.50% | 9.60% | |
| 14:00 | USD | ISM Manufacturing Mar | 57.1 | 57.7 | ||
| 14:00 | USD | ISM Prices Paid Mar | 66 | 68 | ||
| 14:00 | USD | Construction Spending M/M Feb | 1.00% | -1.00% |
Trade Idea Update: GBP/USD – Stand aside
GBP/USD - 1.2498
New strategy :
Stand aside
Position : -
Target : -
Stop : -
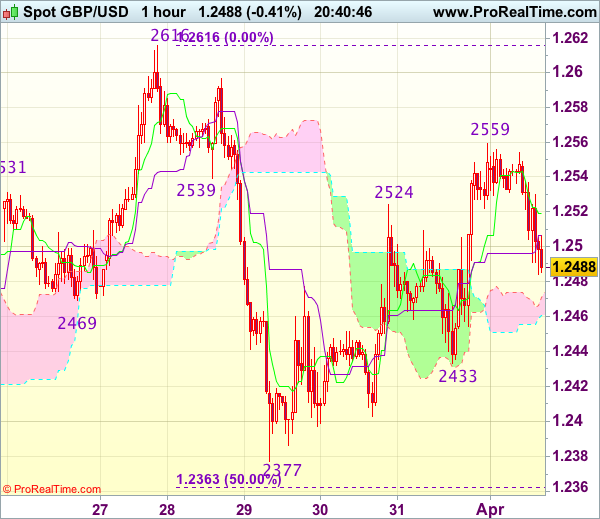
As cable found good support at 1.2433 on Friday and staged another strong rebound on active cross-trading in sterling, suggesting the erratic rise from 1.2377 (last week’s low) is still in progress and may extend gain towards 1.2570-75, however, as broad outlook remains consolidative, reckon upside would be limited to 1.2595-00 and price should falter below last week’s high at 1.2616, bring retreat later.
In view of this, would not chase this rise here and would be prudent to stand aside in the meantime. Below 1.2480 would bring weakness to the upper Kumo (now at 1.2469) but said support at 1.2433 should remain intact. Only a drop below 1.2433 support would revive bearishness and suggest the rebound from 1.2377 has ended, bring weakness to 1.2400, break there would confirm and retest of 1.2377 would follow.
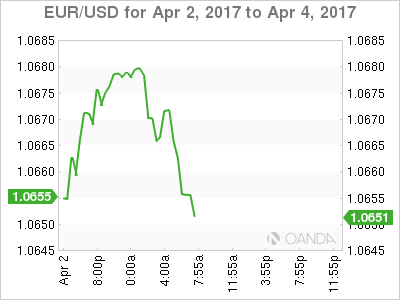
Trade Idea Update: EUR/USD – Sell at 1.0740
EUR/USD - 1.0668
Original strategy :
Sell at 1.0740, Target: 1.0625, Stop: 1.0775
Position : -
Target : -
Stop : -
New strategy :
Sell at 1.0740, Target: 1.0625, Stop: 1.0775
Position : -
Target : -
Stop : -
As the single currency has remained under pressure after last week’s selloff, suggesting the decline from 1.0906 top is still in progress and bearishness remains for this fall to extend further weakness to 1.0620-25, then test of previous chart support at 1.0600, however, a sustained breach below the latter level is needed to retain downside bias for subsequent selloff to 1.0570-75 first, otherwise, risk from there is seen for a rebound later.
In view of this, would not chase this fall here and would be prudent to sell dollar on recovery as 1.0735-40 should limit upside. Only a firm break above resistance at 1.0773 would suggest low is formed instead, bring a stronger rebound to 1.0800 but resistance at 1.0827 should remain intact.
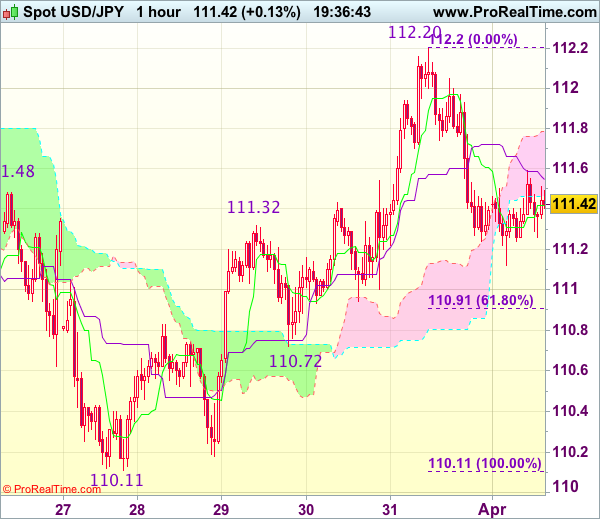
Trade Idea Update: USD/JPY – Stand aside
USD/JPY - 111.39
New strategy :
Stand aside
Position : -
Target : -
Stop : -
Dollar’s retreat after last week’s strong rebound to 112.20 suggests top has possibly been formed there and consolidation with mild downside bias is seen for weakness to 110.91-94 (61.8% Fibonacci retracement of 110.11-112.20 and previous support), however, break there is needed to add credence to this view, bring further fall to support at 110.72, once this level is penetrated, this would signal the rebound from 110.11 has ended and further decline to 110.50 would follow.
In view of this, would not chase this fall here and would be prudent to stand aside in the meantime. Above 111.75-80 would bring recovery to 112.00-05 but price should falter below resistance at 112.20, bring further consolidation. Only break of 112.20 would revive bullishness and extend the rise from 110.11 low to 112.50-55 but price should falter below previous resistance at 112.87-90, bring retreat later.
Forex Markets Enter Q2 on a Mellow Note
Global stocks traded mildly higher on Monday as investors re-accessed both the health of the global economy and major market themes for the second quarter of 2017. Although a sense of caution lingered across the board ahead of a data-packed week, Asian shares remained resilient with most stocks strolling into the green territory. While the moderate appetite for risk has supported European equities, gains on Wall Street could be limited if market participants decide to observe the action from a safe distance. Much attention will be directed towards Donald Trump's pending meeting with Chinese President Xi Jinping which may be classified as an event risk. Any complications or tension in the meeting could spark risk aversion consequently pressuring stock markets while boosting attraction for safe-haven assets.
Dollar Index hovering around 100.50
The Greenback cruised into the second quarter of 2017 with style as bulls propelled prices towards 100.60 amid the positive sentiment towards the U.S economy. While the upside momentum that has elevated prices back above the 100.00 psychological level is undeniably impressive, questions may be asked if the rally is sustainable. The expectations over US rate hike timings have heavily impacted the Dollar with investors desperately seeking further clarity on when rates will be hiked again. While the Greenback could trade higher from the improving confidence towards the US economy, participants remain somewhat cautious over Trump's protectionist measures and the threat of his market shaking policies falling below expectations.
When accessing the Dollar from an aerial view, the currency is engaged in a fierce tug of war between the Fed and Trump with no clear winner in sight. Focusing on today, a positive ISM Manufacturing PMI figure could encourage bullish investors to propel the Dollar Index back above 100.60.
Brexit season 3: Negotiations get under way
Sterling/Dollar has been erratic, volatile and range bound since the official invocation of Article 50 last week with resistance around 1.2570 and support at 1.2370. Now that the European Union has shared the draft guidelines on the future of the UK relationship after Brexit, investors are now waiting for the next key steps. It seems that the EU may be willing to play hardball in the negotiations, especially after rejecting Theresa May's Brexit timetable and demanding for a divorce settlement before any future trade deals are discussed. With uncertainty still a certainty when dealing with Brexit, Sterling may be exposed to further downside shocks. If bears manage to drag the GBPUSD back below 1.2370, a decline towards 1.2200 remains a live possibility.
On the other hand, a breakout above 1.2570 could trigger a further incline towards 1.2650.
Currency spotlight - EURUSD
The EURUSD found itself under fresh selling pressure on Monday as the lingering political uncertainty in Europe created a foundation for sellers to attack. With optimism diminishing over the ECB raising interest rates fueling the downside momentum, the EURUSD could be poised to descend much lower. Last week's rejection from the 1.0900 resistance has given bears the green light to install repeated rounds of selling. From a technical standpoint, previous support around 1.0700 could transform into a dynamic resistance that encourages a decline towards 1.0500.
UK Manufacturing Sector Still Optimistic Despite Slowing Growth
UK Manufacturing Sector Still Optimistic Despite Slowing Growth
The UK manufacturing sector slowed in March 2017, but performance remains strong and figures remain above average.
The latest Markit/CIPS UK Manufacturing Purchasing Managers' Index (PMI) posted at 54.2 in March 2017, lower than February's figure of 54.6; displaying a slowdown in output and new order growth since the record results seen at the end of 2016.
"Growth rates in the sector have cooled somewhat since the record figures at the end of 2016 and the strong results seen at the start of the year, but are still well above longer-term trends and reflect a solid performance in uncertain times and in defiance of the naysayers," comments David Johnson, Director at currency specialists, Halo Financial.
Johnson goes on to say, "Rates of growth in the industry remain above average, which is a positive sign, and shows the resilience of the UK manufacturing industry."
New business
New business came mostly from the domestic market, with a weak Pound once again helping to boost exports. The industry continues to see plenty of new orders coming in, noting continued growth in overseas demand.
Production growth
The increase in UK manufacturing production slowed for the first time in nine months, with consumer goods producers the most affected, demonstrating only small levels of output growth. This is in contrast to February 2017, when consumer goods noted a positive increase in new orders. The intermediate and investment goods sectors, who saw significant growth in February, continued to see improvement and again recorded a significant boost in the last month.
Still a positive outlook for the UK manufacturing industry
The outlook for the industry remains positive, with rising business confidence at the highest level for almost a year. Attitudes remain positive and demonstrate an upturn in optimism since February, with over 50 percent of companies now predicting an increase in production over the coming year, and only six percent forecasting a slowdown.
A positive outlook has contributed to employment in the UK manufacturing sector, with headcounts rising for the eighth month in a row in both SMEs and larger businesses. Jobs growth has increased at the fastest pace for a year-and-a-half.
Price pressures still a concern
Price pressures remain an issue for the sector, with costs elevated throughout March and output charge inflation on the up, edging closer to the record high recorded in January 2017. This was largely due to the increased costs of raw materials pushing up vending prices. Input costs grew at one of the fastest rates since the survey began, although this has weakened over the last six months. Manufacturers cited the weak Pound and ever-increasing commodity prices as the reasons for increasing costs, in addition to the knock-on effects of supply chain pressures, with vendor led times at the longest for nearly six years.
Atul Kariya, National Sector Head of Manufacturing and Engineering at MHA Macintyre Hudson, commented,
"The real concerns for UK manufacturers in the current marketplace are the cost pressures – from uncertain currency markets, increasing commodity prices, and additional costs across the supply chain."
"Lack of certainty about whether these costs can be passed on to customers means that manufacturers are having to look inwardly at their processes and business models to find efficiencies wherever possible."
David Johnson observed, "I'm delighted to see continued confidence in the UK manufacturing sector. In the face of the ever-evolving European political and economic landscape, volatile exchange rates and continued uncertainty around the UK's Brexit negotiations with the EU and its other key trading partners, such optimism is very encouraging indeed and yet Sterling is only just starting to reflect that."
"As we have warned before, rising price pressures across industry could dampen the sector's enthusiasm and performance, so this needs to be watched carefully and taken into consideration in both business and currency planning."
Eurozone Manufacturing Industry at a Six-Year High and Still Growing
Markit Eurozone Manufacturing Purchasing Managers' Index (PMI) data released today shows a continued upturn in the sector, now at a six-year high and counting... Figures show a particular boost in Germany, Austria and the Netherlands.
Final PMI figures were posted at 56.2 in March 2017, a considerable rise from February's results at 55.4 and demonstrating remarkable growth since January's figure of 55.2. This month's report shows the fastest growth in manufacturing production and new orders for six years, as manufacturers gained more work from both within and outside the Eurozone. However, the threat of inflation and increasing cost pressures remain.
The most growth was seen in Germany, Austria and the Netherlands, while Italy and France also reported good results, with a faster pace of expansion. Spain and Ireland saw a slowing of growth in the latest report, as Greece's woes continue, reflected in their poor performance.
More new export business
Euro area manufacturers saw continued growth in new export business across all countries, bar Greece, as export orders grew for 45 months in a row, signalling a six-year high in growth rate. Germany and France led the way in export expansion at over six-year and three month highs, respectively. Italy also saw export growth expand the fastest for a year-and-a-half.
Price pressures still an issue for the industry
Price pressures are still high as we move into April, still rising at a similar rate to the close to six-year highs we saw in February. This has caused a dramatic increase in prices at the factory gate, again, rising the fastest for almost six years.
The fluctuations in the rate of the Euro against its major trading partners and the increasing price of commodities were cited as the key reasons for increasing costs and pricing pressures.
The report also noted better seller pricing power and its contribution to rising costs throughout March.
Vendor delivery times - a key indicator for the health of the industry - grew longer once again in March, the biggest difference seen for nearly six years. This has meant vendors increasing their prices.
Jobs growth continues, although slower in some regions
In March, there was improvement in jobs growth in Germany, Austria, Italy and Ireland, with slower increases noted in Spain and the Netherlands. This time around, France only saw small levels of employment growth.
"We warned of rising pricing pressures following the previous reports over the last quarter," comments David Johnson, Director at currency specialists, Halo Financial.
"All the pieces of the puzzle seem to be in place to engender growth, such as more new orders coming through, increasing output, exports increasing and growth in employment. These levels are running at six-year highs, which bodes well for the Eurozone's manufacturing sector."
"However, while it's great to see this continued boost in performance, there are warning signs for the industry in the form of inflationary pressures and lagging vendor delivery times - both key elements to keep the European manufacturing industry growing and increasing in productivity."
"Markets will be keeping a close eye on these indicators and how the volatile exchange rates are affecting the industry's performance, which reflects the health of the wider economy."
Neil Lloyd, Sales Director at manufacturing legal experts, FBC Manby Bowdler, commented,
"Despite all the political uncertainty, it's pleasing to see that Eurozone Manufacturers continue to perform well, driven along by strong export demand, and helped in part by the relatively low euro exchange rate."
"There are plenty of good stories across the Eurozone, including increased production and increased job creation, which now stands at a six year high. Purchasing costs are still a concern, with the average vendor delivery times lengthening and inflationary pressures are as prevalent as always."
Eurozone Manufacturing PMI - March 017
- Germany 58.3 (flash: 58.3) 71-month high
- Netherlands 57.8 2-month low
- Austria 56.8 3-month low
- Italy 55.7 72-month high
- Spain 53.9 5-month low
- Ireland 53.6 5-month low
- France 53.3 (flash: 53.4) 2-month high
- Greece 46.7 2-month low
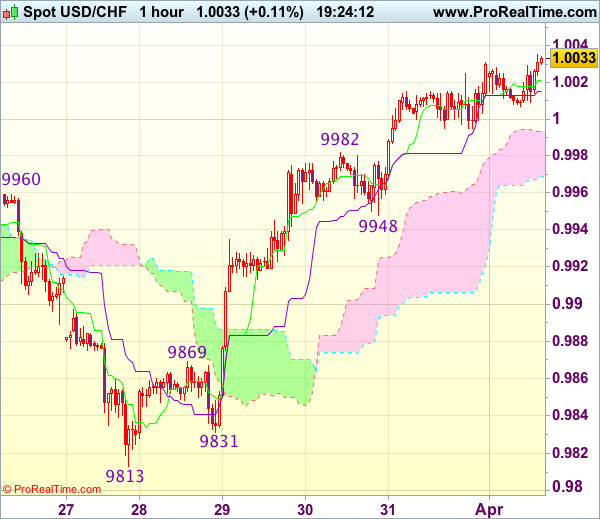
Trade Idea Update: USD/CHF – Buy at 0.9950
USD/CHF - 1.0031
Original strategy :
Buy at 0.9950, Target: 1.0050, Stop: 0.9915
Position : -
Target : -
Stop : -
New strategy :
Buy at 0.9950, Target: 1.0050, Stop: 0.9915
Position : -
Target : -
Stop : -
As the greenback has continued trading with a firm undertone, suggesting recent rise from last week’s low at 0.9813 is still in progress and bullishness remains for this move to extend gain to previous support at 1.0060 (now resistance), however, loss of upward momentum should prevent sharp move beyond resistance at 1.0109, risk from there has increased for a retreat to take place later.
In view of this, would not chase this rise here and would be prudent to buy dollar on pullback as said support at 0.9948 should limit downside. Below 0.9931 (50% Fibonacci retracement of 0.9831-1.0031) would abort and signal top is formed instead, bring correction to 0.9905-10 (61.8% Fibonacci retracement) but reckon previous resistance at 0.9869 would hold from here.
Trade Idea Update: GBP/USD – Stand aside
GBP/USD - 1.2505
New strategy :
Stand aside
Position : -
Target : -
Stop : -
As cable found good support at 1.2433 on Friday and staged another strong rebound on active cross-trading in sterling, suggesting the erratic rise from 1.2377 (last week’s low) is still in progress and may extend gain towards 1.2570-75, however, as broad outlook remains consolidative, reckon upside would be limited to 1.2595-00 and price should falter below last week’s high at 1.2616, bring retreat later.
In view of this, would not chase this rise here and would be prudent to stand aside in the meantime. Below 1.2480 would bring weakness to the upper Kumo (now at 1.2469) but said support at 1.2433 should remain intact. Only a drop below 1.2433 support would revive bearishness and suggest the rebound from 1.2377 has ended, bring weakness to 1.2400, break there would confirm and retest of 1.2377 would follow.

Stocks and Dollar Starting Q2 on a Positive Note
Monday April 3: Five things the markets are talking about
Global stocks and the "mighty" dollar are starting Q2 on a positive note despite investor caution ahead of the first "superpower" meeting between U.S President Trump and China's Xi Jinping (April 6-7).
To investors, the markets "reflation" trade remains a concern, especially now that President Trump's failed to push through his healthcare act in March. Can Trump get support for his anticipated tax cuts and infrastructure spending bills?
In Europe, the market focus will be on the French Presidential election. Will Marine Le Pen and her ideologies have an influence on government yields and the single unit, or will Macron squash her beliefs in round two?
On the data front this week is a busy week for central banks. The Reserve Bank of India (RBI) and the Reserve Bank of Australia (RBA) announce their respective rate decisions (Tues). The Federal Open Market Committee (FOMC) publishes their minutes (Wed) from its most recent meeting where they increased the fed funds rate by +25 bps.
Elsewhere, manufacturing, services and composite PMI's will be released globally. On Friday, Canada delivers its March labor market survey while the U.S announces its latest non-farm payroll (NFP) report.
1. Global stocks start Q2 on firmer footing
Q1 was the best quarter for global equities in four-years.
In Japan overnight, stocks prices rebounded after the BoJ 'Tankan' report showed an improving outlook among their countries' largest firms. The Nikkei's gained +0.4%, while the broader Topix added +0.3%.
Note: Business sentiment improved for a second straight quarter to an 18-month high in March, but was slightly lower than market expectations.
In Hong Kong, stocks rallied led by infrastructure plays on the news that China will set up an economic zone. The benchmark Hang Seng index, which fell on Thursday and Friday, gained +0.6%, while the HK China Enterprises Index edged up +0.4%.
Elsewhere, South Korea's Kospi and Singapore's Straits Times Index were each up +0.3%, while Jakarta's Composite climbed +0.6%.
In Europe, ahead of the U.S open, the Eurostoxx has climbed +0.2% in early trade after increasing +5.5% in Q1, the best quarter in two-years.
U.S stocks are set to open in the red (-0.2%).
Indices: Stoxx50 flat at 3,499, FTSE flat at 7,320, DAX +0.2% at 12,341, CAC-40 -0.1% at 5,116, IBEX-35 -0.3% at 10,431, FTSE MIB -0.2% at 20,459, SMI +0.2% at 8,671, S&P 500 Futures -0.2%
2. Oil prices nudge higher on upbeat economic sentiment
Oil prices start the week in the black as upbeat sentiment about economic prospects in Asia and Europe outweighed concerns a higher U.S. rig count strengthened worries about global oversupply.
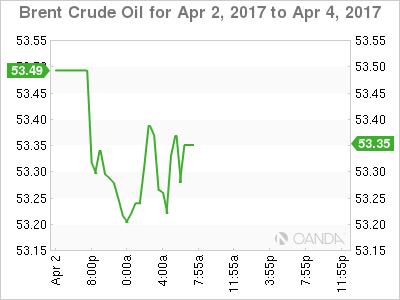
Brent futures are up +3c, or +0.1% to +$53.56 a barrel, while U.S West Texas Intermediate (WTI) crude futures climbed +10c, or +0.2% to $50.70 a barrel after settling +25c higher on Friday.
Note: Brent and U.S crude posted their worst quarterly loss in two-years in Q1. U.S futures fell -6%, while Brent lost -7% as rising inventory levels outpaced output cuts by OPEC and non-OPEC members.
Crude prices rallied last week amid expectations that OPEC would extend production cuts beyond June. However, prices were capped after energy services firm Baker Hughes said the U.S rig count increased by 10 to 662 last week, making the first quarter the strongest for oil rig additions since mid-2011.
The market continues to look for additional indicators for overall direction.
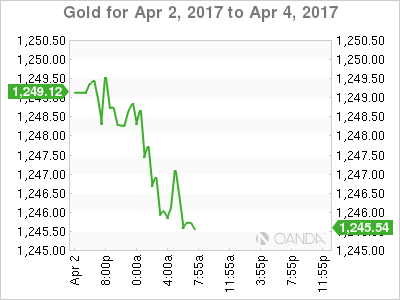
Gold prices have started the week on the back foot (-0.2% to +$1,246.84 per ounce), pressured by a stronger dollar and investor profit taking.
Note: The 'yellow' metal has been stuck between +$1,238-$1,260 with the risk skewed to downside based on rising expected interest rates and failure to break higher.
3. Eurozone periphery yields spike
Government bond yields in the euro zone's lower-rated countries (Spain, Italy and Portugal) have backed up this morning and are underperforming their peers as a reduction in the ECB bond purchase program takes effect.
April marks the beginning of the scaling back of the ECB's bond buying purchases from +€80B to +€60B per month until the program ends in Dec.
Note: Various ECB speakers noted last week that this process not any signaling the start of tapering as it had the option to be more expansionary if needed.
The yield gap between Portugal's 10-year bond and the German Bund have hit a four-week high of +368 bps, up +4 bps.
Note: French and peripheral bond yields have risen in recent months on the outside chance that far-right leader Marine Le Pen would win Franc's Presidential race and push for a French exit from the E.U.
The yield on U.S 10's has backed up +1 bps to +2.40%, after dropping -3 bps on Friday.
4. Dollar finds support
Ahead of the U.S open, the pound (£1.2508, down -0.37%) continues to experience volatility, as the pair has given back roughly half of last Friday's gain, as selling has taken place following the release of U.K PMI data (54.4 from a revised 54.5 in Feb.) The reading for March was below consensus expectations of 54.6 and the lowest reading for four-months.
The EUR (€1.0656) is little changed despite stable industrial prices in the region and a stronger unemployment print (+9.5% vs. +9.6%). The yen fell -0.1% to ¥111.47, while the AUD lost -0.3%. The KRW rose +0.3%, building on its more than +7% advance in the Q1.
5. Global data shows mixed results
Reports this morning showed that German manufacturing growth reached a six-year high in March (PMI 58.3). Along with a stronger France and Italian headline print, adds to signs of a pickup in momentum in the region and the global economy.
On the weekend, a private survey on China's manufacturing came in below market expectations (51.2 vs. 51.7), but still showed a healthy expansion after a similar survey by the government last Friday pointed to strong growth in the sector.
In Japan, the Bank of Japan's "tankan" survey showed that business sentiment improved, albeit slightly less than expected (12 vs. 14). Down-under, Aussie retail sales disappointed (-0.1% v +0.3% e).