
Sample Category Title
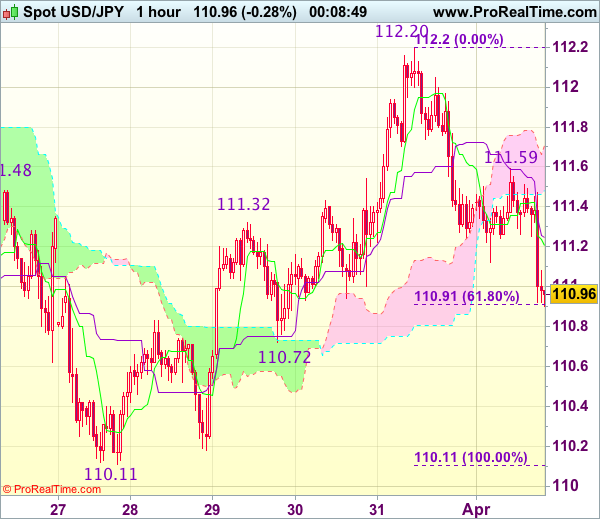
Trade Idea Wrap-up: USD/JPY – Stand aside
USD/JPY - 111.02
Most recent candlesticks pattern : N/A
Trend : Near term up
Tenkan-Sen level : 111.21
Kijun-Sen level : 111.25
Ichimoku cloud top : 111.71
Ichimoku cloud bottom : 111.48
New strategy :
Stand aside
Position : -
Target : -
Stop : -
As the greenback has fallen again on renewed cross-buying in yen, adding credence to our view that top has been formed at 112.20 last week and consolidation with mild downside bias remains for test of previous support at 110.72, however, near term oversold condition should limit downside to 110.50 and price should stay well above support at 110.11, bring rebound later.
In view of this, would not chase this fall here and would be prudent to stand aside in the meantime. Above the Kijun-Sen (now at 111.25) would bring recovery to 111.45-50 but break of intra-day resistance at 111.59 is needed to signal low is formed, bring a stronger rebound to 111.90-00 later.
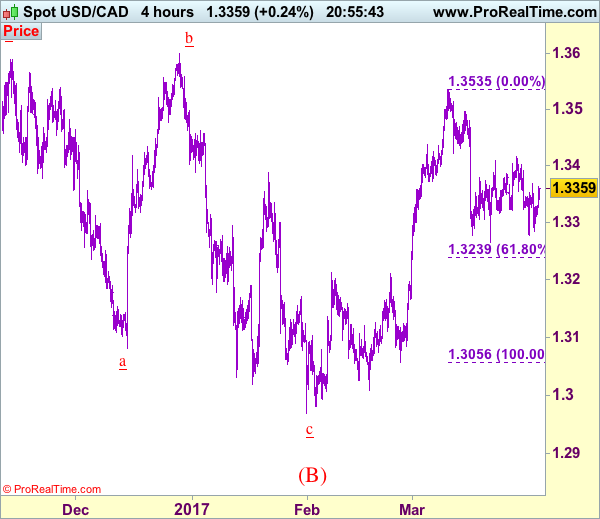
Trade Idea: USD/CAD – Exit short entered at 1.3340
USD/CAD - 1.3359
Recent wave: Only wave v of c has ended at 0.9407 and wave C of major A-B-C correction is underway for headway to 1.4700
Trend: Near term up
Original strategy :
Sold at 1.3340, Target: 1.3200, Stop: 1.3400
Position: - Short at 1.3340
Target: - 1.3200
Stop: - 1.3400
New strategy :
Exit short entered at 1.3340, Target: 1.3200, Stop: 1.3400
Position: - Short at 1.3340
Target: -
Stop:-
As the greenback has rebounded again after holding above indicated previous support at 1.3264, suggesting further consolidation would be seen, however, reckon upside would be limited and as long as resistance at 1.3415 holds, mild downside bias remains for another decline, below said support at 1.3264 would add credence to our view that top has been made at 1.3535 earlier this month, bring further fall to 1.3235-40 (61.8% Fibonacci retracement of 1.3056-1.3535) and then 1.3200-10, however, oversold condition should limit downside and reckon 1.3170 would hold from here.
In view of this, would be prudent to exit short entered at 1.3340. Above said resistance at 1.3415 would signal low is formed and shift risk back to upside for a stronger rebound to 1.3450 and possibly test of resistance at 1.3479, however, only break of 1.3495 resistance would indicate the pullback from 1.3535 has ended and bring retest of this level later.
To recap, wave B from 1.3066 is unfolding as an a-b-c and is sub-divided as a: 1.2192, b: 1.2716 and wave c is a 5-waver with i: 1.1983, ii: 1.2506, extended wave iii with minor iii at 1.0206, wave iv ended at 1.0781 and wave v as well as wave iii has ended at 0.9931, hence the subsequent choppy trading is the wave iv which is unfolding as (a)-(b)-(c) with (a) leg of iv ended at 1.0854, followed by (b) leg at 1.0108 and (c) leg as well as the wave iv ended at 1.0674. The wave v is sub-divided by minor wave (i): 0.9980, (ii): 1.0374, (iii): 0.9446, (iv): 0.9913 and (v) as well as v has possibly ended at 0.9407, therefore, consolidation with upside bias is seen for major correction, indicated target at 1.3700 and 1.4000 had been met and further gain to 1.4700 would be seen later.
Gold Steady as ISM Manufacturing PMI Meets Expectations
Gold has posted slight gains in the Monday session. In North American trade, gold is trading at $1252.81 per ounce. On the release front, there is just one major release on the schedule. ISM Manufacturing PMI dropped to 57.2, matching the forecast.
Donald Trump's young presidency has been turbulent, with Trump's controversial statements and actions making headlines almost daily. The battles with the media continue, an economic policy remains a mystery, and Trump suffered a major setback as he couldn't even muster a vote over his healthcare bill. Despite these hiccups, the US economy hasn't missed a beat in 2017. The CB consumer confidence report soared to 125.6 in March, and strong consumer confidence levels should translate into increased consumer spending. GDP for the fourth quarter was revised to 2.1%, up from 1.9% in the previous GDP report. This points to strong growth for the economy,
The discussions around the monetary policy tables are not whether the Fed will raise rates, but rather how many times will the Fed press the rate trigger in 2017. The Fed has forecast two more hikes this year, but the markets are looking for three hikes, and the US dollar took a hit last week as the markets were disappointed with the Fed's dovish rate statement. The Fed will release the minutes of its March meeting on Wednesday, and the markets will be looking for clues as to the timing of a possible rate hike. If the minutes are dovish in tone, gold could head lower.
ISM Manufacturing: Solid Factory Hiring, Rising Prices
The ISM manufacturing index dipped half a point to 57.2 in March, a level still consistent with solid activity in the factory sector. Hiring jumped over the month, while rising input costs pressures did not let up.
Dip in March, but Factory Activity Still Solid
Consistent with many of the regional purchasing managers indices released over the past few weeks, growth in the manufacturing sector looks to have cooled a touch last month. The ISM manufacturing index edged back half a point to 57.2 in March. At that level, however, the factory sector is still expanding at a solid clip.
The largest drag on the headline this month was a pullback in current activity. The production index edged back 5.3 points and is now slightly below its six-month average. The pipeline for activity, however, remains strong. New orders were little changed at 64.5 and remain near a three-year high.
Much of the strength in new orders stems from the improved global backdrop. The index on export orders rose 4.0 points in March. While not seasonally adjusted, the index indicates the fastest pace of export growth since late 2013, when the value of the broad trade-weighted dollar was more than 20 percent lower.
Inventories contracted slightly over the month, which also weighed on the composite index. After entering expansion territory for the first time since mid-2015 in February, the inventory index fell 2.5 points to 49.0. That said, the ISM finds that readings above 42.9 are consistent with growth in manufacturing inventories as measured by the Bureau of Economic Analysis, which is consistent with our call that inventories will not be a drag on growth this year like they were in 2016.
Another Month of Solid Hiring in Manufacturing
Partially offsetting the weaker - although not outright weak - readings in production, new orders and inventories that led to a lower headline in March was improvement in supplier deliveries and employment. Supplier delivery times lengthened in March, with the index rising 1.1 point to 55.9. The biggest improvement in sub-indices, however, came from the employment component. Factory hiring looks to have strengthened materially in March, with the employment index up nearly five points to the highest level since mid-2011. The jump suggests another solid gain in manufacturing payrolls in March, which have increased an average of 19,000 jobs over the past three months.
Inflation Pressures Mounting
Price pressures continue to mount in the factory sector. Lower oil prices in the second half of the month do not appear to have been passed on to manufacturers, who reported no commodities down in price in March. The prices paid index rose to 70.5, which is the fastest rise in input prices in nearly six years and supports our outlook for inflation to rise further over the course of the year.
ISM: U.S. Manufacturing Activity Expands for the Seventh Consecutive Month in March
The Institute for Supply Management (ISM) manufacturing index declined by half a point to 57.2 in March. Nevertheless, despite the slightly slower rate, the U.S. manufacturing sector expanded for the seventh consecutive month. Moreover, the reading was just above consensus forecast that expected a headline number of 57 - a slightly slower rate of expansion than what materialized.
Moves in the subcomponents of the index were mixed, with about half recording an expansion at a faster pace in March. Some of the biggest moves higher included employment (+4.7 to 58.9), new export orders (+4.0 to 59), and prices (+2.5 to 70.5). Of those subcomponents that recorded a decline in March, production fell the most (-5.3 to 57.6), followed by inventories (-2.5 to 49) and new orders (-0.6 to 64.5).
Given the greater decline in inventories that offset the much smaller decline in new orders, the spread between the two - useful as a leading indicator of activity - widened slightly in March to 15.5 from 13.6 in February. This suggests that manufacturing activity is likely to continue to expand in the months ahead.
No industry reported contractions, with seventeen of the eighteen reporting expansion in March. Electrical equipment appliances and components, printing and related support activities, and furniture and related products all registered the strongest expansion in the month.
Key Implications
Despite the pace of expansion in the headline index slowing slightly in March, the underlying details of this morning's ISM manufacturing report are broadly positive. The U.S. manufacturing sector expanded at a robust pace in the first quarter, although momentum appears to have slowed. All categories except inventories and customers' inventories are healthy, while both new orders and production remain resilient despite taking a breather in March. Comments by survey respondents were broadly positive, with an acknowledgement by some that rising input prices are being passed on to buyers via higher sales prices.
Despite its recent strong showing, the U.S. manufacturing sector is likely to continue to face a number of challenges this year. For one, although the trade weighted dollar has given up its gains from early in the year, it still remains about 3% above the level from a year ago and is expected to continue to dampen the export competitiveness of U.S. firms. Perhaps another more important concern is the elevated level of policy uncertainty both globally and domestically, particularly surrounding any changes to the U.S. trading relationship with the rest of the world. Given U.S. manufacturers strong integration in global value chains, any material changes to U.S. trade policies could destabilize and do more harm than good as far as domestic industries are concerned in the short to medium term.
March ISM data for the U.S. manufacturing sector mirrors the good news from other purchasing manager's surveys for Europe, Japan, India, and other large emerging markets released this morning. The momentum from the strong pickup in global growth from last year has likely carried through March, suggesting a strong handoff into the second quarter. Still, although there has only been a slow trickle of non-survey based economic data for 2017 thus far, we anticipate that the global economy is on pace to expand at an above 3.0% rate in the first half of 2017.
Bank of Canada Business Outlook & Senior Loan Officer Surveys: Firms Remained Optimistic in Early 2017
The Bank of Canada's quarterly Business Outlook Survey (BOS) pointed to continued optimism among Canadian businesses, supported by gains in indicators of future sales and further improved investment intentions.
On a backward-looking basis, sales growth has been stable, with the balance of opinion remaining effectively unchanged for a seventh straight quarter (balance of opinion: +2). On a forward-looking basis it was a more positive story. Sentiment for sales over the next 12 months fell slightly on balance, but remained near recent highs at +21. Moreover, the 'indicator of future sales' (based on order books, sales inquiries, etc.) climbed sharply, reaching +46 (Q4 survey: +32). Rebounds in energy-related activity and the level of the loonie were both cited as factors supporting the sales outlook.
Firms were also more optimistic regarding the outlook for investment. At +35, the balance of opinion on investment now sits near all-time highs as the share of firms planning to decrease spending dropped for a fourth straight quarter. Although sentiment improved, the Bank of Canada noted that many firms expect the anticipated increase in spending to be "modest" in scope.
Hiring intentions were effectively unchanged from the previous survey, as more than half of firms expect to increase their staffing levels.
There was not much reported in terms of burgeoning price pressures. The pace of output price growth is expected to remain around current levels on balance despite a modestly positive balance of sentiment around input prices. Consistent with this, 64% of respondents expect inflation over the next two years to be between 1% and 2%, with only 30% expecting price growth of 2% to 3%.
Senior Loan Officer Survey
The Bank of Canada also released its Senior Loan Officer Survey, which pointed to a third quarter of effectively unchanged business lending conditions. In aggregate, both price and non-price conditions were unchanged. Overall demand for credit was reported to have decreased in the first quarter owing to substitution to capital market fundraising among corporate borrowers.
Key Implications
Add another tick to the 'plus' column for the Canadian economy. Canadian firms remained optimistic on balance, and the details of the report were encouraging. Although there are caveats around what pace it may translate to, investment intentions are sitting at historic highs, and the outlook for hiring remains healthy. The BOS suggests that while the hot pace of first quarter activity is not likely to be repeated, it may be reasonable to expect solid economic momentum as we head into the remainder of 2017.
The Bank of Canada is undoubtedly pleased with today's report, but it is not likely to change the dovish tone of recent communications. Governor Poloz has remained focused on the downside risks, and the possibility that Canada may be in the midst of a 'false start'. To his point, the outlook for machinery and equipment investment showed steady improvement throughout 2016, outlook for machinery and equipment investment showed steady improvement throughout 2016, and yet actual investment fell over this time (although a box in today's report suggests that the BOS as a whole may provide a better indication of the path of investment). Until intentions begin translating into actual investment, Bank of Canada officials appear likely to downplay today's BOS and the recent improvement in the Canadian economic data more broadly.
Japanese Yen Shrugs Mixed Tankan Indices
The Japanese yen has edged higher in the Monday session. In North American trade, USD/JPY is trading at the 111 line. On the release front, the Japanese Tankan indices were a mixed bag. The Tankan Manufacturing Index improved to 12, short of the forecast of 14 points. The Tankan Non-Manufacturing Index climbed to 20, edging above the forecast of 19 points. In the US, ISM Manufacturing PMI dropped to 57.2, matching the forecast.
What can the markets expect from the Bank of Japan? According to the summary of the minutes, which were released last week, we're likely to see "more of the same" as far as monetary policy. There were no surprises from the summary, as policymakers said the BoJ's ultra-easy monetary stance would continue as long as inflation remains well below the target of 2 percent. Japan's economy has improved in recent months, boosted by a stronger manufacturing sector and an increase in exports. At the same time, domestic demand remains soft, which has resulted in weak inflation levels.
Donald Trump's young presidency has been turbulent, with Trump's controversial statements and actions making headlines almost daily. The battles with the media continue, an economic policy remains a mystery, and Trump suffered a major setback as he couldn't even muster a vote over his healthcare bill. Despite these hiccups, the US economy hasn't missed a beat in 2017. The CB consumer confidence report soared to 125.6 in March, and strong consumer confidence levels should translate into increased consumer spending. GDP for the fourth quarter was revised to 2.1%, up from 1.9% in the previous GDP report. This points to strong growth for the economy, as the discussions around the monetary policy tables are not whether the Fed will raise rates, but will it press the rate trigger twice or three times in 2017. The Fed will release the minutes of its March meeting on Wednesday, and the markets will be looking for clues as to the timing of a possible rate hike.
Manufacturing PMI Misses Expectations, British Pound Dips
GBP/USD has posted slight losses in the Monday session. In the North American trade, GBP/USD is trading at the 1.25 level. On the release front, British Manufacturing PMI improved to 54.2, but this fell short of the forecast of 55.1 points. In the US, ISM Manufacturing PMI dropped to 57.2, matching the forecast. On Tuesday, the UK releases Construction PMI.
Britain has entered Phase II of the Brexit saga, as Prime Minister Theresa May gave formal notice its intent to leave the EU last week. The negotiations over the breakup are supposed to be conducted over a two-year period, and promise to be tough and perhaps acrimonious. The EU has no intention of giving Britain a better deal than it had within the club, and wants the first item of business to be "exit bill" for Britain's share of debts, pensions and other payments. The EU says the amount in demand could be as high as EUR 60 billion, but the UK government is likely to balk at the bill. For its part, the British government needs to show the British public that it has reached a good deal,and has threatened to leave the EU without a deal if the EU is intransigent in the negotiations. That scenario, labeled "hard Brexit", would likely take a toll on the British economy and could send the pound downward. Negotiations are unlikely to commence for several months, but we're likely to have plenty of tough talk between the parties in the meantime.
Donald Trump's young presidency has been turbulent. The battles with the media continue, an economic policy remains a mystery, and Trump suffered a major setback as he couldn't even muster a vote over his healthcare bill. Despite these hiccups, the US economy hasn't missed a beat in 2017. The CB consumer confidence report soared to 125.6 in March, and strong consumer confidence levels should translate into increased consumer spending. GDP for the fourth quarter was revised to 2.1%, up from 1.9% in the previous GDP report. This points to strong growth for the economy, as the discussions around the monetary policy tables are not whether the Fed will raise rates, but will it press the rate trigger twice or three times in 2017. The Fed will release the minutes of its March meeting on Wednesday, and the markets will be looking for clues as to the timing of a possible rate hike.
Currencies: EUR/USD Decline Slows, At Least For Now
Headlines
Most European stock markets started the quarter with modest losses of less than 0.5%. US equities show no clear trend at the open, trading little changed from Friday's closing levels.
America's factories continued to expand in March at a robust pace, demonstrating momentum in an industry that struggled for the better part of the last two years. The US manufacturing ISM marginally declined from 57.7 to 57.2, in line with expectations, but remains at a very high level.
The ECB sees no evidence that its aggressive stimulus policy is hampering financial markets, ECB Coeure said, despite deeply negative yields on some bonds and fresh signs of scarcity. He blamed political risk in some European countries and stricter financial rules since the crisis for boosting demand for short-term German government bonds.
UK manufacturing unexpectedly cooled (54.2 from 54.5) for a third month in March and may weaken further, according to IHS Markit, which repeated its warning about inflationary pressures. The final EMU manufacturing PMI was confirmed at 56.2 while the EMU unemployment rate dropped to a 7-yr low (9.5%) in February.
A blast has occurred on a subway line in Russia's second city of St. Petersburg killing 10 people, according to preliminary reports from news agencies Interfax and TASS.
Rates
Bunds higher due to some specific reasons?
Global bonds parted ways today. German Bunds eked out more gains, bull flattening the curve. US Treasuries hovered listless throughout the session, ahead of the US ISM business sentiment. Given the sharp underperformance of the euro swap curve, we suspect that today's Bund movements were largely due to technically (shortage?) reasons more than fundamental ones. To a very small extent, the combination of low inflation readings in the euro area and signals out of the ECB that they don't want to contemplate changing policy now, might have still had some marginal impact. The eco data were plain vanilla. The final manufacturing PMI's were close to the preliminary ones and the unemployment rate fell as expected.
At the time of writing, changes on the German yield curve ranged between -4.5 bps (2-yr) and -1.4 bps (30-yr), while the swap curve registered changes of between -1.3 bps (2-yr) and 0 bp (10-yr). Changes on the US yield curve vary between -0.8 bps (5-yr) and +1.4 bps (30-yr). On intra-EMU bond markets, 10-yr yield spread versus Germany widened up to 6 bps (Italy). France underperformed Belgium (+4 bps versus +2 bps). As of this week, the ECB buys only €60B/month versus €80B previously. However, we wouldn't attribute the spread widening to the amount of ECB purchases.

Currencies
EUR/USD decline slows, at least for now
Trading in the major dollar cross rates started the new quarter on a slow footing. EUR/USD retested last week's lows, but there was no strong enough driver for a further euro decline/dollar gain. USD/JPY also didn't go anywhere, awaiting more guidance from this week's eco update on the US economy. EUR/USD trades in the 1.0660/65 area. USD/JPY sits in the mid 111 area.
Overnight, Asian equities started the quarter on a positive footing. The headline Japan Tankan indicator improved for the second quarter in a row, but the rise was more modest than expected. Capex was slightly stronger than expected. The report had no lasting impact on yen trading. USD/JPY held in the mid 111 area. The dollar continued to trade mixed. EUR/USD reversed part of Friday's late session decline, but held within reach of the correction lows reached late last week.
European investors were a bit more cautious at the start of the new quarter compared to their Asian counterparts. European equities opened in positive territory but the gains evaporated almost immediately after the open. The EMU manufacturing PMI was confirmed at 56.2 and the EMU unemployment rate declined to a 9.5%, a multi-year low. However, it didn't help sentiment on European markets. European yields declined and the interest rate differentials between the US and Germany/Europe widened again with the 2-year spread returning well north of 200 bps. EUR/USD touched a minor correction low in the 1.0650 area, but there were no follow-through losses. At the same time, USD/JPY stabilized in the mid to lower 111 area.
For now, US trading also didn't find any clear directional momentum as investors await the early month US data today (US manufacturing ISM) and later this week. For now both EUR/USD and USD/JPY are captured in lackluster, order-driven trading. EUR/USD changes hands in the 1.0660/65 area. USD/JPY trades in the 111.30 /40 area. US equities opened little changed from Friday.

Sterling short squeeze runs into resistance
Sterling is trading off Friday's correction top against the euro and the dollar after a solid performance last week. EUR/GBP hovered in the low 0.85 area early in Europe. The UK manufacturing PMI declined from 54.5 to 54.2. The consensus expected a modest rebound to 55.00. The report didn't change the overall picture on the UK in a profound way. Even so, it help to block the recent short-covering rally of sterling. EUR/GBP 'jumped' to the 0.8540 area. Later in US dealings, EUR/USD regained a few ticks off the intraday lows which also filtered through into EUR/GBP trading. The pair trades currently in the 0.8540/45 area. Cable drifted back to the 1.25 area. After a brief intermezzo, sterling again traded slightly in the defensive early in US dealings. The jury is still out, but today's price action suggests that last week's sterling short-squeeze maybe ran its course. Will political tensions and/or softer eco data again become more important as a driver for sterling trading?

Currency Forecast Apr. 3-7: Bullish on USD/CAD
It was another quiet week for the Canadian dollar, which posted small gains. USD/CAD closed the week just below the 1.33 level. This week's key event is Employment Change. Here is an outlook on the major market- movers and an updated technical analysis for USD/CAD.
US consumer confidence sparkled in March, as consumers remain confident about the economy. Canadian GDP posted a strong gain of 0.6%, above the forecast of 0.3%.
Updates:
- Apr 3, 12:12: Brexit Bad and "Clean Coal" - MM #140: The UK is now officially leaving the EU and the real games begin. We begin with this event and its...
- Apr 3, 0:22: The week ahead: Strong start to Q2 with a full NFP buildup [Video]: The first quarter of 2017 provided its dose of volatility. After some end-of-quarter adjustments, the new one commences with a...
USD/CAD daily graph with support and resistance lines on it.
- RBC Manufacturing PMI: Monday, 13:30. The PMI has improved over five straight months and continues to point to expansion. In January, the index rose to 54.7 points.
- BoC Business Outlook Survey: Monday, 14:30. The survey is released quarterly and is based on 100 businesses, which rate business conditions, hiring and spending. A positive report could send the Canadian dollar higher.
- Trade Balance: Tuesday, 12:30. Canada's trade surplus dipped to C$0.8 billion in January, well above the forecast of C$0.2 billion. The downward trend is expected to continue in February, with an estimate of C$0.7 billion.
- Building Permits: Thursday, 12:30. The indicator posted a strong gain of 5.4%, above the estimate of 3.1%. This follows a streak of two straight declines.
- Employment Change: Friday, 12:30. This is one of the most important indicators and an unexpected reading can have a strong impact on the direction of USD/CAD. The indicator softened to 15.3 thousand in February, crushing the estimate of 0.6 thousand. The downward trend is expected to continue in March, with a forecast of 5.7 thousand. The unemployment rate is expected to edge up to 6.7%.
- Ivey PMI: Friday, 12:30. In February, the indicator slipped to 55.0 in February, short of the forecast of 58.9 points. The index is expected to improve to 56.3 in the March report.
USD/CAD Technical Analysis
USD/CAD opened the week at 1.3330 and climbed to a high of 1.3414, as support held at 1.3457. The pair then reversed directions and dropped to 1.3276. USD/CAD closed the week at 1.3297.
Technical lines, from top to bottom
- 1.3648 was an important support level in February.
- 1.3551 is the next line of resistance.
- 1.3457 was a high point in September 2015.
- 1.3351 is the next line of resistance.
- 1.3212 is providing support. It was a cap in the second quarter of 2016.
- 1.3124 is the next support level.
- 1.3003 is protecting the symbolic 1.30 level.
- 1.2908 is the final support level for now.
I am bullish on USD/CAD
The US economy continues to fire on all cylinders and the Fed is expected to continue to raise interest rates, so sentiment remains favorable for the US dollar. In Canada, BoC Governor Stephen Poloz strongly hinted that no rate hikes are likely in the near future.