
Sample Category Title
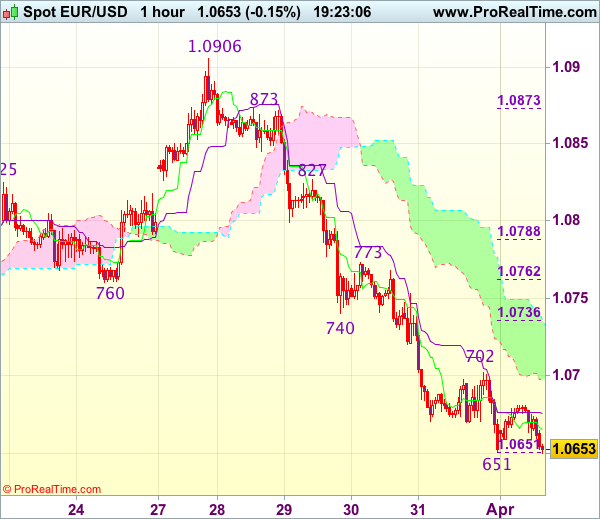
Trade Idea Update: EUR/USD – Sell at 1.0740
EUR/USD - 1.0655
Original strategy :
Sell at 1.0740, Target: 1.0625, Stop: 1.0775
Position : -
Target : -
Stop : -
New strategy :
Sell at 1.0740, Target: 1.0625, Stop: 1.0775
Position : -
Target : -
Stop : -
As the single currency has remained under pressure after last week’s selloff, suggesting the decline from 1.0906 top is still in progress and bearishness remains for this fall to extend further weakness to 1.0620-25, then test of previous chart support at 1.0600, however, a sustained breach below the latter level is needed to retain downside bias for subsequent selloff to 1.0570-75 first, otherwise, risk from there is seen for a rebound later.
In view of this, would not chase this fall here and would be prudent to sell dollar on recovery as 1.0735-40 should limit upside. Only a firm break above resistance at 1.0773 would suggest low is formed instead, bring a stronger rebound to 1.0800 but resistance at 1.0827 should remain intact.
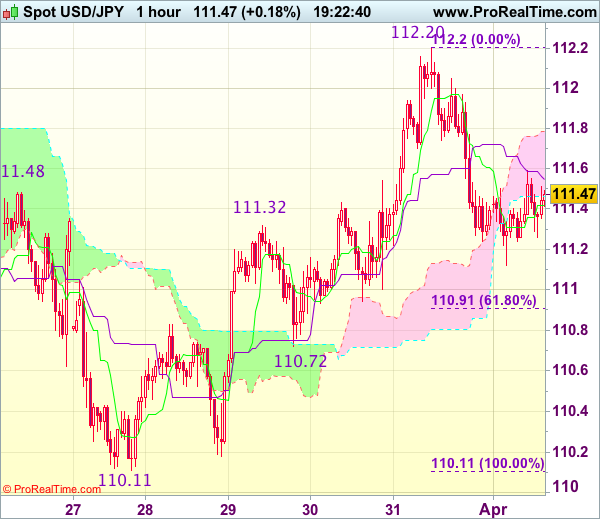
Trade Idea Update: USD/JPY – Stand aside
USD/JPY - 111.44
New strategy :
Stand aside
Position : -
Target : -
Stop : -
Dollar’s retreat after last week’s strong rebound to 112.20 suggests top has possibly been formed there and consolidation with mild downside bias is seen for weakness to 110.91-94 (61.8% Fibonacci retracement of 110.11-112.20 and previous support), however, break there is needed to add credence to this view, bring further fall to support at 110.72, once this level is penetrated, this would signal the rebound from 110.11 has ended and further decline to 110.50 would follow.
In view of this, would not chase this fall here and would be prudent to stand aside in the meantime. Above 111.75-80 would bring recovery to 112.00-05 but price should falter below resistance at 112.20, bring further consolidation. Only break of 112.20 would revive bullishness and extend the rise from 110.11 low to 112.50-55 but price should falter below previous resistance at 112.87-90, bring retreat later.
DAX Steady On Solid German, Eurozone Manufacturing PMIs
The DAX Index has edged lower in the Monday session, as the DAX trades at 12,366.50. On the release front, it's a very busy start to the week. German and Eurozone Manufacturing PMIs continue to point to expansion. Both indexes improved in March, with readings of 58.3 and 56.3, respectively. Elsewhere in the eurozone, PPI came in at 0.2%, above the forecast of 0.0%. The unemployment rate edged lower to 9.5%, matching the forecast.
It was an impressive week for the DAX, which jumped 3.0 percent. Earlier on Friday, the DAX pushed above 12,300, its highest level since April 2015. The index has been boosted by strong German numbers across the German economy, as business confidence, retail sales and unemployment claims all beat their estimates last week. The German economy, the largest in Europe, is looking sharp and has enjoyed a robust first quarter in 2017. Stronger global trade has led to increased demand for German exports, notably cars and machinery. Germany's GDP expanded 1.6% in 2016, its highest rate since 2012. The generally positive picture in Germany has boosted the eurozone economy and if the strong numbers continue, the ECB will be under more pressure to tighten monetary policy.
It's been a turbulent start to Donald Trump's presidency. The battles with the media continue, an economic policy remains a mystery, and Trump suffered a major setback has he couldn't even muster a vote over his healthcare bill. Despite these hiccups, the US economy hasn't missed a beat in 2017. The CB consumer confidence report soared to 125.6 in March, and strong consumer confidence levels should translate into increased consumer spending. GDP for the fourth quarter was revised to 2.1%, up from 1.9% in the previous GDP report. This points to strong growth for the economy, as the discussions around the monetary policy tables are not whether the Fed will raise rates, but will it press the rate trigger twice or three times in 2017. The Fed will release the minutes of its March meeting on Wednesday, and the markets will be looking for clues as to the timing of a possible rate hike.
EUR/USD – Unchanged As Eurozone Manufacturing PMIs Meet Forecasts
EUR/USD is showing little movement in the Monday session. Currently, the pair is trading at 1.0670. It's a very busy start to the week, with a host of manufacturing releases out of the eurozone and the US. German Manufacturing PMI improved to 58.3, while Eurozone Manufacturing PMI rose to 56.2 points. In the US, today's highlight is ISM Manufacturing PMI, which is expected to dip to 57.2 points. We'll also hear from two FOMC members – Esther Dudley and Patrick Harker.
The euro has steadied on Monday, following a weak performance last week. EUR/USD dropped 1.9 percent, marking its worst weekly decline since November 2016. Soft inflation numbers in the eurozone disappointed the markets and soured sentiment on the continental currency. German Preliminary CPI posted a weak gain of 0.2%, short of the forecast of 0.4%. This was followed by Eurozone Flash CPI Estimate, which slipped to 1.5%, missing the forecast of 1.8%. At the same time, German employment and retail sales data beat expectations, as the German economy continues to expand at a healthy clip in 2017.
Donald Trump's presidency has been anything but smooth. The battles with the media continue, an economic policy remains a mystery, and Trump suffered a major setback has he couldn't even muster a vote over his healthcare bill. Despite these hiccups, the US economy hasn't missed a beat in 2017. The CB consumer confidence report soared to 125.6 in March, and strong consumer confidence levels should translate into increased consumer spending. GDP for the fourth quarter was revised to 2.1%, up from 1.9% in the previous GDP report. This points to strong growth for the economy, as the discussions around the monetary policy tables are not whether the Fed will raise rates, but will it press the rate trigger twice or three times in 2017. The Fed will release the minutes of its March meeting on Wednesday, and the markets will be looking for clues as to the timing of a possible rate hike.
Technical Outlook: Spot Gold May Extend Consolidation Between $1239/50 Before Bulls Resume
Bounce from last Friday's correction low at $1239 provided temporary relief as risk of retesting key near-term supports at $1236/33 (Fibo 38.2% of $1197/$1261 rally / daily cloud top) has eased.
However, recovery attempts were so far capped at $1250 zone, where rising daily Tenkan-sen lies today, suggesting extended consolidation.
Spot Gold may retest $1239 support, before bulls resume, with close above $1247 (Fibo 38.2% of $1261/$1239 pullback) required for stronger bullish signal.
Extension above $1250 /52 pivots (recovery top / Fibo 61.8%) is needed to confirm bullish continuation and re-expose key barriers at $1259 (200SMA) and 1261/63 (peaks of 27 Mar and 27 Feb).
Thick daily cloud continues to underpin (currently spanned between $1191 and $1233) and only firm break into the cloud and violation of next pivot at $1229 (daily Kijun-sen) would risk stronger downside action from $1261/63 double-top.
Res: 1250, 1252, 1255, 1259
Sup: 1244, 1239, 1236, 1233
GOLD Starting A New Leg Lower, SILVER Further Consolidation, Crude Oil Back Above $50.
GOLD Starting a new leg lower.
Gold is getting stronger. The momentum seems back to bullish despite some consolidation. Strong resistance is located at 1263 (27/02/2017 high). Hourly support can be found at 1224.10 (16/03/2017 low).
In the long-term, the technical structure suggests that there is a growing upside momentum. A break of 1392 (17/03/2014) is necessary ton confirm it, A major support can be found at 1045 (05/02/2010 low).
SILVER Further consolidation.
Silver has increased above 18.00 which is now a support. Strong resistance is given at a distance at 18.49 (27/02/2017 high). Key support is given at 16.82 (15/03/2017 low).
In the long-term, the death cross indicates that further downsides are very likely. Resistance is located at 25.11 (28/08/2013 high). Strong support can be found at 11.75 (20/04/2009).
Crude Oil Back above $50.
Crude oil's bearish pressures seems to fade. The commodity had been located in a bearish trend since the commodity had been unable to mount a serious challenge to resistance at 55.24 (03/01/2017 high). Hourly support is given at 47.09 (016/03/2017 low).
In the long-term, crude oil has recovered after its sharp decline last year. However, we consider that further weakness are very likely. Strong support lies at 24.82 (13/11/2002) while resistance can now be found at 55.24 (03/01/2017 high).
EUR/CHF Back To 1-Month Low, EUR/JPY Continued Weakness, EUR/GBP Sharp Decline.
EUR/CHF Back to 1-month low.
EUR/CHF's is heading lower. The medium-term pattern suggests us to see continued bearish pressures towards key support that can be found at 1.0623 (24/06/2016 low). For now the support given at 1.0684 (06/03/20117 low) seems to be strong.
In the longer term, the technical structure is mixed. Resistance can be found at 1.1200 (04/02/2015 high). Yet,the ECB's QE programme is likely to cause persistent selling pressures on the euro, which should weigh on EUR/CHF. Supports can be found at 1.0184 (28/01/2015 low) and 1.0082 (27/01/2015 low).
EUR/JPY Continued weakness.
EUR/JPY rejection at 122.88 has triggered a correction. The pair is also very volatile. Hourly support at 119.33 (23/03/2017 low) has been broken. Resistance stands at 122.88 (13/03/0217 high). The road is wide-open for further weakness.
In the longer term, the technical structure validates a medium-term succession of lower highs and lower lows. As a result, the resistance at 149.78 (08/12/2014 high) has likely marked the end of the rise that started in July 2012. Strong support at 94.12 (24/07/2012 low) looks nonetheless far away.
EUR/GBP Sharp decline.
EUR/GBP's bullish flag finally ended up as a false flag. Strong resistance is given at 0.8787 (13/03/2017 high). Key resistance is given at 0.8854 (15/01/2017 high). Hourly support at 0.8605 (23/03/2017 low) has been broken. Expected to show continued weakness.
In the long-term, the pair has largely recovered from recent lows in 2015. The technical structure suggests a growing upside momentum. The pair is trading above from its 200 DMA. Strong resistance can be found at 0.9500 psychological level.
USD/CHF Breaking Parity, USD/CAD Moving Sideways, AUD/USD Direction-Less.
USD/CHF Breaking parity.
USD/CHF is strengthening. Hourly support is given at 0.9814 (27/03/2017 low). Key resistance can be found at a distance at 1.0344 (15/12/2016 high). Expected to show further consolidating.
In the long-term, the pair is still trading in range since 2011 despite some turmoil when the SNB unpegged the CHF. Key support can be found 0.8986 (30/01/2015 low). The technical structure favours nonetheless a long term bullish bias since the unpeg in January 2015.
USD/CAD Moving sideways.
USD/CAD is struggling to go any higher. A break of resistance area around 1.3400 is needed to invalidate the current short term bearish technical structure. The road seems still wideopen for larger decline. Hourly support that can be found at 1.3265(21/03/2016 low) is at stake. Key support is given at 1.2969 (31/01/2017 low).
In the longer term, there is a golden cross with the 50 dma crossing the 200 dma indicating further upside pressures. Strong resistance is given at 1.4690 (22/01/2016 high). Long-term support can be found at 1.2461 (16/03/2015 low)
AUD/USD Direction-less.
AUD/USD is moving sideways. The pair has failed to test the key resistance at 0.7778 (08/11/2016 high). Expected to see some shortterm weakness towards support area around 0.7500.
In the long-term, we are waiting for further signs that the current downtrend is ending. Key supports stand at 0.6009 (31/10/2008 low) . A break of the key resistance at 0.8295 (15/01/2015 high) is needed to invalidate our long-term bearish view.
EUR/USD Weakening, GBP/USD Bullish Pressures, USD/JPY Moving Sideways.
EUR/USD Weakening.
EUR/USD is getting lower despite ongoing consolidation. The pair is heading lower since the pair failed to hold above former resistance given at 1.0874 (08/12/2017 high). Hourly support can be found at 1.0652 (31/03/2017 low). Stronger support can be found at 1.0493 (22/02/2017 low). The short-term technical structure indicates further weakness.
In the longer term, the death cross late October indicated a further bearish bias. The pair has broken key support given at 1.0458 (16/03/2015 low). Key resistance holds at 1.1714 (24/08/2015 high). Expected to head towards parity.
GBP/USD Bullish pressures.
GBP/USD's bullish pressures increase again after the pair exited short-term uptrend channel. Hourly resistance is located at 1.2615 (27/03/2017 high) while hourly support can be found at 1.2324 (03/17/2017 low). Expected to show continued strengthening towards resistance at 1.2771 (06/12/2016 high).
The long-term technical pattern is even more negative since the Brexit vote has paved the way for further decline. Long-term support given at 1.0520 (01/03/85) represents a decent target. Long-term resistance is given at 1.5018 (24/06/2015) and would indicate a long-term reversal in the negative trend. Yet, it is very unlikely at the moment.
USD/JPY Moving sideways.
USD/JPY's bearish pressures are fading. Hourly resistance is given at 112.20 (31/03/2017 high). Stronger resistance can be located at 113.57 (16/03/2017 high) while support is given at 110.11 (27/03/2017 low).
We favor a long-term bearish bias. Support is now given at 96.57 (10/08/2013 low). A gradual rise towards the major resistance at 135.15 (01/02/2002 high) seems absolutely unlikely. Expected to decline further support at 93.79 (13/06/2013 low).
RBA To Stay On Hold And Reiterate Dovish Stance, AUD Extends Losses, EUR Stabilises
News and Events:
RBA to stay on hold and reiterate dovish stance
The Reserve Bank of Australia is widely expected to hold the Cash Rate Target unchanged at a record 1.50% tomorrow morning at its monthly meeting. At its previous meeting, the Central Bank did not miss the opportunity to emphasise that the pick-up in inflation was mostly due to improving commodity prices. It also said that underlying inflation is expected to rise at a much slower pace during 2017.
Tomorrow’s statement will mostly be a cut-and-paste as Governor Lowe is determined to maintain a dovish stance to avoid any appreciation of the Australian Dollar, which would undermine the ongoing economic adjustment from the post-mining investment boom.
AUD/USD has continued to trade at the top of its yearly range at around 0.76-0.77. We believe that the downside adjustment in iron ore prices (futures for delivery at Qingdao port have fallen -15% since mid-February as port inventories reach extreme levels) is one factor in shifting the risk to the downside in AUD/USD. This comes together with rising uncertainties about the global demand outlook amid President Trump’s inability to pass reforms.
However, given the uncertainty generated by the Trump situation, long USD is not our favourite play. Therefore, we prefer to play a short AUD position against its closest neighbour, the New Zealand Dollar, as we believe the NZD has room for further appreciation.
French Elections: Markets wait for impact of first round
There are only three weeks remaining until the first round of the French Elections. We know that whatever may happen in those last few weeks, declarations from candidates may still have an impact on the markets. This is why Mélenchon and Macron are refusing a debate. Francois Fillon has not renounced, despite being considered out of the race in February, and we may see him increasing again in polls. His chance of a final victory is still alive.
Regarding Emmanuel Macron, many socialists are now supporting him. What should we believe from that? We believe that their endorsement is less in a desire to counter the National Front, but rather to participate in the likely new presidential majority.
The markets are still betting on a Macron victory but we assume his inexperience is going to be tough to overcome against his major competitors. The markets seem calm and the first round is going to provide us with a decent gauge.
Today's Key Issues (time in GMT):
- Mar CPI MoM, exp 0,63%, last 0,81% TRY / 07:00
- Mar CPI YoY, exp 10,70%, last 10,13% TRY / 07:00
- Mar CPI Core Index YoY, exp 8,80%, last 8,56% TRY / 07:00
- Mar PPI MoM, exp -0,02%, last 1,26% TRY / 07:00
- Mar PPI YoY, exp 14,92%, last 15,36% TRY / 07:00
- Mar Manufacturing PMI, exp 52,8, last 52,6, rev 53 NOK / 07:00
- Mar Markit/ISO Turkey PMI Mfg, exp 49,8, last 49,7 TRY / 07:00
- Mar Markit Spain Manufacturing PMI, exp 54,7, last 54,8 EUR / 07:15
- Feb Retail Sales Real YoY, last -1,40%, rev -1,20% CHF / 07:15
- Mar PMI Manufacturing, exp 58, last 57,8 CHF / 07:30
- Mar Markit/ADACI Italy Manufacturing PMI, exp 55,1, last 55 EUR / 07:45
- Mar F Markit France Manufacturing PMI, exp 53,4, last 53,4 EUR / 07:50
- Mar F Markit/BME Germany Manufacturing PMI, exp 58,3, last 58,3 EUR / 07:55
- Mar F Markit Eurozone Manufacturing PMI, exp 56,2, last 56,2 EUR / 08:00
- mars.31 Total Sight Deposits CHF, last 560.1b CHF / 08:00
- mars.31 Domestic Sight Deposits CHF, last 476.3b CHF / 08:00
- Feb P Unemployment Rate, exp 11,90%, last 11,90%, rev 11,80% EUR / 08:00
- Mar Markit UK PMI Manufacturing SA, exp 55, last 54,6, rev 54,5 GBP / 08:30
- Feb PPI MoM, exp 0,10%, last 0,70%, rev 1,10% EUR / 09:00
- Feb PPI YoY, exp 4,20%, last 3,50%, rev 3,90% EUR / 09:00
- Mar Danish PMI Survey, last 57,3, rev 57,2 DKK / 09:00
- Mar Barclays Manufacturing PMI, exp 51,8, last 52,5 ZAR / 09:00
- Feb Unemployment Rate, exp 9,50%, last 9,60% EUR / 09:00
- mars.31 FGV CPI IPC-S, exp 0,47%, last 0,39% BRL / 11:00
- Feb MLI Leading Indicator MoM, last 0,60% CAD / 11:00
- Central Bank Weekly Economists Survey (Table) BRL / 11:25
- Mar Markit Brazil PMI Manufacturing, last 46,9 BRL / 13:00
- Mar Markit Canada Manufacturing PMI, last 54,7 CAD / 13:30
- Mar F Markit US Manufacturing PMI, exp 53,5, last 53,4 USD / 13:45
- mars.31 Bloomberg Nanos Confidence, last 58,5 CAD / 14:00
- Mar ISM Manufacturing, exp 57,2, last 57,7 USD / 14:00
- Mar ISM Prices Paid, exp 66, last 68 USD / 14:00
- Mar ISM New Orders, last 65,1 USD / 14:00
- Mar ISM Employment, last 54,2 USD / 14:00
- Feb Construction Spending MoM, exp 1,00%, last -1,00% USD / 14:00
- 1Q Business Outlook Future Sales, last 26 CAD / 14:30
- 1Q BoC Senior Loan Officer Survey, last -2,6 CAD / 14:30
- Fed's Dudley Speaks at Press Briefing in New York USD / 14:30
- Mar New Car Registrations YoY, last 6,17% EUR / 16:00
- Apr 2 Trade Balance Weekly, last $1602m BRL / 18:00
- Fed's Harker Speaks in Philadelphia on Fintech USD / 19:00
- Richmond Fed President Lacker Speaks (Event Cancelled) USD / 21:00
The Risk Today:
EUR/USD is getting lower despite ongoing consolidation. The pair is heading lower since the pair failed to hold above former resistance given at 1.0874 (08/12/2017 high). Hourly support can be found at 1.0652 (31/03/2017 low). Stronger support can be found at 1.0493 (22/02/2017 low). The short-term technical structure indicates further weakness.. In the longer term, the death cross late October indicated a further bearish bias. The pair has broken key support given at 1.0458 (16/03/2015 low). Key resistance holds at 1.1714 (24/08/2015 high). Expected to head towards parity.
GBP/USD's bullish pressures increase again after the pair exited short-term uptrend channel. Hourly resistance is located at 1.2615 (27/03/2017 high) while hourly support can be found at 1.2324 (03/17/2017 low). Expected to show continued strengthening towards resistance at 1.2771 (06/12/2016 high). The long-term technical pattern is even more negative since the Brexit vote has paved the way for further decline. Long-term support given at 1.0520 (01/03/85) represents a decent target. Long-term resistance is given at 1.5018 (24/06/2015) and would indicate a long-term reversal in the negative trend. Yet, it is very unlikely at the moment.
USD/JPY's bearish pressures are fading. Hourly resistance is given at 112.20 (31/03/2017 high). Stronger resistance can be located at 113.57 (16/03/2017 high) while support is given at 110.11 (27/03/2017 low). We favor a long-term bearish bias. Support is now given at 96.57 (10/08/2013 low). A gradual rise towards the major resistance at 135.15 (01/02/2002 high) seems absolutely unlikely. Expected to decline further support at 93.79 (13/06/2013 low).
USD/CHF is strengthening. Hourly support is given at 0.9814 (27/03/2017 low). Key resistance can be found at a distance at 1.0344 (15/12/2016 high). Expected to show further consolidating. In the long-term, the pair is still trading in range since 2011 despite some turmoil when the SNB unpegged the CHF. Key support can be found 0.8986 (30/01/2015 low). The technical structure favours nonetheless a long term bullish bias since the unpeg in January 2015.
| EURUSD | GBPUSD | USDCHF | USDJPY |
| 1.1300 | 1.3445 | 1.0652 | 121.69 |
| 1.0954 | 1.3121 | 1.0344 | 118.66 |
| 1.0906 | 1.2771 | 1.0171 | 115.62 |
| 1.0669 | 1.2504 | 1.0018 | 111.32 |
| 1.0494 | 1.1986 | 0.9550 | 106.57 |
| 1.0341 | 1.1841 | 0.9444 | 106.04 |
| 1.0000 | 1.0520 | 0.9259 | 101.20 |