Sample Category Title
Market Update – European Session: European PMIs Remain In Expansion While Unemployment Continues Its Improving Trend
European PMIs remain in expansion while unemployment continues its improving trend
Notes/Observations
ECB begins process of scaling back assets purchases in April (from €80B to €60B/month)
European PMI Manufacturing data overall shows region on firmer footing (Beats: Swiss, Italy, Norway, while UK missed expectations)
European unemployment continued its improving trend
Overnight:
Asia:
China Mar Caixin PMI Manufacturing : 51.2 v 51.7e (9th consecutive expansion)
Australia Feb Retail Sales M/M: -0.1% v +0.3%e
Japan Q1 Tankan Large Manufacturiers Index: 12 v 14e
President Trump to discuss North Korea threat with China President this week; Will handle North Korea without China's help if need to; if China is not going to solve North Korea then we will (**Note: China’s Xi to meet Trump during April 6-7th at Mar-a-Lago)
Europe:
Chancellor Hammond: Brexit talks to be ‘parallel’ process; willing to have constructive negotiations to reach best possible exit deal
France Presidential Melenchon reiterates that has no intention to make way for Hamon. (**Insight: By joining forces Melenchon/Hamon would put the Left into 2nd round of upcoming elections)
S&P revised Spain outlook to Positive from Stable; affirms Spain sovereign rating at BBB+
Canadian rating agency DBRS affirmed France sovereign rating at AAA; trend Stable
Moody's affirmed Netherlands sovereign rating at Aaa; outlook Stable
Fitch affirmed Russia sovereign debt rating at BBB- (lowest level of investment grade); outlook Stable
Economic Data
(IE) Ireland Mar Manufacturing PMI: 53.6 v 53.8 prior (46th month of expansion)
(RU) Russia Mar Manufacturing PMI: 52.4 v 52.5e (8th month of expansion)
(IN) India Mar Manufacturing PMI: 52.5 v 50.7 prior
(JP) Japan Mar Domestic Vehicle Sales Y/Y: 13.8% v 13.4% prior
(SE) Sweden Mar PMI Manufacturing: 65.2 v 60.0e
(TR) Turkey Mar CPI M/M: 1.0% v 0.6%e; Y/Y: 11.3% v 10.7%e; CPI Core Y/Y: 9.5% v 8.8%e
(NL) Netherlands Mar Manufacturing PMI: 57.8 v 58.3 prior (44th month of expansion)
(NO) Norway Mar Manufacturing PMI: 54.7 v 52.8e
(HU) Hungary Mar Manufacturing PMI: 56.0 v 58.0e (15th month of expansion)
(PL) Poland Mar PMI Manufacturing PMI: 53.5 v 54.6e (28th month of expansion)
(TR) Turkey Mar Manufacturing PMI: 49.8e (1st expansion in 13 months and highest since Feb 2014)
(ES) Spain Mar Manufacturing PMI: 53.9 v 54.7e (42nd month of expansion)
(CZ) Czech Mar Manufacturing PMI: 57.5 v 57.5e &th month of expansion)
(CH) Swiss Mar Manufacturing PMI: 58.6 v 58.0e (highest level in over six years)
(IT) Italy Mar Manufacturing PMI: 55.7 v 55.1e (7th month of expansion and the highest since Mar 2011)
(FR) France Mar Final Manufacturing PMI: 53.3 v 53.4e (confirms 6th month of expansion)
(DE) Germany Mar Final Manufacturing PMI: 58.3 v 58.3e (confirms its 28th month of expansion and highest since Apr 2011)
(EU) Euro Zone Mar Final Manufacturing PMI: 56.2 v 56.2e (confirms 44th straight month of growth and highest since April 2011)
(GR) Greece Mar Manufacturing PMI: 46.7 v 47.7 prior (7th month of contraction)
(IT) Italy Feb Preliminary Unemployment Rate: 11.5% v 11.9%e
(UK) Mar PMI Manufacturing: 54.2 v 55.0e (8th month of expansion)
(EU) Euro Zone Feb Unemployment Rate: 9.5% v 9.5%e (lowest since 2009)
Fixed Income Issuance:
(NO) Norway sold NOK3.0B vs. NOK3.0B indicated in 12-month bills; Yield: 0.48% v 0.48% prior; Bid-to-cover: 2.72x v 2.74x prior
SPEAKERS/FIXED INCOME/FX/COMMODITIES/ERRATUM
Equities
Index snapshot (as of 10:00 GMT)**
Indices [Stoxx50 flat at 3,499, FTSE flat at 7,320, DAX +0.2% at 12,341, CAC-40 -0.1% at 5,116, IBEX-35 -0.3% at 10,431, FTSE MIB -0.2% at 20,459, SMI +0.2% at 8,671, S&P 500 Futures -0.2%]
Equities
Consumer discretionary [Burberry BRBY.UK +2% (Strategic partnership with Coty), ITV ITV.UK -2% (Fading Friday spike before close)] Aurulius +5% (Responds to Gotham's assertions)]
Industrials: [Schmolz+Bickenbach STLN.CH +6.5% (Feb trading update), Aurubis NDA.DE +2.0% (
Technology: [Imagination Tech IMG.UK -65% (Apple to no longer use IMG intellectual property in its new products), Sartorius SRT.DE -1.3% (Acquisition, raised guidance)
Speakers
ECB's Coeure (France): Expect new cash collateral facility to help reduce tensions but not a panacea. Governing Council will continue to monitor there development
ECB's Rimsevics (Latvia): Slow lending affecting economy; ECB stimulus is not flowing into economy
Turkey Econ Min Zeybekci: FX impact on inflation to continue
Japan PM Abe's advisor Nakahara: BOJ should make a clean break from its current policy approach after Gov Kuroda’s term ends next spring
Libya’s Sharara oil field said to resume production over the weekend
Nigeria Nupeng Oil union said to begin strike over improved pay
Currencies
FX markets began the new quarter on relatively quiet footing.
April marked the beginning of the scaling back of ECB bond buying purchases from €80B to €60B per month until the program ends in Dec. Various ECB speakers noted that THE PROCESS WAS not any signal start of tapering as it had the option to be more expansionary if needed.
EUR/USD little changed at 1.0670 area.
GBP/USD was slightly lower as UK Mar Manufacturing PMI again missed expectations. The pair was softer by 0.5% in the lower end of the 1.25 handle just ahead of the NY morning.
Fixed Income:
Bund futures trade at 161.66 up 24 ticks trading at 1 month highs despite strength in Stocks. Continued upside targets 161.87 followed by 162.18 then 162.33. Analysts eye support at 161.21 followed by 160.06 then 160.74.
Gilt futures trade at 127.53 down 4 ticks, little changed with Mar PMI Manufacturing data coming slightly short of estimates but still marking an 8th month of expansion. Resistance remains at 127.69 followed by 127.89. Support remains at 127.05 then 126.86 followed by 126.40. Short Sterling futures curve continues to flatten with the rise in Gilts with the Jun17Jun18 spread trading down to 17/17.5bp down 2bp on the day.
Monday's liquidity report showed Friday's excess liquidity fell to €1.512T a fall of €22B from €1.534T prior. Use of the marginal lending facility rose to €285M from €110M prior.
Corporate issuance saw Q1 end with $399B being issued marking an active start to the year. Looking ahead analysts eye weeks issuance to in the region of $25B.
In Euro denominated issuance €21.8B came to market last week via 36 issuers and 41 tranches. Issuance peaked on Thursday when €6.6B came to market.
Looking Ahead
06:45 (US) Daily Libor Fixing
07:00 (CA) Canada Feb Leading Indicator M/M: No est v 0.6% prior
07:00 (IN) India announces details of upcoming bond sale (held on Fridays)
07:25 (BR) Brazil Central Bank Weekly Economists Survey
08:00 (CZ) Czech Mar Budget Balance (CZK): No est v 3.7B prior
08:00 (BR) Brazil Mar PMI Manufacturing: No est v 46.9 prior
08:00 (CL) Chile Feb Retail Sales Y/Y: 0.7%e v 3.8% prior
08:00 (ES) Spain Debt Agency (Tesoro) announces size of upcoming actions
08:00 (ZA) South Africa Mar Naamsa Vehicle Sales Y/Y: No est v -0.1% prior
08:15 (UK) Baltic Dry Bulk Index
08:50 (FR) France Debt Agency (AFT) to sell combined €4.7-5.9B in 3-month, 6-month and 12-month BTF Bills
09:00 (SG) Singapore Mar Purchasing Managers Index: 50.8e v 50.9 prior; Electronic Sector: No est v 51.4 prior
09:30 (CA) Canada Mar Manufacturing PMI: No est v 54.7 prior
09:35 (EU) ECB calls for bids in 7-Day Main Refinancing Tender
09:45 (US) Mar Markit Final Manufacturing PMI: 53.5e v 53.4 prelim
09:45 (US) Fed's Dudley (dove, FOMC voter) spekas in NY
10:00 (US) Mar ISM Manufacturing: 57.2e v 57.7 prior; Prices Paid: 66.0e v 68.0 prior
10:00 (US) Feb Construction Spending M/M: +1.0%e v -1.0% prior
10:00 (MX) Mexico Feb Total Remittances: $2.2Be v $2.1B prior
10:00 (MX) Mexico Central Bank Economist Survey
10:00 (BR) Brazil Feb CNI Capacity Utilization: No est v 77.2% prior
10:30 (MX) Mexico Mar Manufacturing PMI: No est v 50.6 prior
10:30 (CA) Bank of Canada (BOC) Q1 Senior Loan Officer Survey: No est v -2.6 prior; Business Outlook Future Sales: No est v 26 prior
11:00 (CO) Colombia Feb Exports: $2.9Be v $2.6B prior
11:30 (US) Treasury to sell 3-Month and 6-month Bills
12:00 (IT) Italy Mar New Car Registrations Y/Y: No est v 6.2% prior
13:00 (MX) Mexico Mar IMEF Manufacturing Index: 48.0e v 46.8 prior; Non-Manufacturing Index: 47.9e v 46.2 prior
(BR) Brazil Mar Trade Balance: $6.9Be v $4.6B prior; Exports: $20.4Be v $15.5B prior; Imports: $13.4Be v 10.9B prior
15:00 (US) Fed's Harker (hawk, FOMC voter) speaks in Philadelphia
17:00 (US) Fed's Lacker (hawk, non-voter) speaks in Virginia
(RO) Romania Mar International Reserves: No est v $38.4B prior
(RU) Russia Mar Sovereign Wealth Fund Balances: Reserve Fund: No est v $16.1B prior; Wellbeing Fund: No est v $72.6B prior
(AR) Argentina Central Bank Expectation Survey
(IT) Italy Mar Budget Balance: No est v -€8.2B prior
EURUSD Tests 200 SMA Support Ahead Of US ISM Data
EUR/USD has seen a substantial retracement since March 27, after testing the significant resistance level at 1.0900.
The price has been trading below the 10 SMA since then, indicating the upside selling pressure is still heavy.
On the 4-hourly chart, the price has been holding above the 200 SMA since March 31, where there is stronger support.
The daily Stochastic Oscillator reading is below 10, suggesting a rebound.
The resistance level is at 1.0670, followed by 1.0685 and 1.0700.
The support line is at 1.0650, followed by 1.0630 and 1.0600.


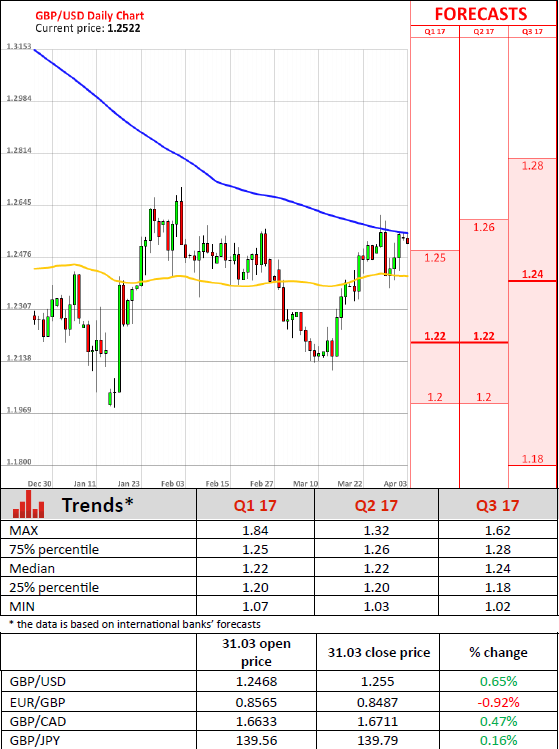
GBPUSD Reconfirms Bearish Trend-Line
'The dollar got some support last week from month-end buying and came off its lows, but overall its heaviness remains unchanged.' – Daiwa Securities (based on Reuters)
Pair's Outlook
The Sterling received a boost from upbeat fundamental data on Friday, which allowed it to outperform the American Dollar and retest the six-month down-trend. Technically, the GBP/USD currency pair should now bounce back from the trend-line, undergoing a bearish correction. The weekly pivot point represents immediate support at 1.2516, but is unlikely to limit the losses should those occur. At the same time, the second demand area, namely the cluster circa 1.2420, is also expected to remain out of reach today. The base case scenario is a close around 1.2490/80 zone.
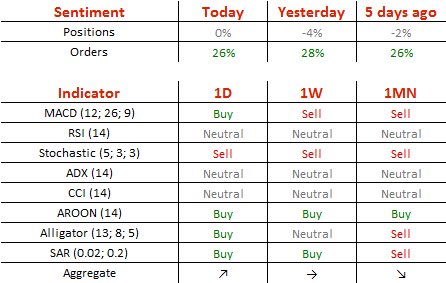
Traders' Sentiment
Market sentiment is somewhat neutral today, as 53% of all open positions are long and the remaining 47% are short. Concerning the pending orders, 52% of them are to purchase the British currency.
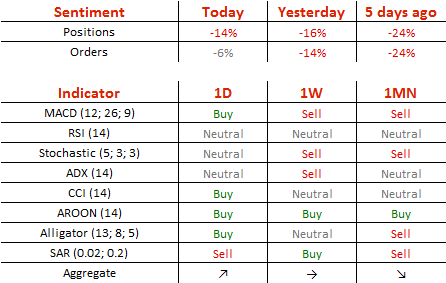
USDJPY Remains On The Back Foot
'Before resuming its uptrend in the medium term, we think USD/JPY will likely be capped in the near term.' – Deutsche Bank (based on FXStreet)
Pair's Outlook
As was anticipated, the USD/JPY currency pair was unable to reclaim the 112.00 mark, resulting in a 53-pip loss on Friday. Nevertheless, more bearish momentum is possible, but unlikely, since the pair rebounded after approaching the descending channel's support line last week. Currently, the Buck is making its way towards the channel's upper border, with the 112.00 handle being one of the main obstacles. However, technical indicators are unable to confirm the possibility of a positive outcome today, as they keep giving bearish signals. Another setback is possible, but the US Dollar is expected to hold above 110.00, therefore, refrain from retesting the lower trend-line any time soon.
Traders' Sentiment
There are 69% of traders holding long positions today (previously 71%), whereas 54% of all pending orders are to acquire the Greenback.
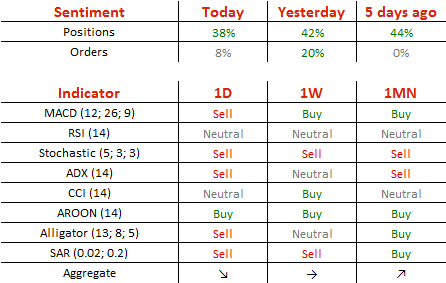
EURUSD Declines Below 1.07 Mark
'If France and Germany are not on the same page anymore, it means that political backing is no longer there, and there's not much the ECB can do.' – Guntram Wolff, Bruegel Institute (based on Bloomberg)
Pair's Outlook
During the early hours of Monday's trading session the common European currency scored slight gains against the US Dollar. However, the currency exchange rate was still positioned for further losses. The pair faced the resistance put up by the 55-day SMA, which was located at the 1.0674 level, and the monthly PP at 1.0685 mark. The fall of the currency pair might be hindered by the 23.60% Fibonacci retracement level, which is located at the 1.0639 level. The retracement level is also supported by the 100-day SMA at the 1.0624 level. However, a hindrance for long is unlikely.
Traders' Sentiment
SWFX traders remain bearish on the pair, as 57% of open positions are short on Monday. Meanwhile, 53% of trader set up orders are to sell the Euro.
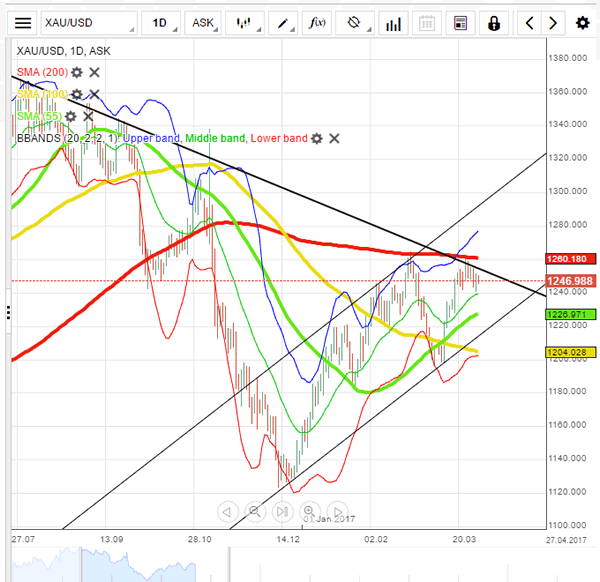
XAU/USD Attempts To Break Above 1,250
'The interest rate hike cycle has set in and that might keep gold in a wide range of $1,200-$1,250 as the opportunity cost of holding non-interest rate bearing gold is more.' – Mark To, Wing Fung Financial Group (based on Reuters)
Pair's Outlook
On Monday morning the yellow metal attempted to break above the 1,250 mark, as it faced resistance put up by the weekly PP at 1,249.67 and the 50.00% Fibonacci retracement level, which is located at the 1,248.96 mark. If the bullion succeeds, it will likely jump to the 1,257.02 level, where the 200-day SMA is located at. However, in the case of a failure the commodity price has no support as low as the 1,238.33 level, where the weekly S1 is positioned. The weekly S1 is also supported by the freshly calculated monthly PP at the 1,234.74 level.
Traders' Sentiment
SWFX traders are neutral on the metal, as 50% of open positions are long. However, 63% of trader set up orders are to buy the yellow metal.
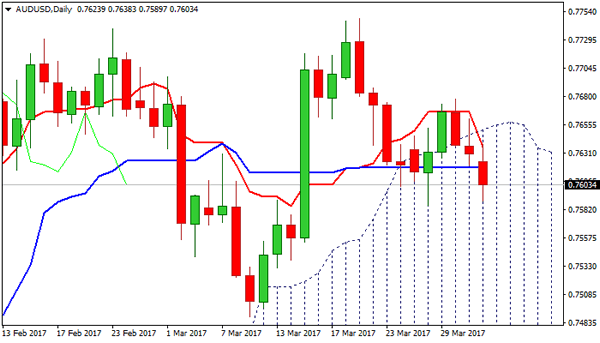
Technical Outlook: AUDUSD Returns Into Daily Cloud, Maintains Negative Near-Term Outlook
The Aussie stays in red on Monday and extends losses below 0.7600, coming ticks ahead of last week's low at 0.7585.
Larger pullback from 0.7747 was so far contained here (support is formed by Fibo 61.8% of 0.7489/0.7747 rally), with limited recover (capped at 0.7677) and subsequent weakness threatening for firm break below 0.7585 pivot) bearish signal) for retest of another strong support at 0.7547 (200SMA).
The price is back into thick daily cloud (spanned between 0.7448 and 0.7651) after being unable to hold above the cloud.
Daily studies are weakening and supportive for further easing, with 0.7585 seen as key point.
South-turned Tenkan-sen offers solid resistance at 0.7636, guarding upper pivot at 0.7651 (daily cloud top) which is expected to cap extended upticks.
Res: 0.7636, 0.7651, 0.7685, 0.7709
Sup: 0.7585, 0.7547, 0.7506, 0.7489
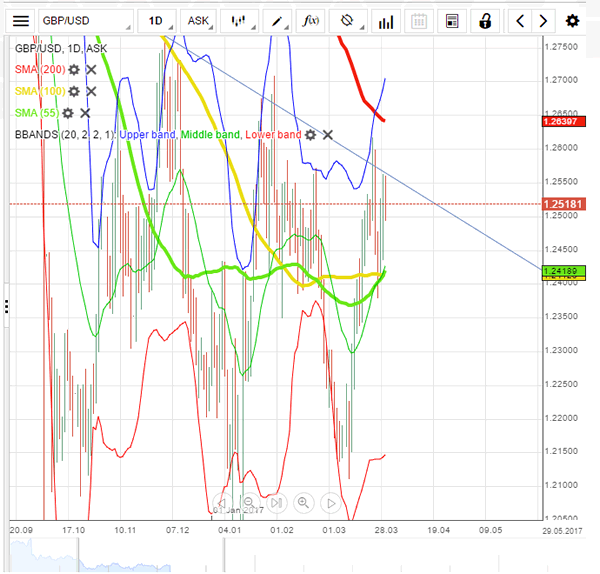
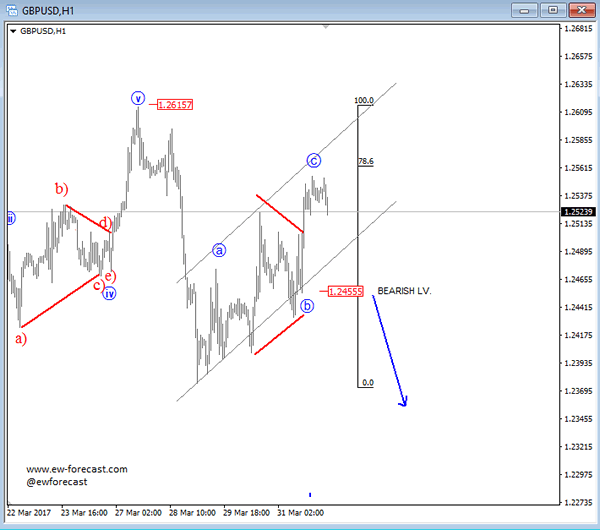
GBP/USD Intraday View
GBPUSD is turning lower at the moment after very slow and overlapping recovery up to 78.6% fib. level which is seen as a three wave move; a correction that is pointing back to march 28 low. However, 1.2455 should be broken to confirm the next bearish wave.
GBPUSD, 1H
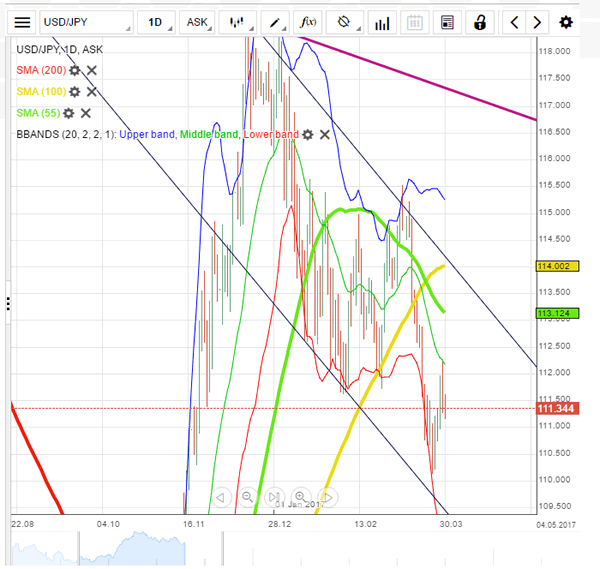
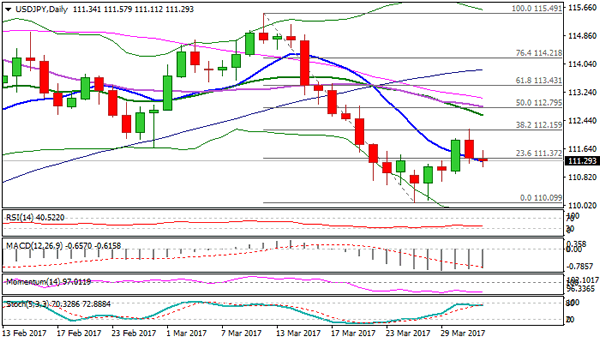
Technical Outlook: USDJPY – Near-Term Structure Is Weakening On Fresh Probes Below Weekly Cloud Top
Bullish sentiment that was regained on Thursday's break and closewell above weekly cloud top at 111.36 was offset by Friday's quick pullback after bulls briefly tested next pivot at 112.15 (Fibo 38.2% of 115.49/110.09 downleg), ending day firmly in red and closing at 111.36 level. The pair stands at the back foot on Monday as fresh near-term bears are probing below 111.36 handle (which also marks Fibo 38.2% of 110.09/112.18 upleg) and close below it would generate fresh bearish signal. Hourly studies in negative setup maintain downside pressure, as thick hourly cloud (111.44/74) so far caps recovery attempts. In addition, 4-hr studies are moving from neutral to bearish mode that also weighs on near-term action, as daily technicals maintain firm bearish mode. Sustained break below 111.36 handle would open next pivot at 110.90 (Fibo 61.8%) loss of which is needed to confirm reversal. Conversely, extended consolidation could be anticipated while the price holding around 111.36.
Res: 111.36; 111.57; 111.75; 112.15
Sup: 111.11; 110.90; 110.59; 110.09
Birtish’s Current Account Improves Significantly In Q4 2016, GDP Grows In Line With Experts’ Estimates
'We saw a sharper-than-expected narrowing in the current account deficit which may have helped to ease the margins for the concerns over the potential downside risks for the pound going forward during the upcoming Brexit negotiations.' - Lee Hardman, MUFG
Data released on Friday showed that the UK's current account deficit hit a five-year record low, which surprised many experts. In the Q4 of 2016, the current account advanced from -25.7 billion pounds to -12.1 billion pounds. The country's trade balance with the rest of the world improved dramatically. Thus, in the Q4 of 2016, total trade deficit fell from 14.8 billion pounds to 4.8 billion pounds, due to the notable increase in goods export. In addition, there was also a less significant narrowing in the deficit on primary and secondary income accounts. According to the data, the deficits on secondary income and primary income fell from 4.3 billion pounds to 1.0 billion pounds amid a surge in direct investment. Overall, the UK's current account amounted for 2.4% of GDP, which by itself grew at the pace of 0.7%. This data marked the 16th consecutive quarterly increase and secured country's steady growth. A GDP rise in the last quarter reflects strong consumer spending and satisfactory results in the consumer-related industries. However, experts also recorded a 0.9% decline in business investment that is associated with the Brexit deal uncertainties. Finally, on a year-to-year basis, the UK's GDP lost 0.4%, which was also attributable to the country's decision to leave the EU.