
Sample Category Title
How Will The French Presidential Election (Le Pen, Macron And Fillion) Affect The EU And Euro?
The first round of the French presidential election will be held on April 23 with the second round on May 7.
The forecast for the first-round vote for the three candidates: Le Pen, Macron and Fillion are 25.8%, 25.1% and 18.4% respectively. The chances for Macron and Le Peng getting into the second-round are 98% and 96% respectively, Fillion is facing an even more severe setback now as his wife is currently also under formal investigation associated with a fake parliamentary job.
Le Pen is the focus of the election because of her extreme right-wing policies and high probability to win the election. She takes a similar stance to Trump, the focus of her policies is French first, including anti-globalization, anti-immigrants, trade protectionism, making France leave the EU, repealing the Euro and reusing French Cyan etc.
Many French voters are in favour of Le Pen’s policies, due to France’s high unemployment rate and recent terror attacks; provoking citizens’ anti-foreigner sentiment.
France and Germany are the EU’s largest economies. If France also leaves the EU, following Brexit, then other member states will also likely follow, the EU will likely face the crisis of falling apart, which will result in a lower Euro.
Today UK Markit manufacturing PMI is to be released at 09:30 BST. The crucial US ISM Manufacturing and Prices Paid for March, to be released at 15:00 BST, will likely cause volatility for USD. The dollar index hit a 2-week high of 100.49 last Friday.
New York Fed president William Dudley will make a speech at 15:30 BST, followed by the FOMC member Harker at 20:00 BST, and the Richmond Fed president Jeffrey Lacker at 22:00 BST.
EUR/USD Candlesticks and Ichimoku Analysis
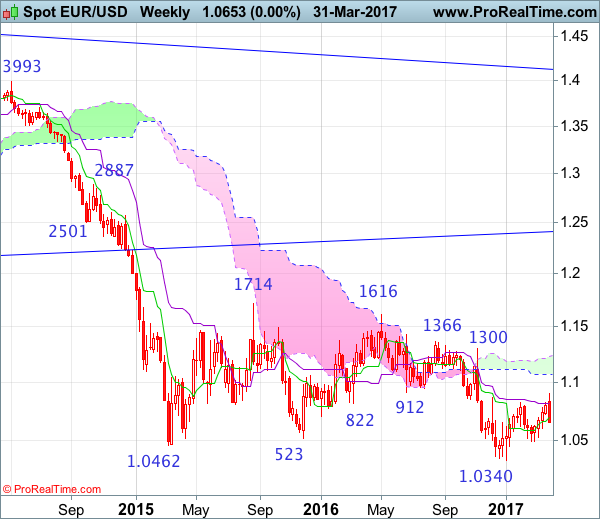
Weekly
• Last Candlesticks pattern: Shooting star
• Time of formation: 03 May 2016
• Trend bias: Down
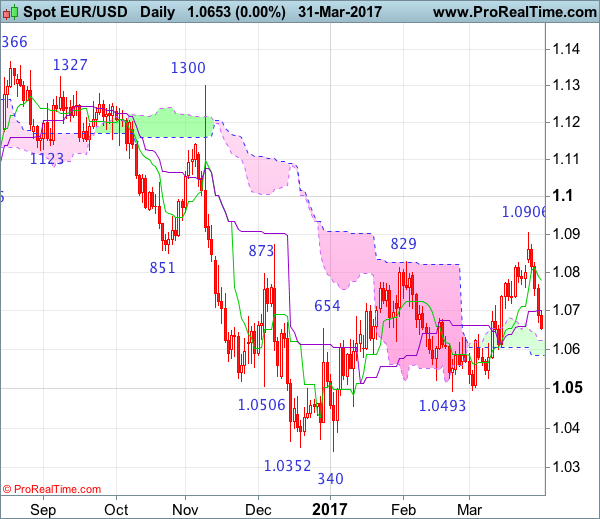
Daily
• Last Candlesticks pattern: Shooting star
• Time of formation: 3 May 2016
• Trend bias: Sideways
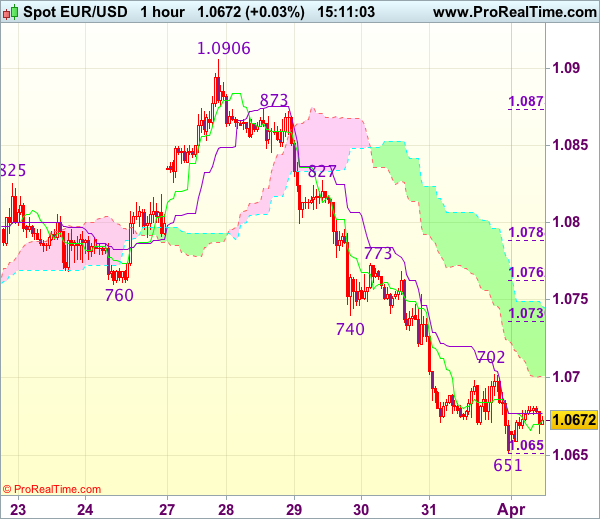
EUR/USD – 1.0868
Despite last week’s initial brief rise to 1.0906, lack of follow through buying and the subsequent much stronger-than-expected retreat formed a series of black candlesticks, suggesting top has indeed been formed at 1.0906 and downside risk remains for the fall from there to extend weakness towards support at 1.0600 but a daily close below there is needed to retain bearishness, bring test of the lower Kumo (now at 1.0585) and later towards support at 1.0525 but price should stay above pivotal support at 1.0493, bring rebound later due to near term oversold condition.
On the upside, whilst initial recovery to the Kijun-Sen (now at 1.0701) cannot be ruled out, price should falter well below the Tenkan-Sen (now at 1.0779) and bring another decline later. A daily close above the Tenkan-Sen would dampen this bearish view and suggest the fall from 1.0906 has ended instead, risk a stronger rebound to 1.0825-30 but price should falter well below said resistance at 1.0906, bring retreat later. In the unlikely event euro breaks above said last week’s high at 1.0906, this would extend the erratic rise from 1.0340 low to 1.0930-35 (61.8% Fibonacci retracement of 1.1300-1.0340), then towards 1.1000.
Recommendation: Stand aside for this week.
On the weekly chart, although the single currency opened higher last week, the subsequent deeper-than-expected retreat formed a long black candlestick, suggesting top has possibly been formed at 1.0906, hence consolidation below this level would be seen with mild downside b tis for test of 1.0600 support, break there would add credence to this view and bring further fall to 1.0525. Looking ahead, only a break of indicated pivotal support at 1.0493 would signal the rebound from 1.0340 has ended at 1.0906, bring further fall to key support at 1.0454, a sustained breach below this level would provide confirmation, then further fall to 1.0390-00 and later retest of this January low would follow.
On the upside, expect recovery to be limited to 1.0730-40 and bring another decline. Above 1.0780 would risk tabour to 1.0825-30 but price should falter well below said resistance at 1.0906, bring another decline later. Only a break of 1.0906 would revive near term bullish view for the erratic rise from 1.0340 low to bring retracement of recent decline to 1.0930-35 (61.8% Fibonacci retracement of 1.1300-1.0340) and possibly 1.1000, however, reckon upside would be limited to 1.1050-60 and price should falter below 1.1100-10, risk from there is seen for a retreat to take place later.
USD/JPY Candlesticks and Ichimoku Analysis
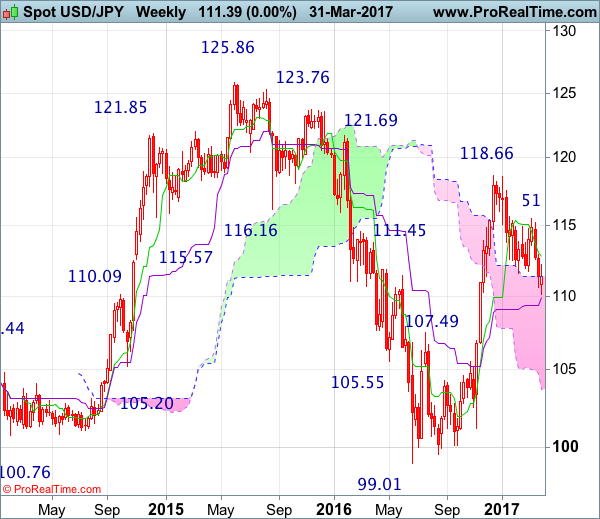
Weekly
• Last Candlesticks pattern: Marubuzo
• Time of formation: 14 Nov 2016
• Trend bias: Down
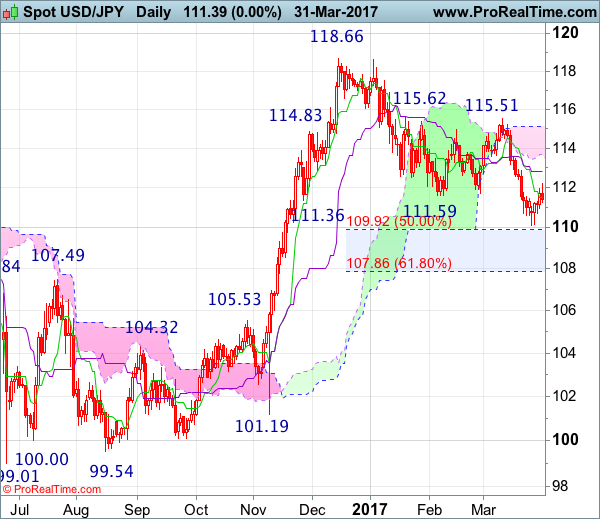
Daily
• Last Candlesticks pattern: Shooting star
• Time of formation: 15 Feb 2017
• Trend bias: Down
USD/JPY – 111.39
Although the greenback recovered after finding support at 110.11 and consolidation above this level would be seen, reckon upside would be limited to 112.20 and bring another decline later, below said support at 110.11 would signal the decline from 118.66 top has resumed and may extend weakness to 109.90-95 (50% Fibonacci retracement of 101.19-118.66), then 109.50, however, downside would be limited to 109.00 and previous support at 108.55 should hold from here, price should stay well above dynamic support at 107.85-90 (61.8% Fibonacci retracement of 101.19-118.66) and bring rebound later.
On the upside, expect recovery to be limited to 112.00 and bring another decline. Above previous support at 112.26 (now resistance) would risk test of 112.81-90 (current level of the Kijun-Sen and previous resistance) but a daily close above there is needed to signal low is possibly formed, risk a stronger rebound to 113.54 resistance, a break above there would add credence to this view, then further gain to 114.00-10 would follow.
Recommendation : Hold short entered at 111.50 for 109.50 with stop above 112.30.
On the weekly chart, as the greenback has recovered after holding above the Kijun-Sen (now at 109.91), suggesting minor consolidation above this level would be seen, however, reckon upside would be limited to 112.26 (previous support) would limit upside and bring another decline later, below 109.90-95 (current level of the Kijun-Sen and 50% Fibonacci retracement of 101.19-118.66) would extend the retreat from 118.66 to 109.00 but reckon support at 108.55 would limit downside and price should stay above 107.85-90 (61.8% Fibonacci retracement), risk from there is seen for a rebound later.
On the upside, although initial recovery cannot be ruled out, reckon upside would be limited to 112.00-10 and bring another decline. Above previous support at 112.26 (now resistance) would defer and suggest a temporary low is formed, bring test of the Tenkan-Sen (now at 112.81), a weekly close above there would add credence to this view, then further gain to 113.54 resistance and then 114.00-10 would follow but price should falter well below resistance at 115.51.
GBP/JPY Daily Outlook
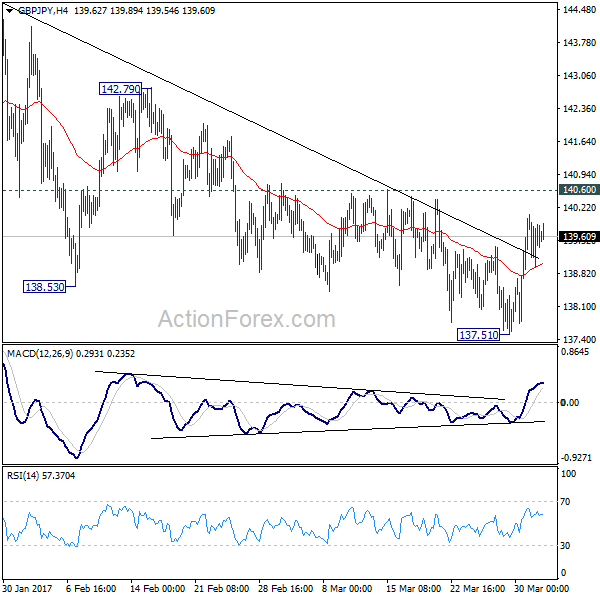
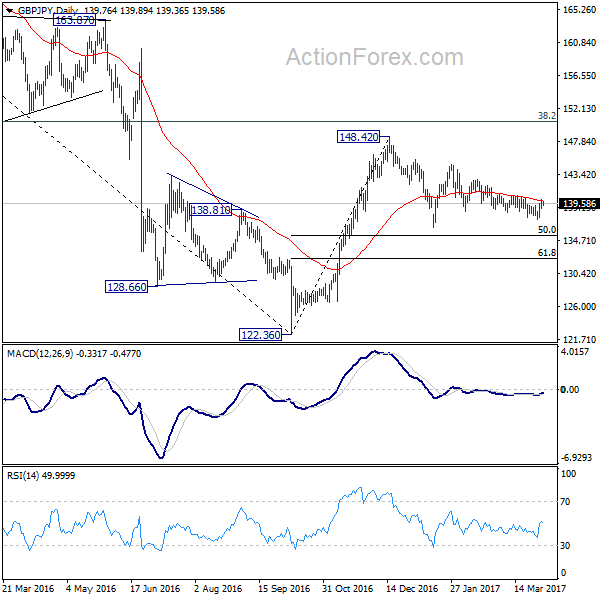
Daily Pivots: (S1) 139.13; (P) 139.60; (R1) 140.24; More...
Intraday bias in GBP/JPY remains mildly on the upside for the moment. Fall from 142.79 is likely completed. Break of 140.60 resistance should confirm near term reversal and target 142.79 resistance first. Break there will send the cross through 144.77 resistance to 148.42 high. On the downside, below 137.51 minor support will extend the fall from 142.79 towards 136.44 support. But still, price actions from 148.42 are forming a consolidation pattern. We'd expect support from 50% retracement of 122.36 to 148.42 at 135.39 to contain downside and bring rebound.
In the bigger picture, price actions from 122.36 medium term bottom are still seen as a corrective pattern. Main focus is on 38.2% retracement of 195.86 to 122.36 at 150.42. Rejection from there will turn the cross into medium term sideway pattern. Or, sustained break of 50% retracement of 122.36 to 148.42 at 135.39 will turn outlook bearish for a test on 122.36 low. Though, sustained break of 150.42 will extend the rebound towards 61.8% retracement of 195.86 to 122.36 at 167.78.
Trade Idea : USD/CHF – Buy at 0.9950
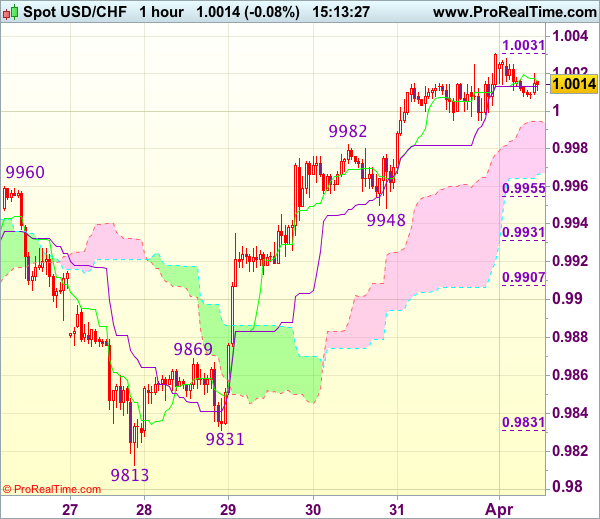
USD/CHF - 1.0020
Most recent candlesticks pattern : N/A
Trend : Near term up
Tenkan-Sen level : 1.0016
Kijun-Sen level : 1.0013
Ichimoku cloud top : 0.9995
Ichimoku cloud bottom : 0.9967
Original strategy :
Buy at 0.9950, Target: 1.0050, Stop: 0.9915
Position : -
Target : -
Stop : -
New strategy :
Buy at 0.9950, Target: 1.0050, Stop: 0.9915
Position : -
Target : -
Stop : -
As the greenback has continued trading with a firm undertone, suggesting recent rise from last week’s low at 0.9813 is still in progress and bullishness remains for this move to extend gain to previous support at 1.0060 (now resistance), however, loss of upward momentum should prevent sharp move beyond resistance at 1.0109, risk from there has increased for a retreat to take place later.
In view of this, would not chase this rise here and would be prudent to buy dollar on pullback as said support at 0.9948 should limit downside. Below 0.9931 (50% Fibonacci retracement of 0.9831-1.0031) would abort and signal top is formed instead, bring correction to 0.9905-10 (61.8% Fibonacci retracement) but reckon previous resistance at 0.9869 would hold from here.
Currencies: Dollar Shows No Clear Trend At The Start Of Q2. Euro Softness Prevails
Sunrise Market Commentary
Rates: Further underperformance of US Treasuries with key US eco data?
The US manufacturing ISM will probably key in today's trading session. We put risks on the upside of expectations, which should cause last week's underperformance of US Treasuries vs German Bunds to continue. The focus remains on the US later this week with ADP employment, non-manufacturing ISM, FOMC Minutes and payrolls.
Currencies: Dollar shows no clear trend at the start of Q2. Euro softness prevails
Last week, the dollar rebounded, but the move was not convincing. EUR/USD remained in the defensive as markets are scaling back FX bets positioning for early ECB normalization. Today, the focus turns to the early month data. The dollar needs strong data to gain sustained ground. Sterling remains well bid even as the Brexit procedure started.
The Sunrise Headlines
- US equities closed the final session of a strong quarter with minor losses (S&P: +5.5%). Lower bank shares offset gains in utilities and real estate. Asian markets started Q2 on the front foot, overcoming WS's negative lead.
- US president Trump said he plans to inform Chinese president Xi that the US will act alone against North Korea if it doesn't get more help from Beijing. Trump pushed his view that China engages in trade abuses that lead to deficits.
- S&P raised Spain's outlook of its BBB+ rating to Positive from Stable on balanced eco performance and narrowing deficit.
- French left-wing candidate Jean-Luc Melenchon's creeping gain to 16% in the polls is adding a new layer of risk to France's election. He is now within touching distance of Fillon in third place.
- Crude stockpiles are starting to drop, OPEC Secretary-General Barkindo said, a sign that supply cuts are restoring balance. However, US oil drillers added rigs for an 11th time to 662 last week, more than double the 2016 low,
- The PBOC raised interest rates for standing lending facility loans, aimed mainly at small- and medium-sized financial institutions. Rates were increased on overnight, 7-day and one-month contracts as it tries to rein in leverage.
- Confidence among Japan's large manufacturers improved in the first three months of the year as a weaker yen helped profits rise to a record.
- Today's eco calendar contains ISM manufacturing sentiment, car sales and construction spending. EMU data contain final PMI' and unemployment rate.
Currencies: Dollar Shows No Clear Trend At The Start Of Q2. Euro Softness Prevails
USD shows no clear trend at the start of Q2
On Friday, EUR/USD entered calmer waters even as the EMU inflation slowed much more than expected. The news was apparently discounted after German and Spanish data on Thursday. EUR/USD hovered in a tight range in the high 1.06 area for most of the day, but closed the session at 1.0652 (from1.0674). USD/JPY failed to sustain Thursday's rebound as the rise in core yields and the equity rally did ran into resistance. The pair closed the session at 111.39 (from 111.92).
Overnight, Asian equities are starting the quarter on a positive footing. The headline Japan Tankan indicator improved for the second quarter in a row, but the rise was more modest than expected. Capex was slightly stronger than expected. The dollar continues to trade mixed. EUR/USD is holding with reach of the correction lows reached late last week. So, the euro remains in the defensive. USD/JPY is holding in the mid 111 area.
Today, manufacturing ISM sentiment, car sales and construction spending will get attention. The March manufacturing ISM is expected to have eased slightly from 57.7 to 57.2.Most sentiments indicators improved further in March. Also on a global level, sentiment improved further. So, we put the risks on the upside of expectations. Construction spending is expected to have recouped January's 1% M/M decline in February. Given the solid single family housing starts in January, we see no reasons to deviate from consensus. Speeches of ECB Coeuré, Fed Dudley and Harker are probably less important as all three spoke already in past days.
Last week, USD sentiment improved as the US reflation trade regained traction after a very strong US consumer confidence. US Fed speakers also confirmed that further policy normalization is to be expected throughout 2017. At the same time, the euro faced headwinds. Market rumours questioned the case for early ECB policy normalization. The move was reinforced by very soft EMU inflation data. In Friday both the decline of the euro and the rebound of the dollar slowed. A good US ISM manufacturing should support a further rebound in US yields and in the dollar. That said, we have the impression that the dollar needs very strong data to gain more ST term. For EUR/USD, has the repositioning away from early ECB normalization s already been worked out. We maintain a cautious EUR/USD negative bias, but the decline might slow compared to last week's pace. We stay more cautious on the USD/JPY upside potential.
From a technical point of view, USD/JPY regained the 111.36/60 previous range bottom. This called off the imminent downside alert in this cross rate. For now, we maintain a neutral bias. EUR/USD extensively tested the topside of the MT range, but the test was rejected last week. The 1.0874/1.0906 area now looks a solid resistance. EUR/USD might return lower in the previous 1.0875/1.05 trading range.
EUR/USD: euro drifting lower in the 1.09/1.05 range
EUR/GBP
No negative Brexit fall-out on sterling yet
The final UK Q4 GDP printed at a good 0.7% Q/Q and 1.9% Y/Y on Friday, but details suggested a softening in consumer spending even as the savings ratio declined. Net exports made a substantial positive contribution to growth. Will exports continue to compensate for a slowdown in domestic spending as the Brexit-procedure continues? In a guideline for the Brexit-negotiations, EU Tusk indicated that enough progress has to be made on issues regarding the separation process before talks on future trade relations can start. The news was a bit mixed to even slightly negative for sterling, but for now it didn't hurt the UK currency. Especially EUR/GBP declined further, partially on euro weakness. The pair closed the session at 0.8485 (from 0.8562). Cable hovered mostly in the higher half of the 1.24/lower 1.25 big figure but closed the session at 1.2550.
The UK manufacturing PMI is expected to rebound slightly from 54.6 to 55.0 today. We have no reason to take a different view from the consensus. Mid- March, sterling found a better bid. Substantially higher than expected UK inflation and a more hawkish tone from the BoE supported sterling. We changed our shortterm bias on EUR/GBP from positive to neutral. Last week's decline of the euro reinforced the EUR/GBP downside momentum. Further consolidation in the MT sideways range might be on the cards. The return below the 0.8592 previous break-up suggests that a full retracement to the 0.8402 range bottom is possible. Longer term, Brexit-complications remain a potential negative for sterling. We are not convinced that the BoE will raise rates anytime soon, even not after recent higher inflation data.
EUR/GBP: euro decline and sterling short-squeeze push EUR/GBP lower in the established trading range
Trade Idea : GBP/USD – Stand aside
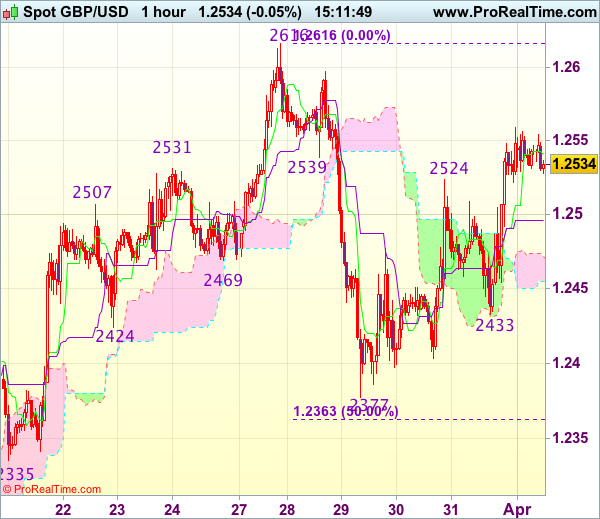
GBP/USD - 1.2527
Most recent candlesticks pattern : N/A
Trend : Near term up
Tenkan-Sen level : 1.2538
Kijun-Sen level : 1.2496
Ichimoku cloud top : 1.2472
Ichimoku cloud bottom : 1.2455
New strategy :
Stand aside
Position : -
Target : -
Stop : -
As cable found good support at 1.2433 on Friday and staged another strong rebound on active cross-trading in sterling, suggesting the erratic rise from 1.2377 (last week’s low) is still in progress and may extend gain towards 1.2570-75, however, as broad outlook remains consolidative, reckon upside would be limited to 1.2595-00 and price should falter below last week’s high at 1.2616, bring retreat later.
In view of this, would not chase this rise here and would be prudent to stand aside in the meantime. Below the Kijun-Sen (now at 1.2496) would bring weakness to the upper Kumo (now at 1.2472) but said support at 1.2433 should remain intact. Only a drop below 1.2433 support would revive bearishness and suggest the rebound from 1.2377 has ended, bring weakness to 1.2400, break there would confirm and retest of 1.2377 would follow.
EUR/JPY Daily Outlook
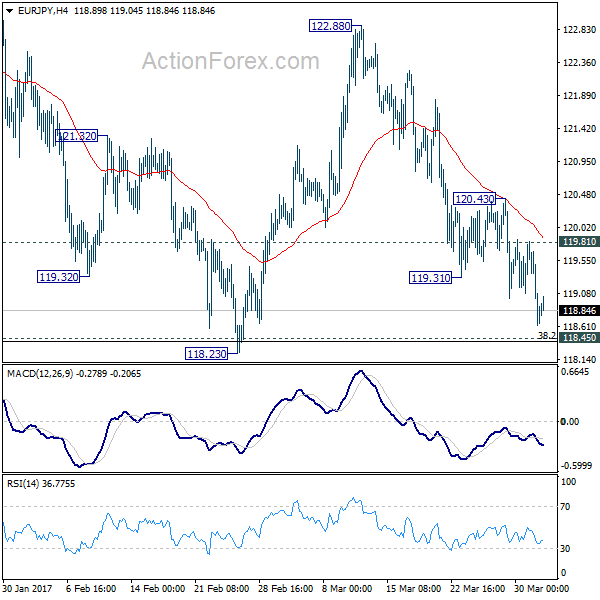
Daily Pivots: (S1) 118.26; (P) 119.03; (R1) 119.45; More...
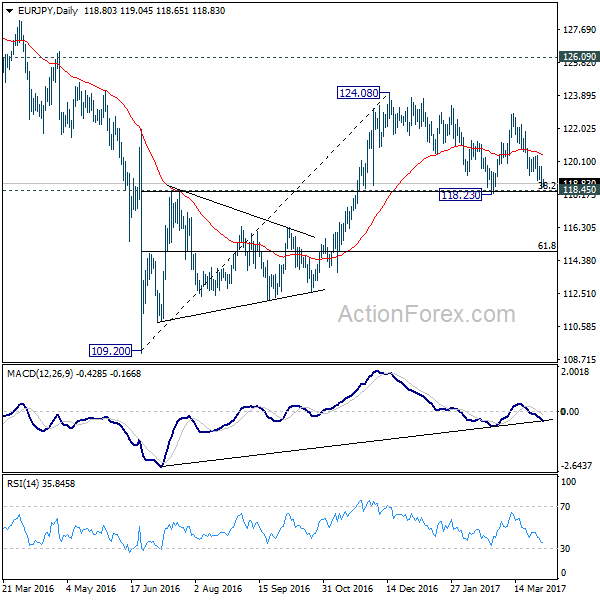
Intraday bias in EUR/JPY remains on the downside for the moment. Further fall is expected but overall, price actions from 124.08 are still viewed as a consolidation pattern. Hence we're expecting strong support from 118.39/45 (38.2% retracement of 109.20 to 124.08 at 118.39) to contain downside. On the upside, break of 119.81 resistance will indicate short term bottoming. In such case, intraday bias will be turned back to the upside for 120.43 resistance first. However, sustained trading below 118.39/45 will invalidate our view and bring deeper fall.
In the bigger picture, we're holding on to the view that medium term rise from 109.20 is still in progress. Focus is on 126.09 key resistance level. Sustained break will confirm completion of the whole decline from 149.76. And rise from 109.20 is of the same degree as the fall from 149.76. In such case, further rally would be seen to 104.04 resistance and possibly above before topping. Meanwhile, rejection from 126.09, or firm break of 118.45 cluster support, will likely extend the fall from 149.76 through 109.20 low.
Trade Idea : EUR/USD – Sell at 1.0740
EUR/USD - 1.0666
Most recent candlesticks pattern : N/A
Trend : Near term down
Tenkan-Sen level : 1.0673
Kijun-Sen level : 1.0677
Ichimoku cloud top : 1.0746
Ichimoku cloud bottom : 1.0700
Original strategy :
Sell at 1.0765, Target: 1.0645, Stop: 1.0800
Position : -
Target : -
Stop : -
New strategy :
Sell at 1.0740, Target: 1.0625, Stop: 1.0775
Position : -
Target : -
Stop : -
As the single currency has remained under pressure after last week’s selloff, suggesting the decline from 1.0906 top is still in progress and bearishness remains for this fall to extend further weakness to 1.0620-25, then test of previous chart support at 1.0600, however, a sustained breach below the latter level is needed to retain downside bias for subsequent selloff to 1.0570-75 first, otherwise, risk from there is seen for a rebound later.
In view of this, would not chase this fall here and would be prudent to sell dollar on recovery as 1.0735-40 should limit upside. Only a firm break above resistance at 1.0773 would suggest low is formed instead, bring a stronger rebound to 1.0800 but resistance at 1.0827 should remain intact.
APAC Market Update: Feeling Deflated
Fridays core inflation numbers from the U.S., Europe and Japan were anything but, giving the U.S. Dollar a helping hand to start the week.
Trading is off to a quiet start in Asia this week with the markets barely moving after President Trump's interview in the Financial Times this weekend. The major takeaways, most of which should be dollar positive to some degree, are he is prepared to take unilateral action against North Korea if China continues to vacillate. That currency manipulation and China is not of the table, and that governing is harder than he thought it would be. The last being of no surprise.
However is was Friday's core inflation numbers from the “big three” that are probably most troubling. Japan with a mind-numbing 0.1%, the U.S with an expected 1.75% and most troubling, Europe undershooting at 0.7%. Europe will have the reflationista's more than a little nervous given we are approaching the tapering phase of the ECB's quantitative easing (QE) programme. After the mother of all QE programmes in Japan, Friday's number may be causing a few sleepless nights in Tokyo as well.
At least the United State's is delivering it's inflation Nirvana, albeit at a pace the street is slightly underwhelmed with. Taken in totality Friday's numbers were USD positive with the Euro, in particular, starting the week as it finished, on a soggy note.
This week features both the ECB and FOMC minutes, President's Trump and Xi of China meeting in Florida. Perhaps over a game of golf. We then culminate in the U.S. Non-Farm Payroll on Friday. Into the mixture we see Fed. Governor Dudley speaking twice and an RBA rate decision. Mr Dudley's speeches and the non-farms being the most likely to move the needle on volatility this week.
EUR/USD
The Eur has rallied in Asia as EUR/JPY, EUR/AUD and EUR/GBP buying today, support the single currency. The Commitment of Traders (COT) report also showed a large unwind of Euro shorts against the dollar. Although supportive in the short-term, the COT is backwards looking by a week. Euro will find resistance at Friday's highs around 1.0700 with support at 1.0650, a 61.8% Fibonacci, and 1.0630 the 100-day moving average.
USD/JPY
Having failed at 112.00 again on Friday, USD/JPY sits mid-range at 111.37 today. Key support and resistance are 110.00 and 112.00 with the street unlikely to get excited until one or the other is broken. This morning's Tanken report was a fizzer, and unsurprisingly, the COT report showed a large reduction of JPY shorts from the previous week.
In the short term, USD/JPY has support at 111.10 with seller sat 111.40/50. It should remain supported in Asia by cross flows and a positive Nikkei.
AUD/USD
Post a poor building approvals data set this morning, AUD/USD is trading heavy despite AUD/JPY buying. AUD has support at 7590 with the possibility of some stop losses lurking below there. Resistance lies at 7670. The RBA rate decision tomorrow is unlikely to provide fireworks and remain unchanged. What will be interesting is if the RBA strike a quite dovish tone which could see AUD optimists heading for the door.
GBP/USD
GBP has drifted lower in Asia on EUR/GBP buying this morning, but still remains in a most un-Brexit way, near the top of its recent range at 1.2550. 1.2600 is the key resistance area to watch while support sits at 1.2520 initially. It is a light data week for the U.K. and sterling will mostly likely move to the beat of both the USD and EUR/GBP flows.
USD/CNH
Moving higher in Asia with a strong USD in general at 6.8800 today. The 6.8400 level remains the key support for the pair with resistance in the 6.9300 regions. Neither level appears to be in imminent danger unless we see a very large USD elsewhere. This may well have to wait for Friday's Non-Farms. Asia looks content to trade the 6.8700/6.8900 range today. Bring a good book to read.
USD/ZAR
President Zuma's night of the long knives with his cabinet last week is overshadowing improved South Africa trade data. As it should, with the respected finance minister removed amongst others. Traders looking for some volatility to start the week should almost certainly find it here. Political rumblings within his own ANC and the opposition mean this story may have more to run and should see USD/ZAR bid on any meaningful dips.
Support sits at 13.3000 with resistance at 13.6000. Expect this pair to remain extremely volatile and vulnerable to news headlines out of South Africa.
Overall the USD appears to be shrugging on its recent lethargy and making a quiet comeback. At the very least, the U.S. has some inflation to show for its troubles, as opposed to Europe and Japan, and in a light data week until Friday, this should be supportive.