
Sample Category Title
Asian Stocks Are Mixed
Market movers today
In the euro area, focus remains on inflation with the release of the aggregate figure. We expect headline inflation decline to 1.6% in March, from 2.0% in February, driven partly by a fall in core inflation from 0.9% to 0.7%. If this core inflation figure is correct, it will be the lowest since April 2016. However, our estimate of a decline is due mainly to the early timing of Easter in 2016, causing low inflation in volatile package holiday prices in March this year. Added to the lower core inflation, the latest decline in the oil price together with less support from base effects in energy prices is also likely to have driven headline inflation lower, although energy price inflation should still have a considerable positive contribution to inflation. Finally, food price inflation has surprised on the upside recently, due mainly to cold weather in the winter months, but should not have continued and we look for a lower contribution in March.
US PCE core inflation for February is also due for release today. While headline inflation has been increasing rapidly and is almost at the Fed's 2% target, PCE core inflation has remained stuck around 1.7%. We expect the development of PCE core inflation to attract special interest in coming months given the comments at the last FOMC meeting that the Fed has a 'symmetric inflation target', which could be interpreted as the Fed will be willing to let inflation slightly overshoot the 2% target. Hence, it implies a more dovish tone. However, we will have to see whether it actually means it. Last time PCE inflation was at 2% was at the beginning of 2012. We estimate the PCE core increased 0.2% m/m, implying 1.7% y/y. Thus, we expect core inflation to remain at the same level it has stayed at since August 2016.
In Scandi markets, we expect focus to be on Norwegian unemployment, together with the government's presentation of its Perspectives 2017 report. The Swedish wage negotiating process will also be followed closely before the current contracts run out (midnight) see more on page 2.
Selected market news
The Chinese official manufacturing PMI increased to 51.8 in March, from 51.6 in February, and is now at the highest level since 2012. Despite the continued improvement in the first few months of 2017, we believe the Chinese economy will be faced with some moderate headwinds this year, as we expect the housing market to cool and believe the significant infrastructure boost is set to fade. China has moved its foot from the gas to the brake and aims to rein in the brewing housing bubble and lean against inflationary pressure.
Asian stocks are mixed this morning but Chinese stocks have been supported by the economic figures and the Shanghai composite index added 0.3% on the last day of the month and quarter.
Despite the quarter-end there is nowhere the same stress in the European system as seen around year-end. It is likely that this move towards a more 'normal repo situation' could weigh on the short-end of the German yield curve over the next couple of days.
USDJPY Elliott wave View: Extended Bounce
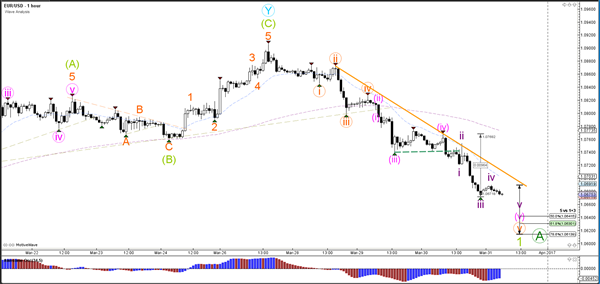
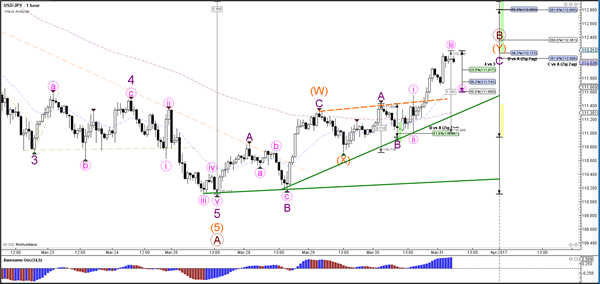
Short term Elliott Wave view in USDJPY suggests that cycle from 3/10 peak (115.53) has ended with Minor wave A at 110.077. Decline from 115.53 is unfolding as a 5 waves impulse Elliott wave structure with an extension where Minute wave ((i)) ended at 114.46, Minute wave ((ii)) ended at 115.19, Minute wave ((iii)) ended at 110.59, Minute wave ((iv)) ended at 111.34, and Minute wave ((v)) of A ended at 110.077. USDJPY ended cycle from 3/10 peak and correcting that cycle in Minor wave B bounce in 3, 7, or 11 swing.
Revised view suggests that Minor wave B bounce is unfolding as a zigzag Elliott wave structure where Minute wave ((a)) ended at 111.426 as 5 waves diagonal and Minute wave ((b)) ended at 110.96. Minute wave ((c)) of B is in progress as 5 waves and expected to complete at 112.31 – 112.63 area before pair resumes lower or at least pullback in 3 waves. As far as pivot at 3/10 high (115.53) stays intact, expect pair to extend lower or at least pullback in 3 waves once Minor wave B is complete.
1 Hour USDJPY Elliott Wave Chart
AUD/USD: Australian Private Sector Credit Rose Less Than Expected In February
>
For the 24 hours to 23:00 GMT, the AUD declined 0.29% against the USD and closed at 0.7643.
LME Copper prices rose 0.2% or $13.0/MT to $5860.0/MT. Aluminium prices rose 1.2% or $24.0/MT to $1955.0/MT.
In the Asian session, at GMT0300, the pair is trading at 0.7639, with the AUD trading slightly lower against the USD from yesterday's close.
Early morning data indicated that Australia's private sector credit recorded a rise of 0.3% on a monthly basis in February, falling short of market expectations for an advance of 0.5%. In the prior month, the private sector credit had registered a rise of 0.2%.
Elsewhere in China, Australia's largest trading partner, manufacturing PMI climbed to a level of 51.8 in March, expanding at its fastest pace in almost five years, thus adding to evidence that the world's second-largest economy is gaining steam early in the year. The PMI had registered a reading of 51.6 in the previous month, whereas markets were expecting a rise to a level of 51.7. Moreover, the nation's NBS non-manufacturing PMI rose to a two-year high level of 55.1 in March, reflecting strength in the nation's services sector and following a reading of 54.2 in the preceding month.
The pair is expected to find support at 0.7623, and a fall through could take it to the next support level of 0.7607. The pair is expected to find its first resistance at 0.7667, and a rise through could take it to the next resistance level of 0.7695.
Next week, traders will closely monitor the Reserve Bank of Australia's (RBA) interest rate decision along with Australia's AiG performance of manufacturing, services and construction PMI's as well as retail sales and trade balance data.
The currency pair is trading below its 20 Hr and 50 Hr moving averages.

EUR/USD: German Annual Inflation Came In Weaker Than Expected In March
For the 24 hours to 23:00 GMT, the EUR declined 0.74% against the USD and closed at 1.0684, following disappointing German flash inflation figures.
Data indicated that Germany's flash consumer price index (CPI) advanced less-than-expected by 1.6% on an annual basis in March, easing some pressure on the European Central Bank to wind down its massive monetary stimulus programme soon. The CPI had recorded a rise of 2.2% in the previous month, while market participants expected a gain of 1.8%.
Separately, the Euro-zone's final consumer confidence index improved to a level of -5.0 in March, meeting market expectations and confirming the preliminary print. In the prior month, the index had registered a level of -6.2.
The greenback traded higher against most of its major counterparts, after the latest data indicated that the US economy grew stronger than initially estimated in the fourth quarter of 2016.
The US annualised gross domestic product (GDP) was revised higher to 2.1% in the fourth quarter of 2016, boosted by robust consumer spending and compared to an advance of 3.5% in the previous quarter. The preliminary figures had indicated an advance of 1.9%, while markets anticipated the nation to grow by 2.0%. Meanwhile, the nation's initial jobless claims fell to a level of 258.0K in the week ended 25 March 2017, less than market expectations of a fall to a level of 247.0K and following a level of 261.0K in the previous week.
Separately, the Dallas Federal Reserve Bank President, Robert Kaplan, stated that he expects two additional interest rate increases this year.
In the Asian session, at GMT0300, the pair is trading at 1.0679, with the EUR trading marginally lower against the USD from yesterday's close.
The pair is expected to find support at 1.0643, and a fall through could take it to the next support level of 1.0606. The pair is expected to find its first resistance at 1.0742, and a rise through could take it to the next resistance level of 1.0804.
Moving ahead, investors will keep a close watch on the Euro-zone's flash consumer price index (CPI) data for March, slated to release later today along with Germany's unemployment rate and retail sales data, both for March, due in a few hours. Moreover, in the US, final Michigan consumer confidence index for March along with personal spending and income data for February, will be on investor's radar.
The currency pair is trading below its 20 Hr and 50 Hr moving averages.

GBP/USD: UK’s GfK Consumer Confidence Index Remains Stable In March
For the 24 hours to 23:00 GMT, the GBP rose 0.28% against the USD and closed at 1.2474.
In the Asian session, at GMT0300, the pair is trading at 1.249, with the GBP trading 0.13% higher against the USD from yesterday's close.
Overnight data showed that UK's GfK consumer confidence index surprisingly remained steady at -6.0 in March. Markets were anticipating it to fall to a level of -7.0.
The pair is expected to find support at 1.2419, and a fall through could take it to the next support level of 1.2348. The pair is expected to find its first resistance at 1.2543, and a rise through could take it to the next resistance level of 1.2596.
Trading trend in the GBP is expected to be determined by the release of UK's final fourth quarter GDP numbers, slated to release in a few hours.
The currency pair is trading above its 20 Hr and 50 Hr moving averages.

USD/JPY: Japan’s Unemployment Rate Falls To An Over 22-Yr Low Level In February
For the 24 hours to 23:00 GMT, the USD rose 0.63% against the JPY and closed at 111.79.
In the Asian session, at GMT0300, the pair is trading at 112.06, with the USD trading 0.24% higher against the JPY from yesterday's close.
Data released overnight showed that Japan's national consumer price index (CPI) advanced above expectations by 0.3% on an annual basis in February, while investors had envisaged for a rise of 0.2%. In the previous month, the CPI had advanced 0.4%. Additionally, the nation's jobless rate unexpectedly eased to 2.8% in February, marking its lowest level since June 1994 and boosting optimism over the health of the nation's labour market. Markets had anticipated the jobless rate to remain steady at 3.0%.
Moreover, the nation's flash industrial production rebounded 2.0% on a monthly basis in February, rising at the fastest pace in eight months and surpassing market expectations for a rise of 1.2%. In the previous month, industrial production had fallen 0.4%.
The pair is expected to find support at 111.27, and a fall through could take it to the next support level of 110.47. The pair is expected to find its first resistance at 112.5, and a rise through could take it to the next resistance level of 112.93.
The currency pair is trading above its 20 Hr and 50 Hr moving averages.

USD/CHF: Swiss Franc Trading Lower In The Morning Session
For the 24 hours to 23:00 GMT, the USD rose 0.43% against the CHF and closed at 1.0004.
On the macro front, Switzerland’s KOF economic barometer unexpectedly rose to a level of 107.6 in March, defying market consensus for a fall to a level of 105.8 and following a revised reading of 106.9 in the prior month.
In the Asian session, at GMT0300, the pair is trading at 1.0010, with the USD trading 0.06% higher against the CHF from yesterday’s close.
The pair is expected to find support at 0.9967, and a fall through could take it to the next support level of 0.9923. The pair is expected to find its first resistance at 1.0034, and a rise through could take it to the next resistance level of 1.0057.
With no economic releases in Switzerland today, investor sentiment would be governed by global macroeconomic factors.
The currency pair is trading above its 20 Hr and 50 Hr moving averages.

USD/CAD: Loonie Trading Marginally Lower, Ahead Of Canada’s January GDP Data
For the 24 hours to 23:00 GMT, the USD rose 0.03% against the CAD and closed at 1.3335.
In economic news, Canada's industrial product price index advanced less-than-expected by 0.1% on a monthly basis in February, against market expectations for a rise of 0.4% and compared to a revised increase of 0.6% in the prior month. Further, the nation's raw material price index registered a more-than-anticipated rise of 1.2% MoM in February, following a gain of 1.7% in the prior month.
In the Asian session, at GMT0300, the pair is trading at 1.334, with the USD trading a tad higher against the CAD from yesterday's close.
The pair is expected to find support at 1.3293, and a fall through could take it to the next support level of 1.3246. The pair is expected to find its first resistance at 1.3369, and a rise through could take it to the next resistance level of 1.3398.
Ahead in the day, market participants focus on Canada's crucial GDP data for January, to gain a better insight into the nation's economy.
The currency pair is trading above its 20 Hr moving average and showing convergence with its 50 Hr moving average.

EUR/USD Non-Stop Decline Breaks 1.0750 Support
Currency pair EUR/USD
The EUR/USD continues to push lower with strong bearish impulse, which could either be a wave 1 (light green) or wave A (dark green). The strong bearish trend is indicated by the resistance trend line (orange). A break above this level could signal the end of wave 1 or wave A and the retracement for wave 2 or B.
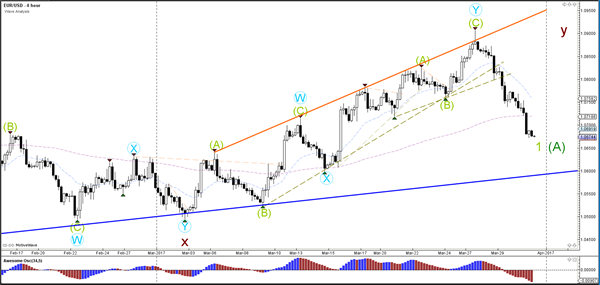
The EUR/USD broke below the 1.0750 support and support trend line (dotted green) as expected in yesterday's wave analysis and continued with the wave 5 (pink). Price seems to be building an extra 5 waves (purple) which could take price down to the Fibonacci targets.
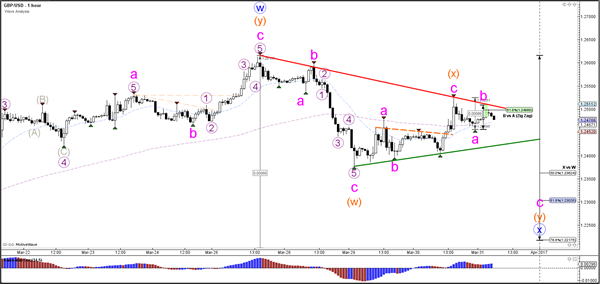
Currency pair GBP/USD
The GBP/USD remains in a triangle (red/green lines) chart pattern after breaking the smaller triangle yesterday (dotted orange). The wave WXY (orange) seems to be part of a wave X (blue) which could fit in a WXY (blue) within a larger wave E (green) triangle.
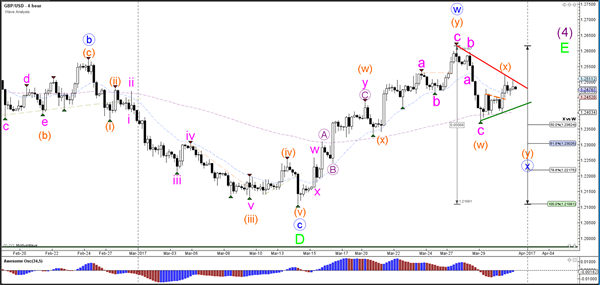
The GBP/USD seems to have completed the wave X (orange) at the 61.8% Fibonacci level mentioned yesterday at around 1.2525. Now price has turned and it seems to be building a bearish ABC (pink). A break below support (green) could confirm the bearish breakout whereas a break above resistance (red) would indicate an expansion of the wave X (orange).
Currency pair USD/JPY
The USD/JPY broke above the resistance trend line (dotted orange) and managed to retrace back to the 38.2% Fibonacci levels of wave B vs A, which could act as a resistance level. A break above this Fib could see price challenge the 50-61.8% Fibonacci zone. A bearish bounce could see price test the support trend line (green).
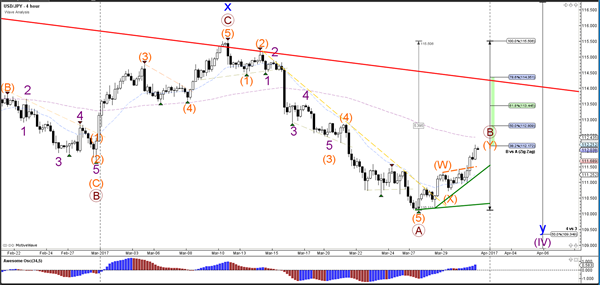
The USD/JPY indeed bounced at the Fibonacci levels of wave B vs A and continued with a strong bullish momentum which could be a wave 3 (pink). In that case, a wave 4 (pink) retracement could develop but price needs to stay above the 50% Fib of wave 4 vs 3 otherwise the wave 4 is invalidated.
Daily Technical Outlook And Review
A note on lower timeframe confirming price action...
Waiting for lower timeframe confirmation is our main tool to confirm strength within higher timeframe zones, and has really been the key to our trading success. It takes a little time to understand the subtle nuances, however, as each trade is never the same, but once you master the rhythm so to speak, you will be saved from countless unnecessary losing trades. The following is a list of what we look for:
- A break/retest of supply or demand dependent on which way you're trading.
- A trendline break/retest.
- Buying/selling tails ... essentially we look for a cluster of very obvious spikes off of lower timeframe support and resistance levels within the higher timeframe zone.
- Candlestick patterns. We tend to only stick with pin bars and engulfing bars as these have proven to be the most effective.
EUR/USD
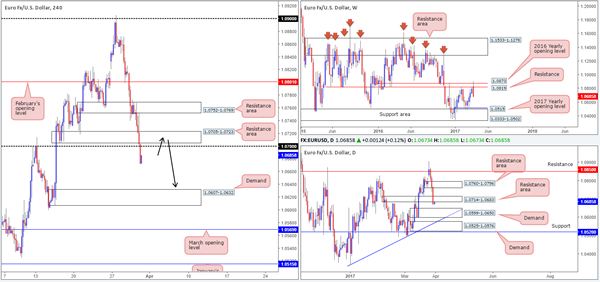
The EUR/USD, as you can see, has been trading south for the past three days, down from Monday's high at 1.0905. Yesterday's decline aggressively swallowed both the H4 demand at 1.0705-1.0723 (now acting resistance area) and the 1.07 handle, potentially opening up the path south down to a H4 demand fixed at 1.0607-1.0632.
Over on the bigger picture, we can see that a daily support area at 1.0714-1.0683 (now acting resistance area) was also taken out during yesterday's bearish assault. According to the weekly timeframe, the next downside target does not come into view until the 2017 yearly opening level at 1.0515/support area at 1.0333-1.0502.
Our suggestions: To our way of seeing things, the pair reflects a strong bearish stance at present. On that account, our desk will be watching for H4 price to retest the 1.0705-1.0723/1.07 neighborhood as resistance today. Assuming this comes to fruition, and the pair chalks up a reasonably sized H4 bearish candle from this area, a short with a target objective set at the H4 demand drawn from 1.0607-1.0632 could be an option (as per the black arrows).
Should the above setup come into view today, it may be worth noting that there is also a daily demand seen just below at 1.0599-1.0650. Therefore, once price crosses paths with the 1.0650 level (the top edge of this zone), you may want to think about reducing risk to breakeven!
Data points to consider: German retail sales at 7am, German unemployment change at 8.55am, EUR CPI flash estimate at 10am. US Core PCE data at 1.30pm, FOMC Dudley speaks at 2pm as well as FOMC member Kashkari speaking at 3pm GMT.
Levels to watch/live orders:
- Buys: Flat (stop loss: N/A).
- Sells: 1.0705-1.0723/1.07 ([watch for a reasonably sized H4 bearish candle to form from here before pulling the trigger] stop loss: ideally beyond the rejection candle's wick).
GBP/USD
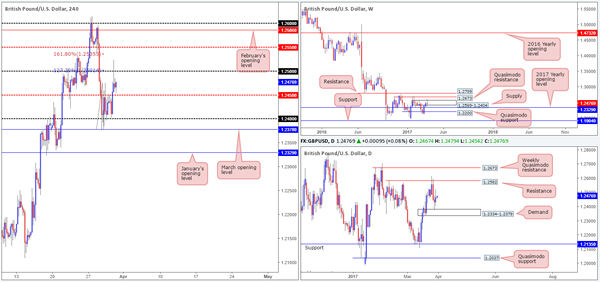
Today's story on the GBP/USD shows that price recently extended Wednesday's bounce from daily demand at 1.2334-1.2379 to a high of 1.2523. H4 action, however, reveals that price was unable to sustain gains beyond the Fib ext. 161.8% at 1.2535/127.2% at 1.2501 and round number 1.25 during Thursday's segment. While H4 bulls still appear to have a hand in this fight, let's remember that weekly price is confined within the walls of a supply base coming in at 1.2569-1.2404.
As can be seen from the higher-timeframe structure, there's clearly a difference of opinion here. So, unfortunately we have little direction to hang our hat on at the moment.
Our suggestions: In the absence of clearer price action, our team has come to a general consensus that remaining flat is the safer route to take today.
Data points to consider: UK current account data as well as final GDP release at 9.30am, MPC member Haldane speaks at 10pm. US Core PCE data at 1.30pm, FOMC Dudley speaks at 2pm as well as FOMC member Kashkari speaking at 3pm GMT.
Levels to watch/live orders:
- Buys: Flat (stop loss: N/A).
- Sells: Flat (stop loss: N/A).
AUD/USD
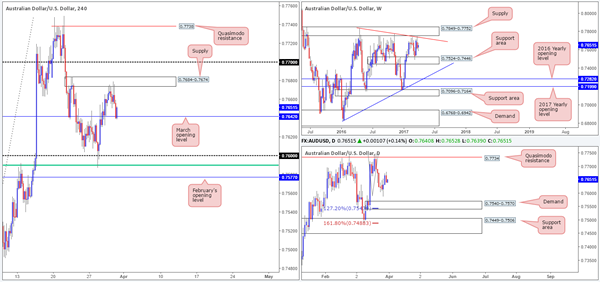
With the pair managing to break a two-day bullish phase, yesterday's trading saw the commodity-linked currency selloff from a H4 supply zone coming in at 0.7684-0.7674, ending the day touching gloves with March's opening line at 0.7642. Despite H4 price showing signs of recovery from this monthly level, we feel there's scope for further downside here. This is largely due to daily action possibly forming a D-leg to an AB=CD formation taken from the high 0.7749. This pattern completes between the Fib ext. 127.2% at 0.7543 (seen within the lower limits of the daily demand at 0.7540-0.7570) and 161.8% at 0.7488, which happens to be positioned within a daily support area at 0.7449-0.7506.
Our suggestions: In view of the above points, our desk has absolutely no interest in buying from March's opening level today. Should this level be taken out and retested as resistance on the other hand, taking an intraday short from this region, targeting the H4 Quasimodo support at 0.7603 (shadowed closely by 0.76) could be an option.
Data points to consider: US Core PCE data at 1.30pm, FOMC Dudley speaks at 2pm as well as FOMC member Kashkari speaking at 3pm GMT.
Levels to watch/live orders:
- Buys: Flat (stop loss: N/A).
- Sells: Watch for price to engulf 0.7642 and then look to trade any retest seen thereafter ([waiting for a lower-timeframe confirming signal to form [see the top of this report] before executing a trade is advised] stop loss: dependent on where one confirms this level).
USD/JPY
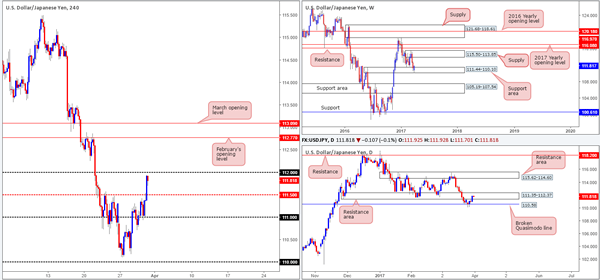
Underpinned by a weekly support area at 111.44-110.10, the bulls are showing signs of recovery. Providing that this continues, there's potential for price to challenge the supply zone seen at 115.50-113.85. Down on the daily timeframe, however, the unit is seen trading within a resistance area coming in at 111.35-112.37. The pair is likely to find some resistance here with the zone having been a strong barrier of support on a number of occasions in the past.
With US yields rallying north and the DOW 30 punching to a fresh high of 20753 yesterday, the H4 candles broke through the mid-level resistance at 111.50 and closed just ahead of the 112 handle. Seeing as how price is close to testing 112 and the fact that daily price is seen within a resistance area right now, we would refrain from entering into a buy position just yet.
Our suggestions: A close above 112, followed by a retest as support and a reasonably sized H4 bull candle is, we believe, enough to justify a long position, targeting February's opening line at 112.77 as an initial take-profit zone. Granted, this setup would entail buying into the upper edge of the daily resistance area, but given the strength seen from the weekly support area at present coupled with a (possible) close above 112, we feel a long is worth the risk.
Data points to consider: US Core PCE data at 1.30pm, FOMC Dudley speaks at 2pm as well as FOMC member Kashkari speaking at 3pm GMT.
Levels to watch/live orders:
- Buys: Watch for price to engulf 112 and look to trade any retest seen thereafter ([waiting for a reasonably sized H4 bull candle to form following the retest is advised] stop loss: ideally beyond the candle's rejection tail).
- Sells: Flat (stop loss: N/A).
USD/CAD
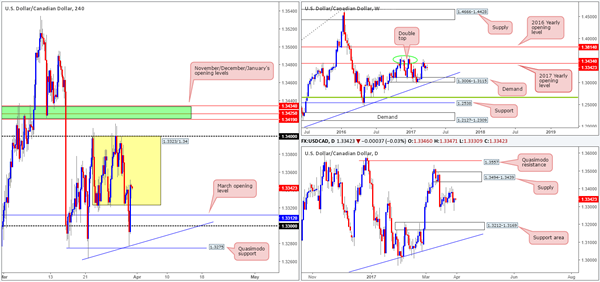
During the course of yesterday's sessions, we can see that H4 price whipsawed below the consolidation fixed between 1.3323/1.34, and came within striking distance of tapping the Quasimodo support at 1.3275. Of particular interest is that this H4 range formed just below the 2017 yearly opening level at 1.3434.
With H4 price looking poised to extend north up to the upper edge of the current range, where do we go from here? Well, we still have a keen interest in the H4 1.3434/1.3419 (November, December and January's opening levels) region for shorts. Here's why:
Of note is the 1.34 handle (the top edge of the H4 range). Psychological levels are prone to fakeouts, and with 1.3434/1.3419 lurking just above 1.34, we feel it'd be a fantastic barrier to help facilitate a fakeout.
When these monthly levels converge, we typically find that they hold firm the majority of the time offering at least a bounce.
Our suggestions: To short, we are looking for the lower timeframes to respect the above noted 1.3434/1.3419 area (see the top of this report for ideas on how to short using lower-timeframe structure). From this point, 1.34 could be a potentially troublesome level, so we'd be looking for this base to be consumed, which would in turn be our cue to reduce risk to breakeven.
Data points to consider: US Core PCE data at 1.30pm, FOMC Dudley speaks at 2pm as well as FOMC member Kashkari speaking at 3pm. Canadian GDP at 1.30pm GMT.
Levels to watch/live orders:
- Buys: Flat (stop loss: N/A).
- Sells: 1.3434/1.3419 ([waiting for a lower-timeframe confirming signal to form prior to pulling the trigger is advised] stop loss: dependent on where one confirms this region).
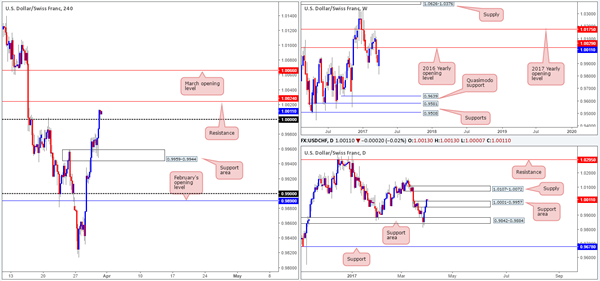
USD/CHF
The bullish pulse continues to beat in the USD/CHF market this morning. The H4 support area at 0.9959-0.9944 held beautifully and ended the day with the candles engulfing parity (1.0000). Also noteworthy is daily price taking out the supply at 1.0001-0.9957, which is in the process of being retested as a support area.
Whilst the retest off 1.0000 looks to be an attractive buy, it might be worth noting that just ahead of H4 price sits resistance planted at 1.0024. In addition to this, we can also see the 2016 yearly opening base line at 1.0029! As a result, our desk will not be participating in any buying activity just yet.
Our suggestions: Ultimately, we would really like to see 1.0024 taken out today. A H4 close beyond this number is, at least in our view, a reasonably strong indication that the pair will trade up to March's opening level at 1.0066. Following a H4 close higher here, we would like to see price retest this line as support and print a lower-timeframe confirming buy setup (see the top of this report), before looking to press the buy button.
Data points to consider: US Core PCE data at 1.30pm, FOMC Dudley speaks at 2pm as well as FOMC member Kashkari speaking at 3pm GMT.
Levels to watch/live orders:
- Buys: Watch for price to engulf 1.0024 and look to trade any retest seen thereafter ([waiting for a lower-timeframe confirming signal to form following the retest is advised] stop loss: dependent on where one confirms this level).
- Sells: Flat (stop loss: N/A).
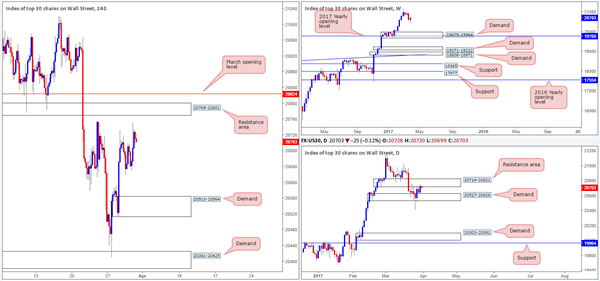
DOW 30
The US equity market punched to a fresh high of 20753 yesterday, but concluded trade by pulling back to lows of 20699. This, as you can probably see, also brought the index slightly higher into the jaws of a daily resistance area coming in at 20714-20821. While there is a H4 resistance area seen just overhead at 20769-20801, which happens to be submerged within the above noted daily resistance area, we are a little concerned about the validity of this region. This is largely due to seeing weekly action in the process of printing a nice-looking buying tail on a pullback from record highs of 21170. It takes a lot of money (professional money) to create such a pattern on this scale!
Our suggestions: Neither a long nor short seems attractive at this time. It doesn't help to see daily price so tightly confined between the aforementioned resistance area and demand at 20527-20626. To confirm bullish strength, we want to see H4 price close above March's opening level at 20824.That way, we can be pretty sure that daily offers have also been taken out as well (the daily resistance area mentioned above at 20714-20821).
Data points to consider: US Core PCE data at 1.30pm, FOMC Dudley speaks at 2pm as well as FOMC member Kashkari speaking at 3pm GMT.
Levels to watch/live orders:
- Buys: Watch for H4 price to engulf 20824 before considering longs in this market.
- Sells: Flat (stop loss: N/A).
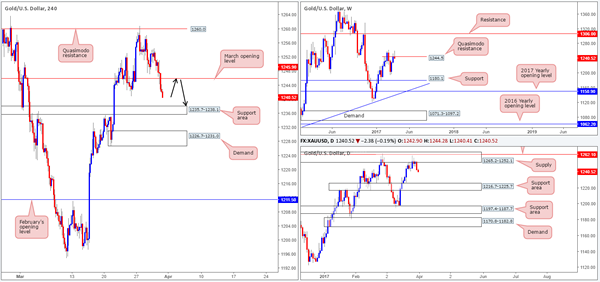
GOLD
Despite the yellow metal bouncing from March's opening level at 1245.9 yesterday, the unit continued to decline in value. As can be seen from the weekly chart, price is now seen trading back below the Quasimodo resistance level at 1244.5, and daily action shows little support in the way until we reach the 1216.7-1225.7 area.
Therefore, buying from the nearby H4 support area at 1235.7-1238.1 is not really something we would get excited about. In fact, we're hoping that price does not connect with this zone before retesting March's opening level! 1245.9 would make for a beautiful short setup, using the aforementioned H4 support area as an initial target zone.
Our suggestions: Should H4 price retest 1245.9 before shaking hands with the above noted H4 support area, we would, assuming a lower-timeframe sell signal was also present (see the top of this report), look to short this market.
Levels to watch/live orders:
- Buys: Flat (stop loss: N/A).
- Sells: 1245.9 region ([waiting for a lower-timeframe confirming signal to form is advised before pulling the trigger [stop loss: dependent on where one confirms this area).