
Sample Category Title
Trade Idea Update: GBP/USD – Stand aside
GBP/USD - 1.2490
Original strategy :
Sell at 1.2500, Target: 1.2365, Stop: 1.2535
Position : -
Target : -
Stop : -
New strategy :
Stand aside
Position : -
Target : -
Stop : -
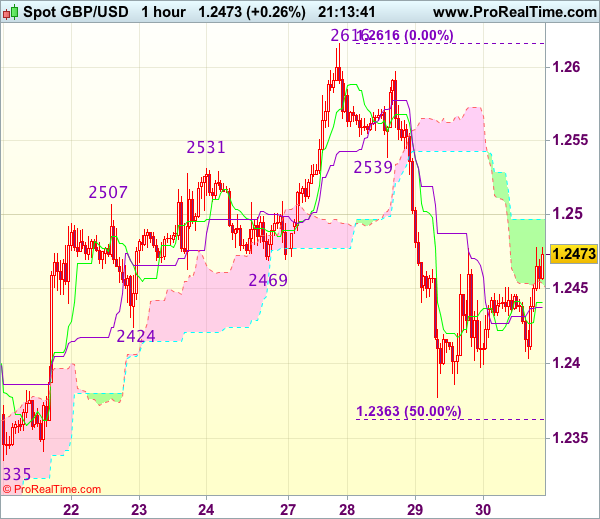
As cable has rebounded in NY morning, suggesting near term upside risk remains for the corrective bounce from 1.2377 (yesterday’s low) to extend gain to 1.2520-25, however, break of previous support at 1.2539 is needed to signal the fall from 1.2616 has ended, bring further rise to 1.2555-60 but reckon upside would be limited to 1.2595-00 and price should falter below resistance at 1.2616.
In view of this, would not chase this rise here and would be prudent to stand aside in the meantime. Below 1.2450-55 would suggest an intra-day top is possibly formed, bring weakness to 1.2425-30 but break of 1.2395-00 is needed to signal the rebound from 1.2377 has ended, brig retest of this level, then 1.2360-65 (50% Fibonacci retracement of 1.2109-1.2616), however, support at 1.2335 should limit downside and reckon 1.2300-05 (61.8% Fibonacci retracement) would hold.
EUR/GBP Mid-Day Outlook
Daily Pivots: (S1) 0.8608; (P) 0.8671; (R1) 0.8720; More...
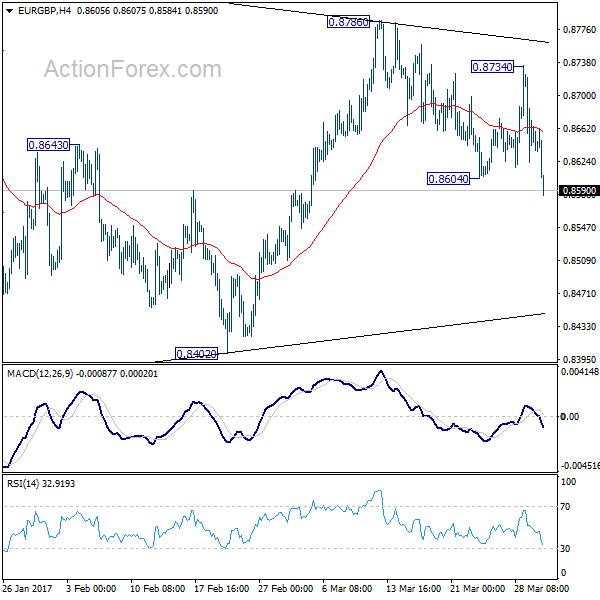
EUR/GBP's break of 0.8604 minor support indicates resumption of fall from 0.8786. Intraday bias is back on the downside for 0.8402 support next. Price actions from 0.8303 are forming a corrective pattern, as the second leg of the correction from 0.9304. Break of 0.8402 will extend the correction from 0.9304 through 0.8303 low. In that case, we'd expect strong support from 0.8116 cluster support to contain downside and bring rebound.
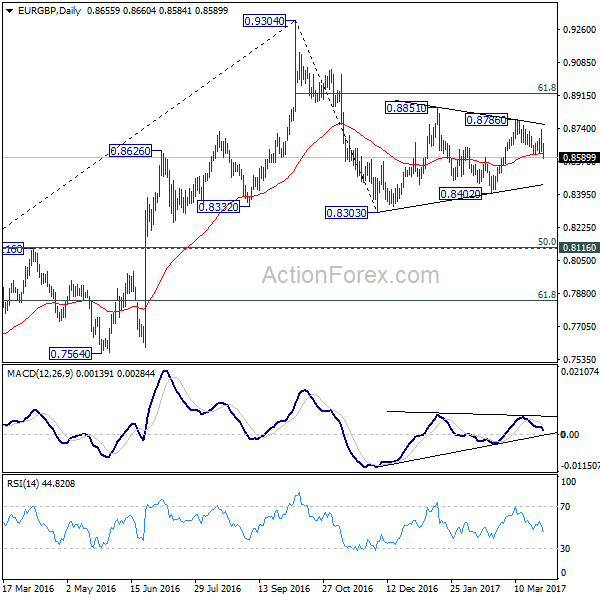
In the bigger picture, price actions from 0.9304 are viewed as a medium term corrective pattern. Deeper fall cannot be ruled out yet. But we'd expect strong support from 0.8116 cluster support (50% retracement of 0.6935 to 0.9304 at 0.8120) to contain downside. Overall, the corrective pattern would take some time to complete before long term up trend resumes at a later stage. Break of 0.9304 will pave the way to 0.9799 (2008 high).
Yen Steady as US GDP Meets Expectations
The Japanese yen has ticked lower in the Thursday session. In North American trade, USD/JPY is trading at 111.40. On the release front, US Final GDP posted a gain of 2.1%, edging above the estimate of 2.0%. Unemployment claims jumped to 258 thousand, above the forecast of 244 thousand. Later in the day, Japan releases Household Spending and Tokyo Core CPI. The markets are braced for declines from both indicators. On Friday, the US releases UoM Consumer Sentiment, which is expected to improve to 97.8 points.
The markets are likely to be treated to "more of the same" from the Bank of Japan as far as monetary policy. Earlier in the week, the BoJ released a summary of the minutes of its policy meeting from March 16. There were no surprises, as policymakers said the BoJ's ultra-easy monetary stance would continue as long as inflation remains well below the target of 2 percent. Japan's economy has improved in recent months, boosted by a stronger manufacturing sector and an increase in exports. At the same time, domestic demand remains soft, which has resulted in weak inflation levels. Japan will release key consumer spending and inflation numbers on Thursday, and soft readings could hurt the Japanese yen.
Trade Idea Update: EUR/USD – Sell at 1.0820
EUR/USD - 1.0731
Original strategy :
Sell at 1.0820, Target: 1.0720, Stop: 1.0855
Position : -
Target : -
Stop : -
New strategy :
Sell at 1.0820, Target: 1.0720, Stop: 1.0855
Position : -
Target : -
Stop : -
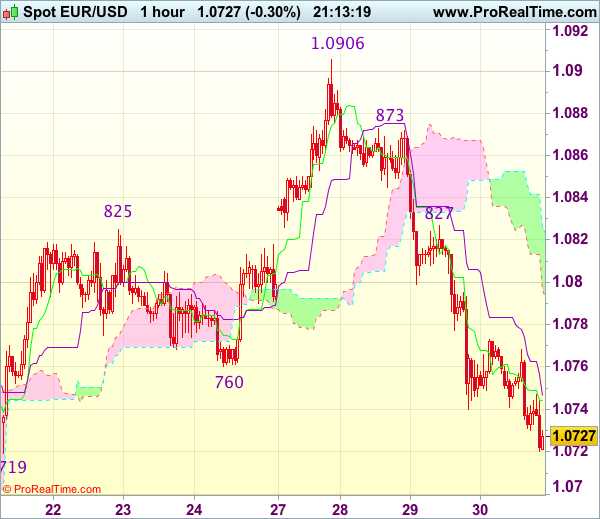
As the single currency has remained under pressure after this week’s selloff from 1.0906 top, suggesting bearishness remains for further decline towards previous support at 1.0719, however, break there is needed to retain downside bias and signal recent rise has ended at 1.0960, then further weakness to 1.0695-00 and possibly 1.0670 would be seen but oversold condition would limit downside and reckon 1.0650 would hold from here, risk from there is seen for a rebound to take place later.
In view of this, would not chase this fall here and would be prudent to sell dollar on recovery as 1.0827 resistance should limit upside and bring another decline. Above 1.0845-50 would abort and signal the fall from 1.0906 has ended instead, bring test of 1.0873 resistance first.
WTI Oil – Fresh Bullish Extension Pressures Psychological $50 Barrier
WTI oil came ticks ahead of psychological $50 barrier on extension of yesterday's strong rally.
Oil price was boosted by oil stocks reports that showed lower than expected build in US stockpiles; supply disruption in Libyan oil fields and rumors that OPEC's production cut deal could be extended beyond June 2017.
Strong rally that extends into third straight day improved oil's technical outlook, as the price regained strong bullish momentum.
The price is looking for clear break above psychological $50.00 barrier and $50.10 (Fibo 38.2% of $55.00/$47.07 descend) to extend recovery from $47.07 double-top.
Daily close above these pivots is needed to confirm bullish continuation and expose next target at $51.00 (daily Kijun-sen line).
Meantime, overbought studies suggest correction, as $50.00 marks very significant resistance.
Session low at $49.28 marks solid support, reinforced by rising 4-hr SMA and guarding strong support at $48.80 (200SMA).
Res: 50.00; 50.53; 51.00; 51.14
Sup: 49.50; 49.28; 48.80; 48.59
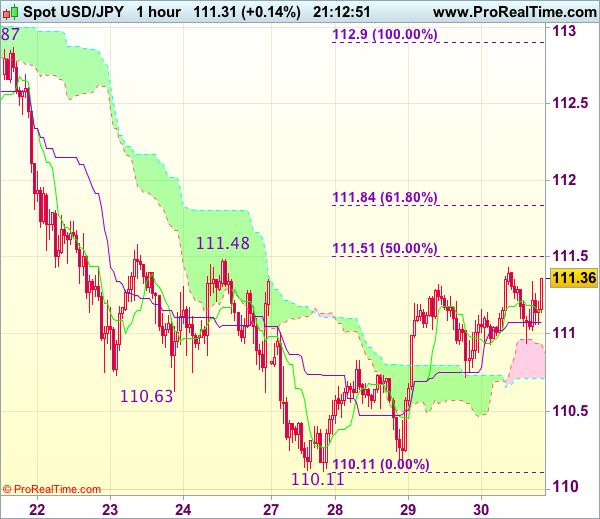
Trade Idea Update: USD/JPY – Stand aside
USD/JPY - 111.47
New strategy :
Stand aside
Position : -
Target : -
Stop : -
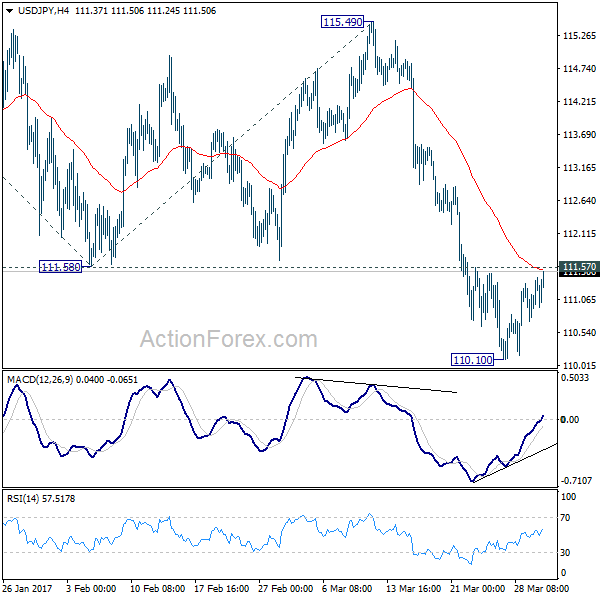
As the greenback has risen again after finding support around the upper Kumo, suggesting the erratic rise from 110.11 low is still in progress and near term upside risk remains for this move to bring retracement of recent decline, hence gain to 111.80-85 (61.8% Fibonacci retracement of 112.90-110.11) cannot be ruled out, however, reckon upside would be limited to 112.00 and price should falter below previous support at 112.26, bring retreat later.
In view of this, would not chase this rise here and would be prudent to stand aside in the meantime. Below 110.90-95 would suggest an intra-day top is formed and bring further fall to 110.45-50, then towards this week’s low at 110.11, however, only break there would revive bearishness and extend recent decline to 109.95-00, then towards 109.70-75.
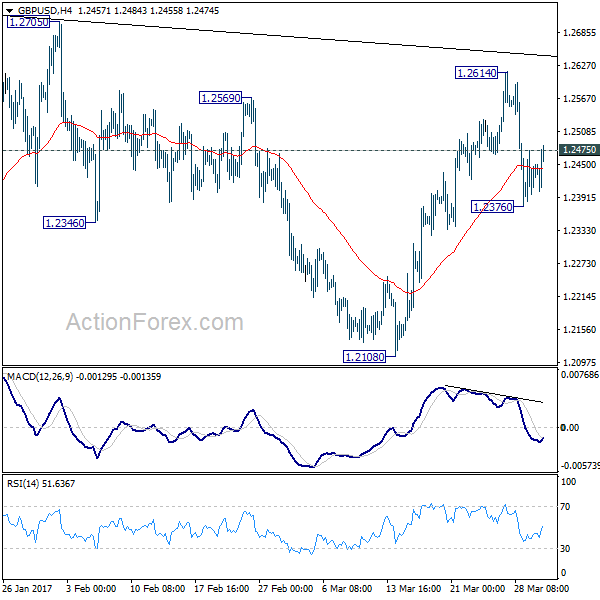
GBP/USD Mid-Day Outlook
Daily Pivots: (S1) 1.2381; (P) 1.2428; (R1) 1.2482; More...
GBP/USD's rebound and break of 1.2475 minor resistance argues that pull back from 1.2614 might be completed. Intraday bias is turned back to the upside for 1.2614. Break will extend the rise from 1.2108. Overall, price actions from 1.1946 are viewed as a consolidation pattern pattern. Upside should be limited by 1.2705/2774 resistance zone to bring larger down trend resumption eventually. On the downside, below 1.2376 will target 1.2108 support next.
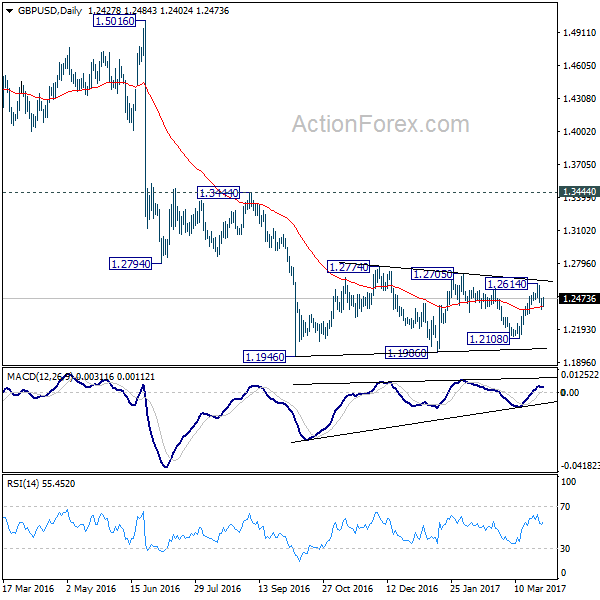
In the bigger picture, fall from 1.7190 is seen as part of the down trend from 2.1161. There is no sign of medium term reversal yet. Sustained trading below 61.8% projection of 2.1161 to 1.3503 from 1.7190 at 1.2457 will target 100% projection at 0.9532. Overall, break of 1.3444 resistance is needed to confirm medium term bottoming. Otherwise, outlook will remain bearish.
USD/JPY Mid-Day Outlook
Daily Pivots: (S1) 110.47; (P) 110.84; (R1) 111.49; More....
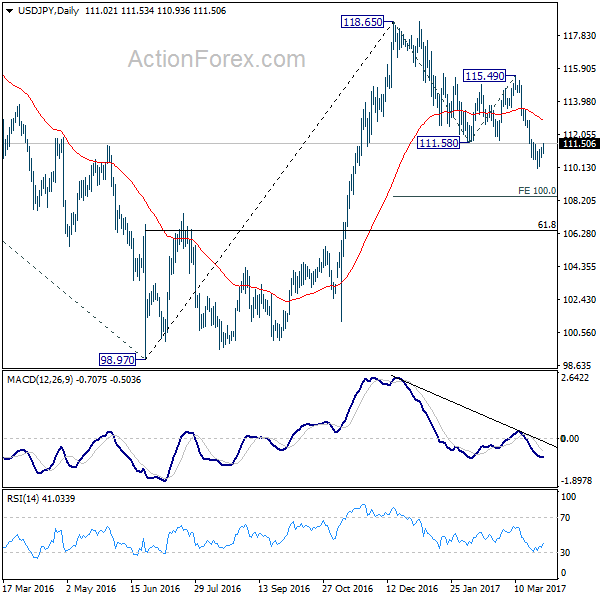
Intraday bias in USD/JPY remains neutral as it's bounded in range of 110.10/111.57. With 111.57 minor resistance intact, further fall is still in mildly favor. On the downside, break of 110.10 will extend the current fall from 118.65 to 100% projection of 118.65 to 111.58 from 115.49 at 108.42 and possibly below. Meanwhile, firm break of 111.57 will indicate short term bottoming and bring rebound back to 55 day EMA (now at 112.88).
In the bigger picture, price actions from 125.85 high are seen as a corrective pattern. sustained trading below 55 week EMA (now at 111.11) will indicates that such consolidation is not completed. And another fall would be seen back to 98.97 as the third leg. In that case, downside would be contained by 61.8% retracement of 75.56 to 125.95 at 94.77 to complete the correction. On the upside, above 115.49 will extend the rise from 98.97 to retest 125.85 first. Overall, up trend from 75.56 is expected to resume after the consolidation from 125.85 completes.
USD/CHF Mid-Day Outlook
Daily Pivots: (S1) 0.9924; (P) 0.9950; (R1) 0.9988; More.....
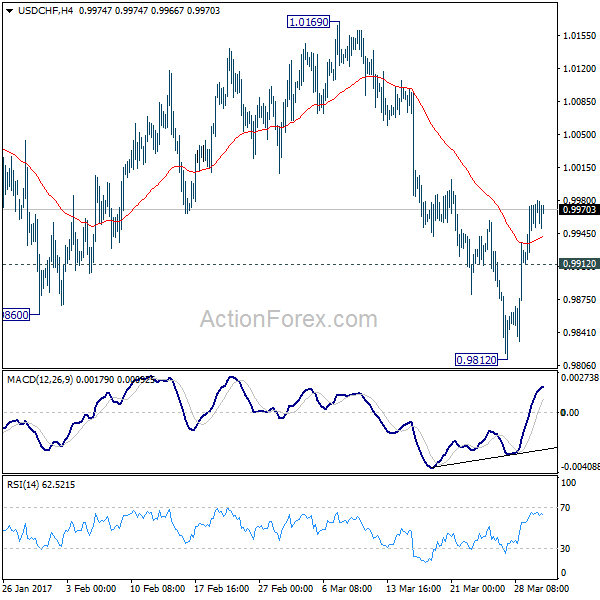
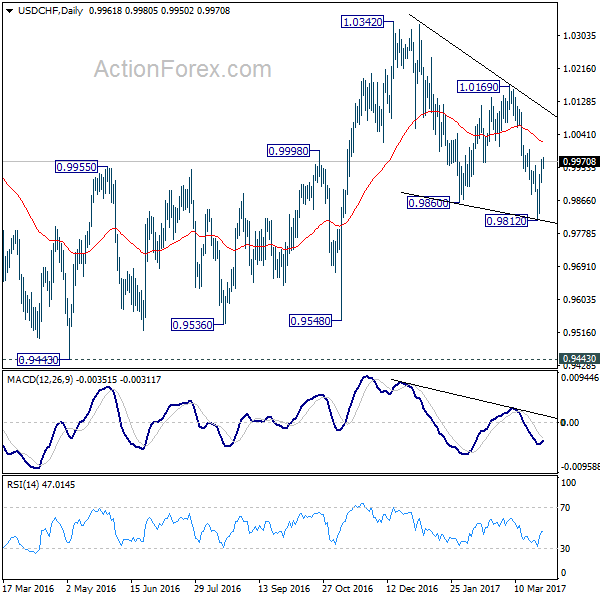
USD/CHF's rebound from 0.9812 is still in progress and intraday bias remains on the upside at this point. The rise from 0.9812 short term bottom should target 55 day EMA (now at 1.0023) next. Sustained trading above there will argue that whole decline from 1.0342 has completed. Further rise should then be seen to 1.0169 resistance for confirmation. On the downside, below 0.9912 minor support will turn bias back to the downside for 0.9812 instead.
In the bigger picture, USD/CHF is staying in medium term sideway pattern between 0.9443/1.0342. In any case, decisive break of 1.0342 resistance is needed to confirm underlying strength. Otherwise, we'll stay neutral in the pair first. In case of deeper fall, we'd expect strong support from 0.9443/9548 support zone.
USD/JPY Holds Above Support Ahead of US Data
The dollar index has rebounded noticeably from a 4-and-a-half-month low of 98.85, helped by outperforming US consumer confidence for March, and recent Fed comments. This morning, the dollar index rallies and touches a 1-week high of 100.02.
Monday March 27, USD/JPY hit the lowest level of 110.10 since November 18, caused by the slump of USD on Trump's healthcare bill failure.
Since then, the downtrend was held above the significant support line at 110.00, where there is relatively strong support.
On the 4-hourly chart, the 10 SMA has crossed over the 20 SMA from below, indicating the trend has turned bullish.
Today, at 13:30 BST, sees the release of US initial jobless claims (the week ending March 24), Q4 GDP final reading and Q4 PCE inflation figures for March; with better-than-expected readings it is likely to provide further support to USD.
The resistance level is at 111.40, followed by 111.70 and 112.00.
The support line is at 111.00, followed by 110.70 and 110.40.

