Sample Category Title
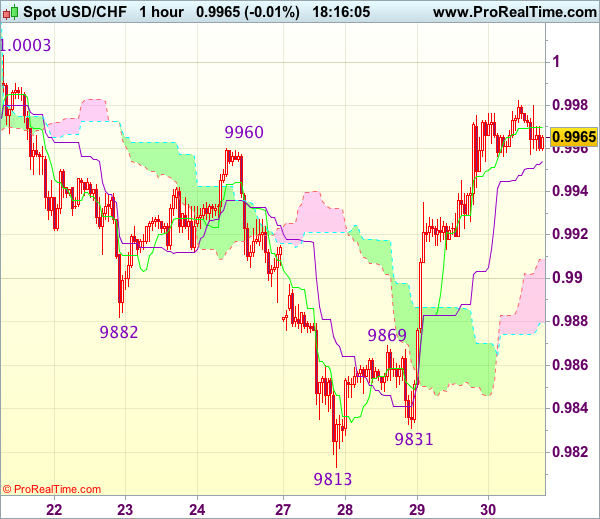
Trade Idea Update: USD/CHF – Buy at 0.9910
USD/CHF - 0.9956
Original strategy :
Buy at 0.9920, Target: 1.0020, Stop: 0.9885
Position : -
Target : -
Stop : -
New strategy :
Buy at 0.9910, Target: 1.0010, Stop: 0.9875
Position : -
Target : -
Stop : -
The greenback has continued trading with a firm undertone after this week’s rally from 0.9813, adding credence to our view that recent decline has ended at 0.9813, hence upside bias remains for this rise from 0.9813 to bring retracement of recent decline and further gain to resistance at 1.0003 would be seen but break there is needed to provide confirmation and retain bullishness for further rise to 1.0030 but previous support at 1.0060 should remain intact.
In view of this, would not chase this rise here and would be prudent to buy dollar on pullback as 0.9920-25 should limit downside. Below the upper Kumo (now at 0.9909) would suggest top is formed instead, bring weakness to the lower Kumo (now at 0.9879) but break of said support at 0.9831 is needed to revive bearishness for retest of 0.9813 first.
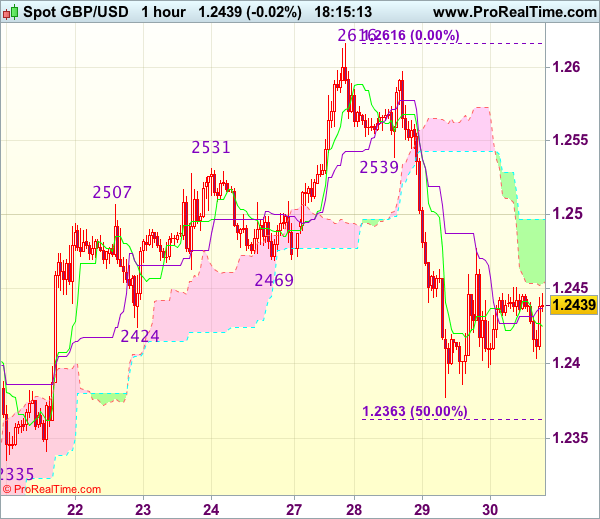
Trade Idea Update: GBP/USD – Sell at 1.2500
GBP/USD - 1.2439
Original strategy :
Sell at 1.2500, Target: 1.2365, Stop: 1.2535
Position : -
Target : -
Stop : -
New strategy :
Sell at 1.2500, Target: 1.2365, Stop: 1.2535
Position : -
Target : -
Stop : -
Cable’s recovery after falling to 1.2377 yesterday suggests consolidation above this level would be seen and another bounce to 1.2475-80 is likely, however, still reckon upside would be limited to 1.2500-10 and bring another decline later, below said support at 1.2377 would extend the fall from 1.2616 top to 1.2360-65 (50% Fibonacci retracement of 1.2109-1.2616), however, loss of near term downward momentum should prevent sharp fall below 1.2335 support and reckon 1.2300-05 (61.8% Fibonacci retracement) would hold from here, bring rebound later.
In view of this, we are looking to sell cable on subsequent recovery as 1.2500 should limit upside and bring another decline. Above 1.2500-10 would defer but only break of previous support at 1.2539 would abort and signal the fall from 1.2616 has ended instead, bring rebound to 1.2560-65 first.
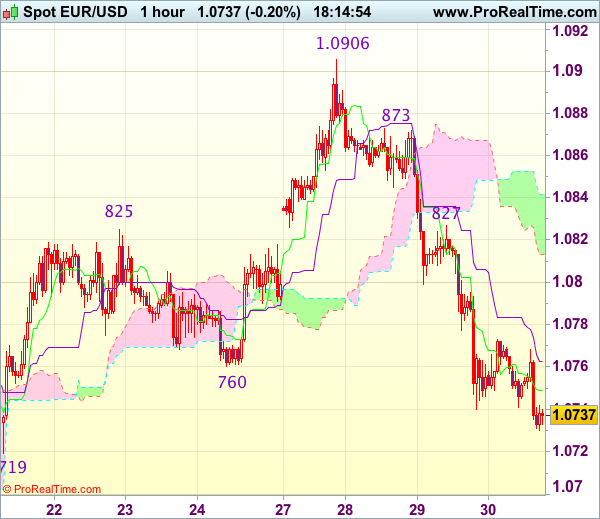
Trade Idea Update: EUR/USD – Sell at 1.0820
EUR/USD - 1.0742
Original strategy :
Sell at 1.0820, Target: 1.0720, Stop: 1.0855
Position : -
Target : -
Stop : -
New strategy :
Sell at 1.0820, Target: 1.0720, Stop: 1.0855
Position : -
Target : -
Stop : -
As the single currency has remained under pressure after this week’s selloff from 1.0906 top, suggesting bearishness remains for further decline towards previous support at 1.0719, however, break there is needed to retain downside bias and signal recent rise has ended at 1.0960, then further weakness to 1.0695-00 and possibly 1.0670 would be seen but oversold condition would limit downside and reckon 1.0650 would hold from here, risk from there is seen for a rebound to take place later.
In view of this, would not chase this fall here and would be prudent to sell dollar on recovery as 1.0827 resistance should limit upside and bring another decline. Above 1.0845-50 would abort and signal the fall from 1.0906 has ended instead, bring test of 1.0873 resistance first.
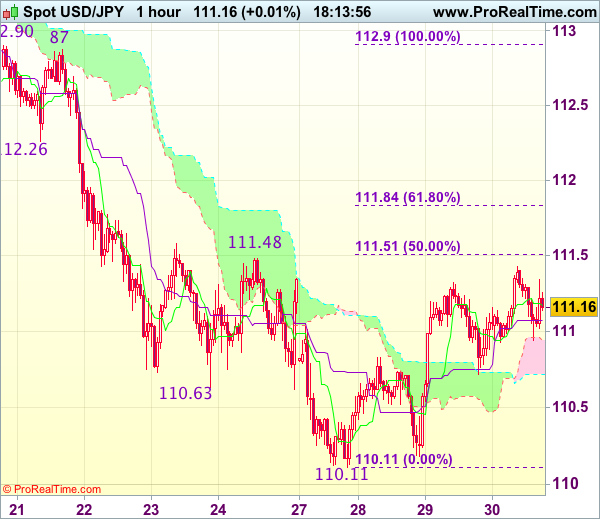
Trade Idea Update: USD/JPY – Stand aside
USD/JPY - 111.16
New strategy :
Stand aside
Position : -
Target : -
Stop : -
Although the greenback has retreated after intra-day initial brief rise to 111.43, below 110.72 (previous support as well as current level of the lower Kumo) is needed to suggest an intra-day top is formed, bring further fall to 110.45-50, then towards this week’s low at 110.11, otherwise, further choppy trading is in store. Below 110.11 would revive bearishness and extend recent decline to 109.95-00, then towards 109.70-75.
On the upside, above 111.48-51 (previous resistance and 50% Fibonacci retracement of 112.90-110.11) would signal low has been formed at 110.11, bring retracement of recent decline to 111.80-85 (61.8% Fibonacci retracement) but price should falter below previous support at 112.26, bring retreat later. As near term outlook is mixed, would be prudent to stand aside for now.
Consol Energy Resuming The Rally
Consol Energy (NYSE:CNX) is the largest producer of bituminous coal in the United States and the largest exporter of U.S. coal, It managed to survive through the major disruption in the financial markets because of its diversification strategy around natural gas and other services. Despite being one of the oldest company in the industry, originally created in 1860 as the Consolidation Coal Company , Consol Energy only went public in 1999 in order to pay down some of its debt and in 2010 it was named by Forbes magazine as one of the “100 Most Trustworthy Companies.”
In January last year, CNX price dropped to new all time lows before finding a bottom on 01/20/2016 then doing an amazing rally during the rest of the year to close for a total gain of +300% following the rise of Coal prices and outperforming the rest of commodities stocks. So let’s jump to the technical chart to analyse the current situation and see the potential path for company.
Consol Energy Elliott Wave Analysis
CNX has a bullish sequence from January 2016 low as it rallied in 5 waves forming a leading diagonal in wave A which ended on 12/08/2016. From there it started doing wave B pullback to correct that cycle in a double three Elliott wave structure which missed equal legs area $14.41 by few points.
The cycle from the peak is mature and have enough number of swings in place to call it completed , so with a break above the descending trend-line we can have a confirmation that wave B is already in place and the stock has resumed the move to the upside or there will be at least a 3 waves bounce
Zooming out to the weekly chart, Consol Energy is proposed to have ended a super cycle at $4.54 low and currently doing a larger 3 waves bounce which would ideally turn out to be the first leg of a new bullish cycle. The stock needs to break above December 2106 peak to resume the rally and open the extension higher toward equal legs $32.61 which will represent the first target area from the low.
If CNX fails to break above $22.34 peak then it could be still correcting 2016 cycle and it will be looking to reach the 50%-61.8% Fibonacci retracement area at $13.44-$11.34 before the stock can resume the move higher as long as it keeps holding above $4.54 low.
Recap :
Consol Energy is one of the United States’s largest coal and natural gas companies that despite the falling of its stock price since the 2008 financial crises managed to pull it through. The company stock CNX have a technical bullish Elliott wave sequence calling for more upside if it manage to break above 2016 peak that’s why it would be a good idea to add it to the watch list for potential buying opportunities if not already long.
SILVER Trading In A Temporary Fourth Wave, More Upside In View
Silver is retesting 18.22 highs but bullish price structure is not looking strong enough to convince me that this is already a fifth wave up. In fact, there was a very sharp and fast pullback down in wave 2 Back in March 16th so we can expect wave 4 to be more complex, it's called rule of "alternation". That said, we are observing a flat for wave 4 where price in subwave c can still come down to 17.90-18.00 area and then bounce higher.
SILVER, 1H
EUR/GBP Elliott Wave Analysis
EUR/GBP – 0.8661
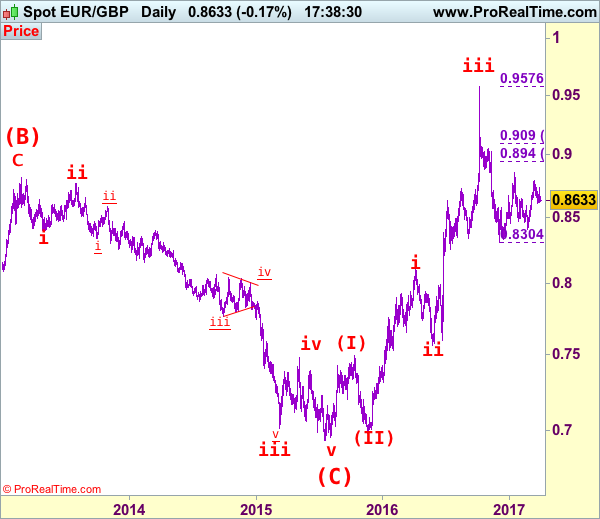
EUR/GBP – The major (A)(B)(C)-(X)-(A)(B)(C) correction from 0.9805 is unfolding and 2nd (A) has possibly ended at 0.6936.
Although the single currency rebounded again, as euro met resistance at 0.8735 and has retreated again, retaining our view that further consolidation below indicated resistance at 0.8788 would be seen and pullback to 0.8595-00 cannot be ruled out, however, reckon downside would be limited to 0.8550 and renewed buying interest should emerge around there, bring another rise later. Above said resistance at 0.8735 would bring test of 0.8788 but break there is needed to extend the rebound from 0.8403 towards indicated resistance at 0.8857 which is likely to hold from here.
Our latest preferred count is that the wave V of a 5-wave series from 0.5682 ended at 0.9805 earlier and major from there has possibly ended at 0.8067 as A-B-C-X-A-B-C. We are keeping our view that the entire correction from 0.9805 has possibly ended at 0.7756 and as labeled as the attached daily chart and impulsive move from 0.9084 has ended at 0.7756 as a 5-waver which marked either the (C) wave or the A leg of (C), a daily close above resistance at 0.8831 would suggest (C) leg has ended and headway towards 0.9084.
On the downside, whilst pullback to 0.8595-00 cannot be ruled out, reckon downside would be limited to 0.8545-50 and bring another rise later. Below 0.8500-10 would defer and suggest top is formed instead, and risk weakness to 0.8460-65 but break there is needed to provide confirmation and suggest the rebound from 0.8403 has ended.
Recommendation: Buy at 0.8550 for 0.8750 with stop below 0.8450.
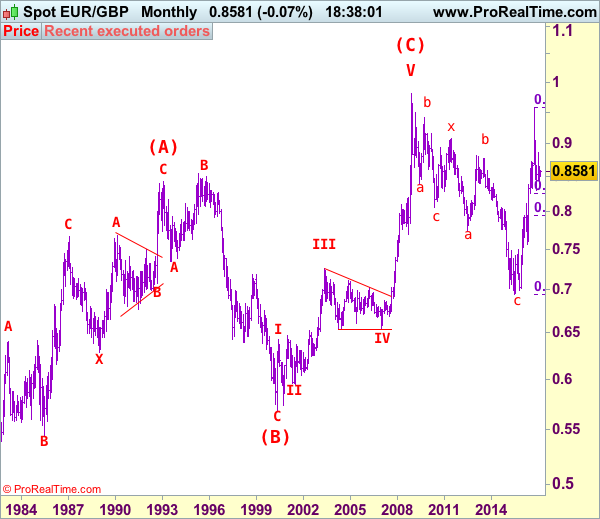
Euro's long term uptrend started in Feb 1981 at 0.5039 and is unfolding as a (A)-(B)-(C) move with (A): 0.8433 (Feb 1993), (B): 0.5682 (May 2000) and impulsive wave (C) should have ended at 0.9805 with wave III ended at 0.7254 (May 2003), triangle wave IV at 0.6536 (23 Jan 2007) and wave V as well as wave (C) has ended at 0.9805.
We are keeping an alternate count that only wave III ended at 0.9805 and the correction from there is the wave IV and may extend weakness to 0.7700, however, it is necessary to see a daily close above resistance at 0.9143 would change this to be the preferred count.
EUR/USD – Euro Slide Continues, German CPI Next
EUR/USD remains under pressure and has edged lower in the Thursday session. Currently, the pair is trading at 1.0740. On the release front, key releases out of the eurozone and the US could shake up the euro on Thursday. Germany will release Preliminary CPI, which is expected to soften to 0.4%. The US will publish Final GDP and unemployment claims. Final GDP is expected to edge up to 2.0%, compared to Preliminary GDP which came in at 1.9%. On the labor front, unemployment claims is expected to improve to 244 thousand, after an unexpectedly high figure of 261 thousand last week. On Friday, Germany releases retail sales and unemployment claims. The eurozone will publish CPI Flash Estimate while the US releases UoM Consumer Sentiment.
It's been a busy week for the euro. The currency jumped above the 1.09 level on Monday, its highest level since November 2016. However, it's been all downhill since then, as the euro struggles to stay above the 1.07 line. EUR/USD posted strong gains following President Trump's failure to pass health legislation to replace parts of Obamacare. However, investors have moved on and are focusing on Trump's next move, which apparently will be legislation to reform the tax code. Germany will release key consumer inflation and spending data on Thursday and Friday, and unexpected readings could affect the direction of the euro. The economy, the largest in Europe, has has enjoyed a robust first quarter in 2017. Stronger global trade has led to increased demand for German exports, notably cars and machinery. Germany's GDP expanded 1.6% in 2016, its highest rate since 2012. The generally positive picture in Germany has boosted the eurozone economy and if the strong numbers continue, the ECB will be under more pressure to tighten monetary policy.
It's been a series of growing pains for the Trump administration, which has stumbled out of the starting gate. Trump, who has been in office for more than two months, has yet to provide any details of an economic policy. Last week, Trump's proposed bill was dead on arrival before even being voted on, a humiliating defeat for the president. This setback has made the markets even more jittery about Trump, and the inquiry into the Trump administration's links with Russia is gathering steam, which is another cause for concern for nervous investors. Trump has said he will now focus on tax reform, but the White House will need to improve coordination with Republican lawmakers to ensure that his next attempt to pass legislation is not a repeat of the healthcare debacle.
Gold Small Consolidation, Silver Consolidating Above $18, Crude Oil Renewed Bullish Pressures.
Gold Small consolidation.
Gold is getting stronger. The momentum seems back to bullish despite some consolidation. Strong resistance is located at 1263 (27/02/2017 high). Hourly support can be found at 1224.10 (16/03/2017 low). Expected to show further strengthening.
In the long-term, the technical structure suggests that there is a growing upside momentum. A break of 1392 (17/03/2014) is necessary ton confirm it, A major support can be found at 1045 (05/02/2010 low)
Silver Consolidating above $18.
Silver has increased above 18.00. Resistance given at 17.56 has been broken. Hourly support is given at 16.82 (15/03/2017 low).
In the long-term, the death cross indicates that further downsides are very likely. Resistance is located at 25.11 (28/08/2013 high). Strong support can be found at 11.75 (20/04/2009).
Crude oil Renewed bullish pressures.
Crude oil's bearish pressures seems to fade. The commodity had been located in a bearish trend since the commodity had been unable to mount a serious challenge to resistance at 55.24 (03/01/2017 high). Hourly support is given at 47.09 (016/03/2017 low).
In the long-term, crude oil has recovered after its sharp decline last year. However, we consider that further weakness are very likely. Strong support lies at 24.82 (13/11/2002) while resistance can now be found at 55.24 (03/01/2017 high).
EUR/CHF Trading Sideways, EUR/JPY Weakening, EUR/GBP Lack Of Follow-Through.
EUR/CHF Trading sideways.
EUR/CHF's is moving up and down. The medium-term pattern suggests us to see continued bearish pressures towards key support that can be found at 1.0623 (24/06/2016 low).
In the longer term, the technical structure is mixed. Resistance can be found at 1.1200 (04/02/2015 high). Yet,the ECB's QE programme is likely to cause persistent selling pressures on the euro, which should weigh on EUR/CHF. Supports can be found at 1.0184 (28/01/2015 low) and 1.0082 (27/01/2015 low).
EUR/JPY Weakening.
EUR/JPY rejection at 122.88 has triggered a correction. The pair is also very volatile. Hourly support at 119.33 (23/03/2017 low) has been broken. Resistance stands at 122.88 (13/03/0217 high). Expected to show continued weakness.
In the longer term, the technical structure validates a medium-term succession of lower highs and lower lows. As a result, the resistance at 149.78 (08/12/2014 high) has likely marked the end of the rise that started in July 2012. Strong support at 94.12 (24/07/2012 low) looks nonetheless far away.
EUR/GBP Lack of follow-through.
EUR/GBP's bullish flag finally ended up as a false flag. Strong resistance is given at 0.8787 (13/03/2017 high). Key resistance is given at 0.8854 (15/01/2017 high). Hourly support can be found at 0.8605 (23/03/2017 low. Expected to show continued weakness.
In the long-term, the pair has largely recovered from recent lows in 2015. The technical structure suggests a growing upside momentum. The pair is trading above from its 200 DMA. Strong resistance can be found at 0.9500 psychological level.