Sample Category Title
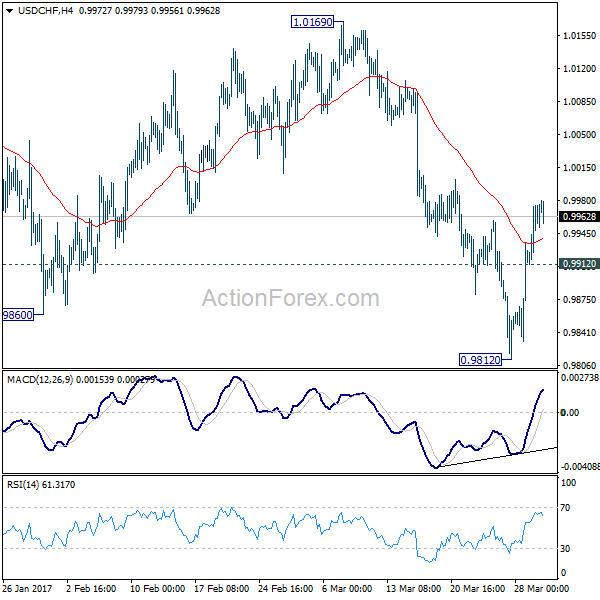
USD/CHF Daily Outlook
Daily Pivots: (S1) 0.9924; (P) 0.9950; (R1) 0.9988; More.....
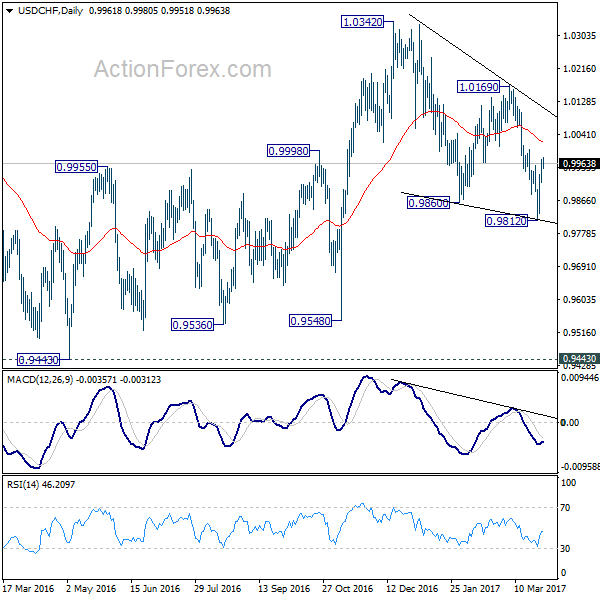
Intraday bias in USD/CHF remains on the upside for the moment. A short term bottom is in place at 0.9812 on bullish convergence condition in 4 hour MACD. Further rise should be seen to 55 day EMA (now at 1.0021). Sustained trading above there will argue that whole decline from 1.0342 has completed. Further rise should then be seen to 1.0169 resistance for confirmation. On the downside, below 0.9912 minor support will turn bias back to the downside for 0.9812 instead.
In the bigger picture, USD/CHF is staying in medium term sideway pattern between 0.9443/1.0342. In any case, decisive break of 1.0342 resistance is needed to confirm underlying strength. Otherwise, we'll stay neutral in the pair first. In case of deeper fall, we'd expect strong support from 0.9443/9548 support zone.
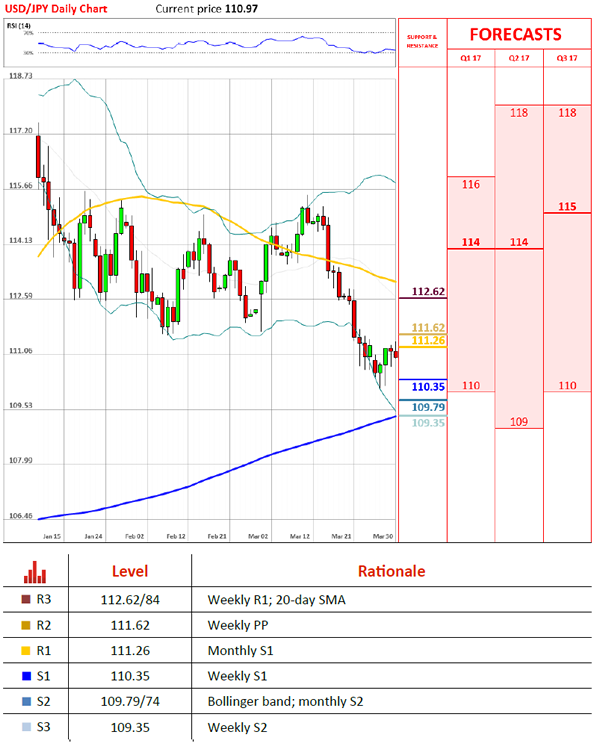
USD/JPY In Tight Range Between 110.60 And 111.26
'It is too early to expect a sustained recovery even though on the converse, the odds for a break below 110.00 have diminished considerably.' – UOB (based on FXStreet)
Pair's Outlook
Even though the Greenback weakened against the Yen on Wednesday, no significant losses were registered, with the pair remaining above 111.00. The nearest resistance is still the monthly S1 at 111.26, which is expected to prevent the USD/JPY pair from climbing higher today. Being that there is barely any room for a rally, the bearish development is the most probable outcome. Furthermore, technical indicators also suggest the US Dollar is to edge lower today. Although the nearest support rests at 110.35, namely the weekly S1, the 110.60 level appears to be providing strong psychological support, forming the lower boundary of the pair's consolidation range.
Traders' Sentiment
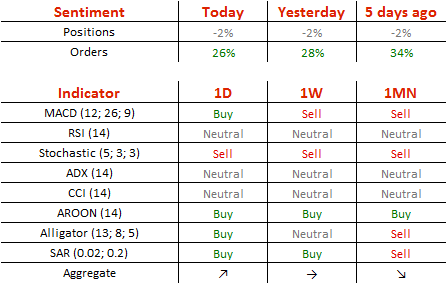
Market sentiment remains bullish at 72%, but all pending orders are now equally divided between the buy and the sell ones.
Gold Remains Near 1,250 Mark
'The market seemed to take the notification of the article 50 in the UK relatively smoothly, but I suspect the worst is yet to come on that.' – Daniel Hynes, ANZ (based on Reuters)
Pair's Outlook
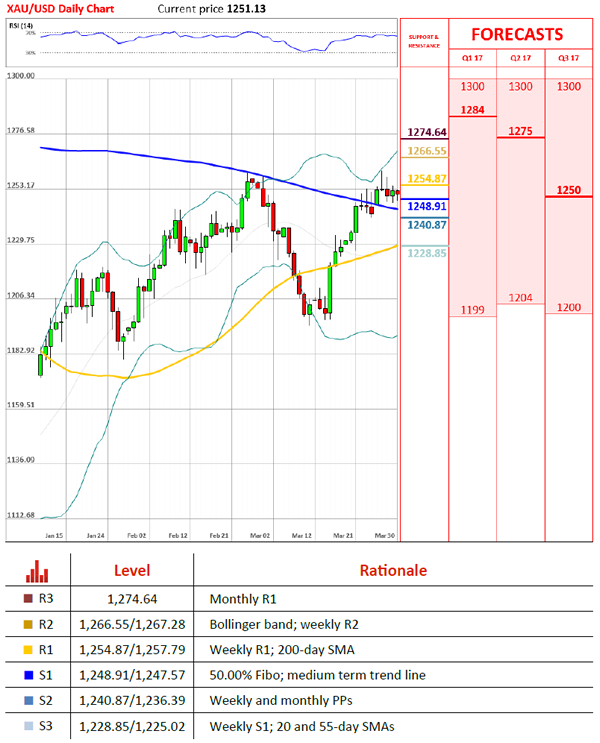
The yellow metal continued to trade between two clusters of significance on Thursday morning, as it had done for the past two trading sessions. From the upside the bullion faces the first weekly resistance at 1,254.87, which is combined with the 200-day SMA at 1,257.79. From the downside the currency exchange rate is finding support in the 50.00% Fibonacci retracement level at the 1,248.96 mark and the already broken down-trend line, which remains significant at 1,246.78. It is highly likely that the bullion will continue the surge in the near future.
Traders' Sentiment
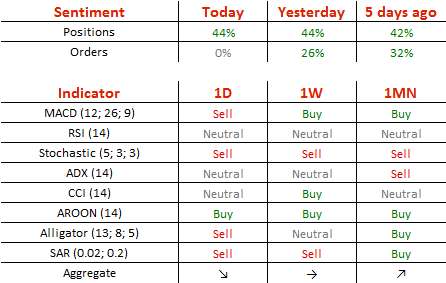
Traders remain neutral bearish, as 51% of open positions are short on Thursday. Meanwhile, 63% of trader set up orders are to buy the metal.
GBPUSD Without Clear Direction On The First Day Of Brexit
Cable is holding above strong supports at 1.2420/14 (Fibo 38.2% of 1.2107/1.2613 / 100SMA) in early Thursday's trading, following choppy action on Wednesday.
Uncertainty at the beginning of Brexit process kept traders nervous, with the pair trading within 100-pips range on Wednesday (1.2474/1.2374), but long-legged daily candle signaled strong indecision and no clear direction.
Return above 1.2420/13 pivots slightly eased downside pressure, but risk of fresh weakness exists, as the pair broke into daily cloud (spanned between 1.2356 and 1.2473).
Mixed daily technical studies require break of pivotal points on either side to for clearer direction signal.
At the upside, daily cloud top at 1.2473, reinforced by Tenkan-sen line, marks the first upper trigger, with extension above 1.2500 (top of hourly Ichimoku cloud that caps near-term action) needed to signal stronger upside attempts.
On the downside, loss of 1.2420/13 pivots would risk fresh weakness towards lower triggers at 1.2360/56 (daily Kijun-sen / cloud base) and signal bearish continuation on firm break lower.
Res: 1.2466, 1.2473, 1.2500, 1.2522
Sup: 1.2414, 1.2395, 1.2356, 1.2338
EURUSD Risks Extended Correction Towards 1.0700
The Euro remains biased lower after past two days in red and sees scope for extension of pullback from 1.0905 towards next strong support at 1.0700 (daily Kijun-sen / 50% retracement of 1.0493/1.0905 upleg).
Near-term action is holding in narrow consolidation above hourly base at 1.0738 (lows of 29 Mar / today), with risk shifted lower on weak near-term studies.
Extension of bear-leg from 1.0905 requires sustained break below 1.0748 (Fibo 38.2% of 1.0493/1.0905, as previous two attempts failed to close below this pivot).
However, daily studies remain bullish overall and see fresh upside attempts on completion of current corrective phase.
Extended dips on breach of 1.0748 pivot, should be ideally contained above 1.0700, to keep scenario in play.
Otherwise, increased downside risk could be anticipated on loss of 1.0700 support.
Res: 1.0768, 1.0784, 1.0825, 1.0841
Sup: 1.0748, 1.0738, 1.0700, 1.0673
Forex Technical Analysis
EUR/USD
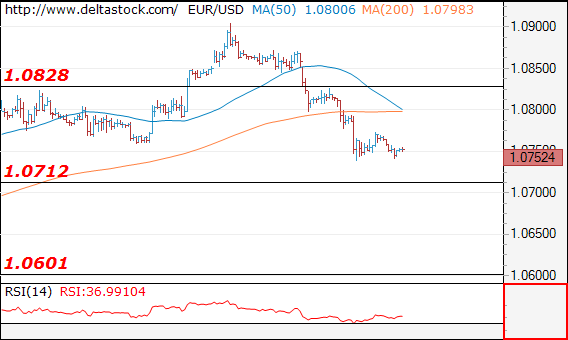
Current level - 10752
The outlook remains bearish, for a slide towards 1.0710, en route to 1.0600 static support. Initial resistance lies at 1.0780, followed by 1.0828.
| Resistance | Support | ||
| intraday | intraweek | intraday | intraweek |
| 1.0780 | 1.0904 | 1.0710 | 1.0710 |
| 1.0828 | 1.1010 | 1.0600 | 1.0600 |
USD/JPY
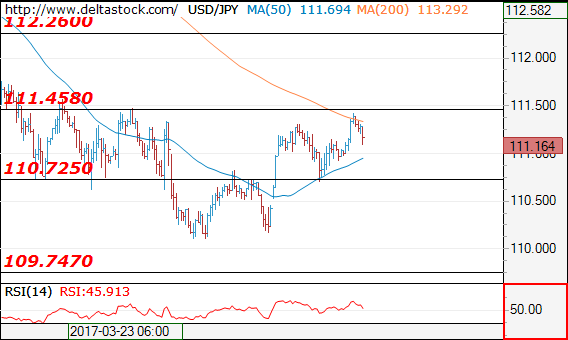
Current level - 111.16
Yesterday's precise test of 110.70 support area has failed and the outlook is bullish, for a break through 111.45, towards 112.26 zone.
| Resistance | Support | ||
| intraday | intraweek | intraday | intraweek |
| 111.45 | 113.50 | 110.70 | 109.75 |
| 112.26 | 115.65 | 110.10 | 107.80 |
GBP/USD
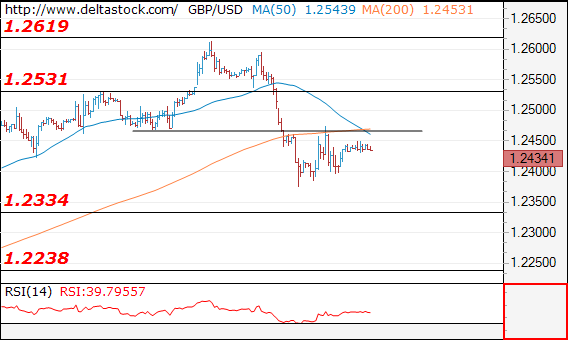
Current level - 1.2434
The bias is still negative below 1.2470, for a slide towards 1.2330, en route to 1.2240. Crucial on the upside is 1.2530.
| Resistance | Support | ||
| intraday | intraweek | intraday | intraweek |
| 1.2470 | 1.2619 | 1.2335 | 1.2107 |
| 1.2619 | 1.2705 | 1.2230 | 1.1984 |
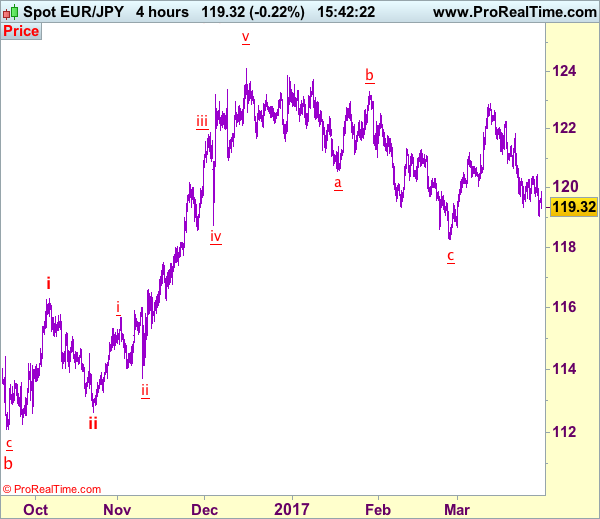
Trade Idea: EUR/JPY – Sell at 120.40
EUR/JPY - 119.30
Recent wave: wave v of (C) ended at 94.12 and major correction in wave A has ended at 149.79
Trend: Near term up
New strategy :
Sell at 120.40, Target: 118.40, Stop: 121.00
Position: -
Target: -
Stop:-
As the single currency finally resumed recent decline from 122.89 and bearishness remains for further weakness to 118.80 and later test of support at 118.67, however, break there is needed to retain bearishness and extend further decline to previous chart support at 118.25, risk from there is seen for a rebound later.
In view of this, would not chase this fall here and would be prudent to sell euro on subsequent rebound as resistance at 120.44 should cap upside and bring another decline. Above 1121.00 would abort and suggest low is possibly formed, risk rebound to 121.50 but resistance at 121.84 should hold from here, bring another decline later.
Our latest preferred count is that wave (ii) is ABC-X-ABC which ended at 123.33 and wave (iii) is unfolding with wave iii ended at 100.77, followed by wave iv at 111.57 and wave v as well as the wave (iii) has ended at 97.04, followed by wave (iv) at 111.43 and wave (v) has ended at 94.12 which is also the end of the larger degree v, this also implied the major wave (C) has also ended there, hence major correction has commenced from there with (A) leg unfolding in its lower degree wave c which has possibly ended at 145.69. Under this count, A-B-C wave (B) has commenced with A leg ended at 136.23, wave B at 143.79 and wave C has possibly ended at 149.79.
Our larger degree count is that the decline from 139.26 is wave (C) and is sub-divided into a diagonal triangle i-ii-iii-iv-v with wave i - 105.44, wave ii- 123.33, wave iii - 97.03, wave iv - 111.43, followed by the final wave v as well as the end of wave (C) at 94.12, this also mark the bottom of larger degree wave B. Under this count, major rise in wave C has commenced as an impulsive wave with minor wave III ended at 145.69, wave V is still in progress for further gain to 150.00. Having said that, this so-called wave V could well be the first leg of larger degree 5-waver wave C and this wave C should bring at least a retest of wave A top at 169.97 (July 2008).
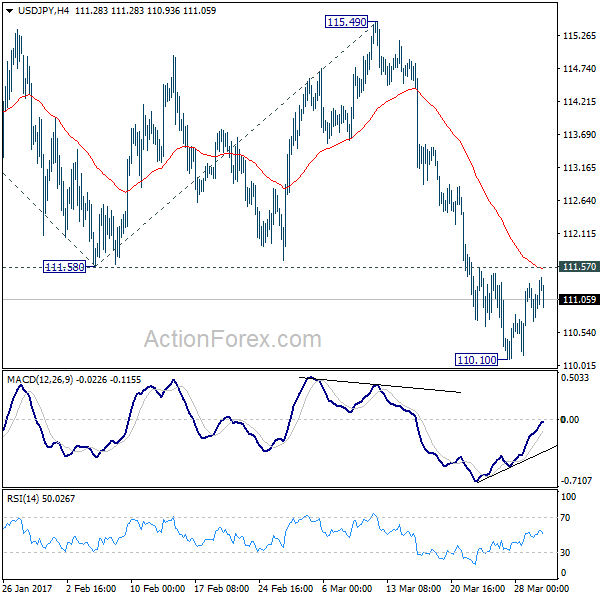
USD/JPY Daily Outlook
Daily Pivots: (S1) 110.47; (P) 110.84; (R1) 111.49; More...
USD/JPY is staying in the consolidation from 110.10 temporary low and intraday bias remains neutral for the moment. With 111.57 minor resistance intact, further fall is still in favor. On the downside, break of 110.10 will extend the current fall from 118.65 to 100% projection of 118.65 to 111.58 from 115.49 at 108.42 and possibly below. Meanwhile, firm break of 111.57 will indicate short term bottoming and bring rebound back to 55 day EMA (now at 112.88).
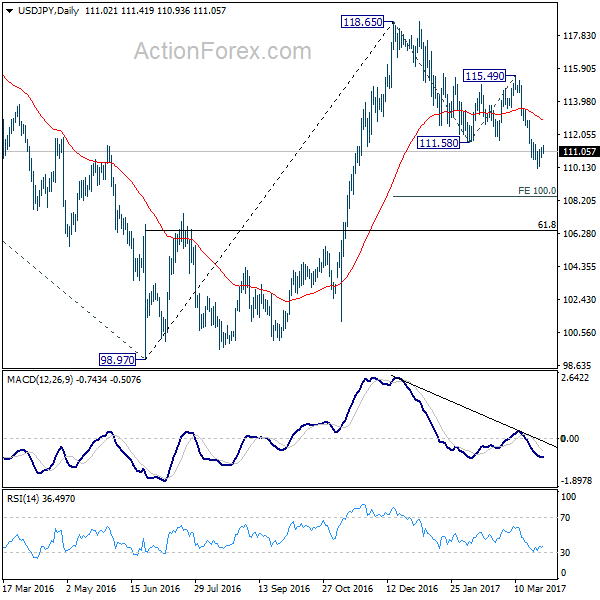
In the bigger picture, price actions from 125.85 high are seen as a corrective pattern. sustained trading below 55 week EMA (now at 111.11) will indicates that such consolidation is not completed. And another fall would be seen back to 98.97 as the third leg. In that case, downside would be contained by 61.8% retracement of 75.56 to 125.95 at 94.77 to complete the correction. On the upside, above 115.49 will extend the rise from 98.97 to retest 125.85 first. Overall, up trend from 75.56 is expected to resume after the consolidation from 125.85 completes.
Dollar Recovery Attempt Fails, European Majors Weak
Dollar attempted for recovery overnight but momentum has been very weak. Boston Fed President Eric Rosengren's hawkish comments provided brief lift to the greenback. But weakness in stocks and yield limited Dollar's gain. European majors are trading broadly lower for the week. Sterling was sold off as UK finally submitted formal request for Brexit yesterday. Euro was weighed down as traders pared expectations of stimulus exit from ECB any time soon. Commodity currencies are trading higher for the week but is bounded in established range. In other markets, DJIA closed down -0.2% at 20659.32 after failing to take out 20757.89 near term resistance. 10 year yield's recovery failed below 55 day EMA and closed at 2.386, down -0.023. Gold engages in sideway consolidation around 1250. WTI crude oil rebounded strongly and is heading back towards 50 handle.
Boston Fed Rosengren supports total four hikes this year
Boston Fed President Eric Rosengren said that Fed should be prepared to hike a total of four times this year. He noted that "the perception seems to be that the outcome of each FOMC meeting depends on nuances of incoming data, with the base case being no change in rates." However, his view is that "an increase at every other FOMC meeting over the course of this year could and should be the committee's default." He emphasized that "it is important to avoid creating an over-hot economy that could require a more rapid tightening of monetary policy - which would place at risk the economic improvements seen to date,"
San Francisco Fed Williams: Don't rule out more than three hikes
San Francisco Fed President John Williams said that policy makers should not "rule out more than three increases total for this year." He said that Fed is now very close to reaching the Fed's dual mandate goals of maximum employment and price stability." And, " if you do the math, we are about as close to these goals as we've ever been." Meanwhile, he said that supply-side issues is beyond Fed's reach. And, "the public and private decision-makers who work in these realms have it within their toolkits to spark growth and innovation, if they so choose to invest in priorities like education, training, safer and healthy neighborhoods, and infrastructure,"
Chicago Fed Evans support only one or two hikes
On the other hand, Chicago Fed President Charles Evans reiterated his mild approach to rate hike. He noted that "my current dual mandate outlook allows me to support another one or two increases this year." Nonetheless, he did acknowledged that "for the first time in quite a while, I see more notable upside risks to growth." And regarding US President Donald Trump's fiscal policies, despite recent uncertainties, Evans said that "the general thinking is that such policies could boost growth for a time."
Doubts on UK to complete Brexit deal in two years
In UK, Prime Minister Theresa May formally initiated the Brexit process yesterday. She told Parliament that "there were predictions about what would happen to the economy if the United Kingdom voted leave...... those predictions have not proved to be correct." She emphasized that "we see a strong economy" after the Brexit referendum. UK has now entered into negotiation with EU with issues like immigration, trade relationship and Brexit cost at the top of the agenda. Such negotiation would last for two years and a deal would be make before end of March, 2019. However, there are doubts that a two year time frame is unfeasible for making an agreement as there will be unforeseen complications and legal problems.
Survey shows Scot FM Sturgeon out of touch
In Scotland, the parliament voted 69-59 vote earlier this week to demand another independence referendum. However, it's reported that some criticized First Minister Nicola Sturgeon as out of touch with Scotland. A survey by NatCen research showed that 62% of Scots think that trade and immigration rules should stay the same as in the rest of UK. And 64% believed that immigration from Europe should be subject to the same conditions as those from other parts of the world. That is, they don't necessary support breaking up with UK after Brexit to join EU with the condition on freedom of movement of people.
BoJ Iwata: No need to buy US treasuries
In Japan, BoJ Deputy Governor Kikuo Iwata said that there is no need to buy US treasuries as sufficient monetary easing could be done by JGB purchases. He told parliament that "we can achieve our 2 percent inflation target and seek an eventual exit from our quantitative easing program without buying U.S. Treasury debt." And he warned that "buying U.S. Treasury debt unnecessarily would be interpreted as currency intervention."
On the data front...
Swiss KOF leading indicator rose to 107.6 in March, above expectation of 105.8. Eurozone will release business climate and confidence indicators. Germany will release March CPI preliminary. US will release Q4 GDP finalized. Meanwhile, Canada will release IPPI and RMPI.
USD/JPY Daily Outlook
Daily Pivots: (S1) 110.47; (P) 110.84; (R1) 111.49; More...
USD/JPY is staying in the consolidation from 110.10 temporary low and intraday bias remains neutral for the moment. With 111.57 minor resistance intact, further fall is still in favor. On the downside, break of 110.10 will extend the current fall from 118.65 to 100% projection of 118.65 to 111.58 from 115.49 at 108.42 and possibly below. Meanwhile, firm break of 111.57 will indicate short term bottoming and bring rebound back to 55 day EMA (now at 112.88).
In the bigger picture, price actions from 125.85 high are seen as a corrective pattern. sustained trading below 55 week EMA (now at 111.11) will indicates that such consolidation is not completed. And another fall would be seen back to 98.97 as the third leg. In that case, downside would be contained by 61.8% retracement of 75.56 to 125.95 at 94.77 to complete the correction. On the upside, above 115.49 will extend the rise from 98.97 to retest 125.85 first. Overall, up trend from 75.56 is expected to resume after the consolidation from 125.85 completes.
Economic Indicators Update
| GMT | Ccy | Events | Actual | Forecast | Previous | Revised |
|---|---|---|---|---|---|---|
| 7:00 | CHF | KOF Leading Indicator Mar | 107.6 | 105.8 | 107.2 | 106.9 |
| 9:00 | EUR | Eurozone Business Climate Indicator Mar | 0.87 | 0.82 | ||
| 9:00 | EUR | Eurozone Economic Confidence Mar | 108.3 | 108 | ||
| 9:00 | EUR | Eurozone Industrial Confidence Mar | 1.4 | 1.3 | ||
| 9:00 | EUR | Eurozone Services Confidence Mar | 14 | 13.8 | ||
| 9:00 | EUR | Eurozone Consumer Confidence Mar F | -5 | -5 | ||
| 12:00 | EUR | German CPI M/M Mar P | 0.40% | 0.60% | ||
| 12:00 | EUR | German CPI Y/Y Mar P | 1.80% | 2.20% | ||
| 12:30 | USD | GDP Annualized Q4 T | 2.00% | 1.90% | ||
| 12:30 | USD | GDP Price Index Q4 T | 2.00% | 2.00% | ||
| 12:30 | USD | Initial Jobless Claims Mar 25 | 245k | 261k | ||
| 12:30 | CAD | Industrial Product Price M/M Feb | 0.30% | 0.40% | ||
| 12:30 | CAD | Raw Materials Price Index M/M Feb | 0.80% | 1.70% | ||
| 14:30 | USD | Natural Gas Storage | -150B |
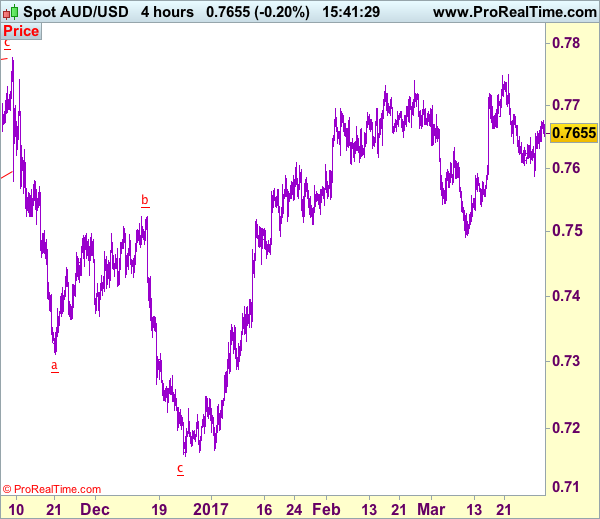
Trade Idea: AUD/USD – Hold long entered at 0.7645
AUD/USD – 0.7654
Recent wave: Wave 5 ended at 1.1081 and major correction has commenced for fall to 0.7000 and then towards 0.6500-10
Trend: Near term up
Original strategy :
Bought at 0.7645, Target: 0.7800, Stop: 0.7585
Position: - Long at 0.7645
Target: - 0.7800
Stop: - 0.7585
New strategy :
Hold long entered at 0.7645, Target: 0.7800, Stop: 0.7605
Position: - Long at 0.7645
Target: - 0.7800
Stop:- 0.7605
As aussie found support at 0.7587 and has rebounded, retaining our bullishness and consolidation with upside bias remains for gain to resistance at 0.7685, break there would signal low is formed there and suggest the retreat from 0.7750 (last week’s high) has ended, then retest of this level would follow, above this resistance would extend gain to 0.7778 (last year’s high), however, break there is needed to retain bullishness and extend headway to 0.7840-50 but price should falter below 0.7900.
In view of this, we are holding on to our long position entered at 0.7645. Only below 0.7585 would abort and signal top is formed instead, then further choppy trading would take place and risk is seen for pullback to 0.7530-40 but indicated support at 0.7491 should remain intact.
On the 4-hour chart, the move from 0.8066 is the wave 5 with i: 0.8860, ii: 0.8315, wave iii is an extended move ended at 1.0183, iv: 0.9706 and wave v has ended at 1.1081 (also the top of entire wave 5). The subsequent selloff is the major correction which is unfolding as ABC-X-ABC and 2nd A leg has ended at 0.8848, followed by a-b-c wave B which ended at 0.9758, hence, 2nd C wave is now in progress and indicated downside target at 0.7000 and 0.6950 had been met, so further fall to 0.6710-20 cannot be ruled out.