Sample Category Title
GBP/USD: Theresa May Triggers Article 50, Kick-Starts Historic Brexit Process
For the 24 hours to 23:00 GMT, the GBP fell 0.14% against the USD and closed at 1.2439, after the British Prime Minister, Theresa May triggered Article 50 and formally began Britain's divorce from the European Union. She declared that there was no turning back and ushered in an exit process that will pitch her country into an unknown territory.
On the economic front, UK's net consumer credit rose more-than-expected by GBP1.4 billion, compared to a revised advance of GBP1.6 billion in the previous month. On the other hand, the nation's mortgage approvals recorded a surprise drop to a level of 68.3K in February, from a revised reading of 69.1K in the previous month.
In the Asian session, at GMT0300, the pair is trading at 1.2436, with the GBP trading marginally lower against the US Dollar from yesterday's close.
The pair is expected to find support at 1.2388, and a fall through could take it to the next support level of 1.2340. The pair is expected to find its first resistance at 1.2479, and a rise through could take it to the next resistance level of 1.2522.
Going ahead, investors await the UK's GfK consumer confidence index for March, scheduled to release overnight.
The currency pair is trading between its 20 Hr and 50 Hr moving averages.

USD/JPY: A Slew Of Economic Releases Awaited In Japan
For the 24 hours to 23:00 GMT, the USD marginally weakened against the JPY and closed at 111.09.
In the Asian session, at GMT0300, the pair is trading at 111.3, with the USD trading 0.19% higher against the JPY from yesterday’s close.
The pair is expected to find support at 110.85, and a fall through could take it to the next support level of 110.41. The pair is expected to find its first resistance at 111.58, and a rise through could take it to the next resistance level of 111.87.
Moving ahead, market participants await the release of Japan’s national consumer price index, industrial production and unemployment rate data, all for the month of February and scheduled to release overnight.
The currency pair is trading above its 20 Hr and 50 Hr moving averages.

USD/CHF: KOF Institute Downgrades Swiss 2017 Economic Growth Projection
For the 24 hours to 23:00 GMT, the USD rose 0.41% against the CHF and closed at 0.9961.
In economic news, Switzerland’s KOF institute projected the nation to grow by 1.5% in 2017, down from its December 2016 forecast of 1.6%. For 2018, Swiss GDP is expected to rise by 1.9%, unchanged from its previous projection.
On the macroeconomic front, Swiss UBS consumption indicator rose to a level of 1.5 in February, from a reading of 1.4 in the previous month, mainly driven by growth in the domestic tourism industry. Moreover, the nation’s ZEW economic expectations index for the next six months advanced to a level of 29.6 in March, its highest reading since January 2014 and compared to a reading of 19.4 in the prior month.
In the Asian session, at GMT0300, the pair is trading at 0.9979, with the USD trading 0.18% higher against the CHF from yesterday’s close.
The pair is expected to find support at 0.9933, and a fall through could take it to the next support level of 0.9887. The pair is expected to find its first resistance at 1.0003, and a rise through could take it to the next resistance level of 1.0027.
Going ahead, investors look forward to Switzerland’s KOF leading indicator for March, scheduled to release in a few hours.
The currency pair is trading above its 20 Hr and 50 Hr moving averages.

USD/CAD: Loonie Trading Lower This Morning
For the 24 hours to 23:00 GMT, the USD declined 0.37% against the CAD to close at 1.3331.
In the Asian session, at GMT0300, the pair is trading at 1.3343, with the USD trading 0.09% higher against the CAD from yesterday’s close.
The pair is expected to find support at 1.3309, and a fall through could take it to the next support level of 1.3276. The pair is expected to find its first resistance at 1.3388, and a rise through could take it to the next resistance level of 1.3434.
Going ahead, investors look forward to Canada’s industrial product price and raw material price index data for February, scheduled to release later today.
The currency pair is trading below its 20 Hr and 50 Hr moving averages.

EUR/GBP To Remain Caught Within The Range Of 0.84-0.88
Market movers today
In the euro area, the first inflation figures for March will be released today with the Spanish and German HICP inflation figures. We look for a decline in inflation in both countries reflecting lower core, energy and food price inflation. The decline in the volatile energy price inflation should follow as there is less support from the base effect and as the oil price has declined during March. Lower food commodity prices should eventually also result in lower consumer food price inflation after being lifted temporarily by cold weather in the winter months. Finally, the lower core inflation reflects the early timing of Easter last year, causing low inflation in the volatile package holidays prices in March this year.
In the US, a number of Fed members including Kaplan (voter, dovish), Dudley (voter, dovish), Williams (non-voter, neutral) and Mester (non-voter, hawkish) are scheduled to speak. Recently, the speeches from Fed members have not provided much new information as the communication has been that the Fed is on track to deliver the expected three rate hikes this year. We expect a continuation of this stance. Hence, the speeches should not moves markets considerably today.
In Scandi markets, focus will be on Norwegian retail sales, which should point to moderate growth in private consumption in Q1. See more on page 2.
Selected market news
UK PM Theresa May finally triggered Article 50 yesterday. Following the triggering, the European Council President Donal Tusk issued a response letter arguing ‘the Union will act as one and preserve its interests' in the negotiations. All of this was in line with expectations and during the day, the sterling appreciated gradually after having weakened in the early trading hours ahead of the triggering of Article 50. EUR/GBP is trading at 0.86 at the time of writing and we see potential for further GBP weakness in the near team as the negotiations begin. Over the coming 6-12 months, we expect EUR/GBP to remain caught within the range of 0.84-0.88.
ECB sources said yesterday that the ECB has been over interpreted by market participants at the latest meeting in March. Six sources in and close to the Governing Council indicated that the ECB is keen to reassure investors that the easy monetary policy is far from ending. ‘We wanted to communicate reduced tail risk but the market took it as a step to the exit' one source said. The sources also said that banks that have been the biggest losers from negative policy rates have recently benefited from the steepening of the yield curve, so there is no urgency to give them a hand. These unconfirmed reports are in line with our view that the market pricing of rate hikes from the ECB is very premature. We expect the ECB to extend its QE purchases going into next year.
In the US, it seems that the Republicans in the House of Representatives will give the ‘repealing and replacing' of Obamacare another try next week. This means it will take longer before the President's focus can turn to the tax reform. However, if an agreement can be reach on this, the Republicans may also be able to reach a deal on changes to economic policy.
Asian Market Update: Shanghai Composite Slumps As PBoC Extends The Streak Of Zero Liquidity Injection
Shanghai Composite slumps as PBoC extends the streak of zero liquidity injection
US Session Highlights
(US) MBA MORTGAGE APPLICATIONS W/E MAR 24TH: -0.8% V -2.7% PRIOR
(US) Fed’s Evans (dove, voter): there has been good progress towards Fed goals; supports one or two more rate hikes this year
(US) FEB PENDING HOME SALES M/M: 5.5% V 2.5%E; Y/Y: -2.4% V +2.7% PRIOR
(US) DOE CRUDE: +0.9M V +1ME; GASOLINE: -3.7M V -2ME; DISTILLATE: -2.5M V -1ME
US markets on close: Dow -0.2%, S&P500 +0.1%, Nasdaq +0.4%
Best Sector in S&P500: Energy
Worst Sector in S&P500: Financials
Biggest gainers: VRTX +20.5%, CHK +7.8%, JWN +5.4%, HES +4.9%, URBN +4.5%
Biggest losers: FFIV -3.4%, MYL -3.3%, ARNC -3.1%, PAYX -2.5%, EVHC -2.4%
At the close: VIX 11.4 (-0.1 pts); Treasuries: 2-yr 1.28% (-2bps), 10-yr 2.39% (-2bps), 30-yr 2.99% (-2bps)
US movers afterhours
EXTR: To acquire Brocade's Data Center Networking business for $55M; +13% afterhours
COP: Cenovus agrees to acquire ConocoPhillips' 50% interest in the FCCL Partnership for $17.7B in cash and shares; +6% afterhours
PRGS: Reports Q1 $0.34 v $0.28e, R$91.0M v $88.3Me; Guides Q2 $0.35-0.37 v $0.38e, $89-92M v $92Me; +4.7% afterhours
CVE: Agrees to acquire COP interst in FCCL Partnership; announces $3.0B bought-deal offering of common shares; selling 187.5M shares at $16/shr through RBC and JPM (20% of shares outstanding); -8.0% afterhours
LULU: Reports Q4 $1.00 (adj) v $1.01e, R$790.0M v $785Me; Guides Q1 $0.25-0.27 v $0.39e, R$510-515M v $555Me; -17.5% afterhours
Politics
(CN) China Premier Li Keqiang expected to win another term as Premier - financial press
(US) Federal Judge in Hawaii indefinitely extends court order blocking Trump administration's revised travel ban - press
(US) House speaker Ryan: Does not want Pres Trump to work with Democrats on healthcare reform - CBS interview
(US) Interviews with GOP's Freedom Caucus members said to reveal division on potential tax reform measures - press
(US) City of Seattle files lawsuit against President Trump for his sanctuary cities order
(US) Two Republican House members: House GOP is considering another try on Obamacare repeal next week - press
Asia Key economic data:
(AU) AUSTRALIA FEB HIA NEW HOME SALES M/M: +0.2% V -2.2% PRIOR
(AU) AUSTRALIA DEC-FEB SKILLED VACANCIES Q/Q: 1.8% V 2.5% PRIOR
Asia Session Notable Observations, Speakers and Press
Asian equity markets are down modestly, tracking a lackluster session on Wall St where Energy sector rallied on a jump in oil prices while Financials lagged as US interest rates turned lower. Australia continued to outperform, helped by strength in iron ore boosting miners, with ASX200 index adding to near-2 year gains as it approaches the psychological multi-year high level of 6,000. Shanghai Composite was one of the worst performers, as investors ponder PBOC support after the central bank skipped its reverse repo operation injection for the 5th straight day. Separately, a researcher with CASS forecast China Q1 GDP at a solid 6.8% and H1 GDP slowing to just 6.7% - well above the 6.5% official 2017 target.
USD majors traded mostly in narrow ranges with an upside bias for the greenback. USD/JPY hit session highs of 111.40 after a press report citing US Transportation Sec Chao that Pres Trump will announce a $1T infrastructure package later this year that will run for 10 years and cover energy, water, and potentially broadband and veteran hospitals. AUD/USD brifly rose toward 0.7680 on stronger HIA New Home Sales growth, though the pair was confined to a 20-pip range. GBP/USD consolidated its Brexit-commencing overnight slide, holding above $1.24.
Australia's Bank of Queensland put out its H1 results that showed a slight decline in Net profit and Revenue, but shares rose over 1% on positive H2 outlook. Toshiba spiked up over 3% after reports of Westinghouse coming to terms with bankruptcy proceedings. Samsung Electronics has launched its Galaxay S8 smartphone featuring smaller battery and a high-end AI system, though share gains were contained by political risk in the country as court hearings on former Pres Park arrest warrant began this morning.
China
(CN) China CISA's Vice-Chair Li: China to cut additional 140Mt in steel capacity; sees 2017 steel demand -1.9% y/y
(CN) China Stats Bureau: Service sector employed 43.5% of China's workforce in 2016, up from 36% in 2012 - Chinese press
(CN) US Treasury said to prepare to review China's market-economy status; expected to keep large tariffs on Chinese goods - financial press
(CN) China Academy of Social Sciences (CASS) sees China Q1 GDP at 6.8%; H1 GDP at ~6.7% - Chinese press
(CN) Former Treasury Sec Lew: China is not intervening in FX to gain trade advantage, but doing the opposite, intervening at its own expense to protect its currency - press
Japan
(JP) Bank of Japan (BOJ) Deputy Gov Iwata: Japan's economic recovery gaining momentum reflecting improvements in overseas economies
(JP) Japan Chief Cabinet Sec Suga: Created a govt task force to minimize negative impact of Brexit; to be led by Hagiuda
(JP) BOJ's 2% inflation target is in jeopardy due to the recent JPY strength - Nikkei
Australia/New Zealand
(AU) Morgans equity strategist: We see higher global bond yields as a tipping point for equity markets toward 2017-end - SMH
(NZ) Westpac economist: See some upside risk to its FY16/17 milk price forecast of NZ$5.90/kg; See FY17/18 price at NZ$6.10/kg
Korea
(KR) South Korea Court to decide on former Pres Park's arrest warrant; Hearing taking place this morning
(KR) South Korea Fin Min Yoo: Will respond to economic risks with active policy - speaking at parliament
(KR) Bank of Korea (BOK) report to Parliament: Raises ratio of USD reserves to 70.3% in 2016 from 66.6% in 2015 (highest since started publishing data in 2008)
(KR) South Korea and US seeking to limit oil supply to North Korea - Korean press
Asian Equity Indices/Futures (00:00ET)
Nikkei -0.3%, Hang Seng -0.4%, Shanghai Composite -1.1%, ASX200 +0.3%, Kospi -0.3%
Equity Futures: S&P500 +0.1%; Nasdaq +0.1%; Dax +0.2%; FTSE100 flat
FX ranges/Commodities/Fixed Income (00:00ET)
EUR 1.0740-1.0770; JPY 111.00-111.40; AUD 0.7655-0.7675; NZD 0.7020-0.7045
Apr Gold -0.4% at $1,249/oz; May Crude Oil +0.1% at $49.57/brl; May Copper -0.3% at $2.67/lb
iShares Silver Trust ETF daily holdings fall to 10,292 tonnes from 10,337 tonnes prior; 2nd straight decline
(CN) PBoC skips open market operations for 5th straight session; Said to drain CNY40B v CNY70B prior
(CN) PBOC SETS YUAN MID POINT AT 6.8889 V 6.8915 PRIOR; firmer setting after 2 consecutive weaker fixes
(JP) Japan MoF sells ¥1.99T v ¥2.2T indicated in 2-yr 0.1% JGBs; Avg yield: -0.206% v -0.252% prior; bid to cover: 3.82x v 3.93x prior
(JP) Japan investors sold net ¥152B in foreign bonds v bought ¥151B in prior week; Foreign investors sold net ¥754B in Japan stocks v sold ¥585B in prior week
Asia equities/Notables/movers by sector
Consumer discretionary: 494.HK Li & Fung -9.1% (FY16 result); 525.HK Guangshen Railway Co -4.4% (FY16 result); DLX.AU Dulux Group -3.7% (UBS downgrades); NVT.AU Navitas +3.8% (trading update); TGA.AU Thorn Group -3.0% (potential class action)
Consumer staples: 1230.HK Yashili International Holdings +0.7%, 2319.HK Mengniu Dairy +1.5% (FY16 result), BOQ.AU Bank of Queensland +1.4% (H1 result)
Financials: 813.HK Shimao Property -1.6%
Industrials: 338.HK Weichai Power -1.1% (FY16 result)
Technology: 451.HK GCL New Energy -2.3% (FY16 result); 005930.KR Samsung Electronics +0.4% (Launches the Galaxy S8 smartphone); 6502.JP Toshiba +3.5% (Westinghouse files for bankruptcy)
Materials: 2009.HK BBMG Corp -4.4% (FY16 result); WAF.AU West African Resources +7.1% (drilling result); ILU.AU Iluka Resources +1.9%, FMG.AU Fortescue +0.8% (iron ore price rise)
Energy: BPT.AU Beach Energy +3.2%, WPL.AU Woodside Petroleum +1.5% (oil rises)
Healthcare: 4502.JP Takeda Pharmaceutical +3.0% (Dengue Vaccine Triggers Immune Responses in Phase 2 Trial)
Can Oil Build On Yesterday’s Gains?
- FTSE seen higher as oil extends gains while GBP remains soft
- Oil rally on smaller inventory build could be bullish signal
- USD rebounds after hawkish Fed remarks, more speeches to come today
European equity markets are expected to open a little higher on Thursday, a day after the UK formally notified its partners of 44 years of its intentions to leave the EU.
The market reaction to the event was relatively muted in the end, something that wasn’t guaranteed given the sensitivity to Brexit related news over the last nine months, particularly in the UK. The pound, which has at times been very vulnerable to Brexit, saw some weakness in the lead up to the announcement – some of which was likely due to the Scottish parliament voting for another referendum – but only ended the session slightly lower.
This helped to spur on the FTSE yesterday, along with the rally in oil which rallied almost 2% on the day and has started today on a positive note as well. A smaller than expected rise in crude inventories last week was enough to trigger yesterday’s move, despite only falling a little short of forecasts and Tuesday’s API number.
Brent crude prices fell quite sharply at the start of the month before consolidating around $50 a barrel, which proved itself to be a strong level of support. There were signs last week that it may take something significant to break this level when a near five million build in inventories triggered a strong sell-off into the $50 level before immediately reversing course and wiping out the losses. Given how little it’s taken to trigger a 2% swing higher, I wonder whether we’ve establish a temporary bottom in Brent. The next test comes around $52.65, with a break above this potentially triggering a move back towards $55.
The US dollar has experienced a slight rebound in recent days, aided by some more hawkish commentary from Federal Reserve officials. Yesterday John Williams and Eric Rosengren – neither of which are voters this year – alluded to the possibility of three more rate hikes this year while Charles Evans – who is a voter – was a touch more on the dovish side but still open to two further hikes and three if fundamentals improve. With two more officials due to speak today, it will be interesting to see whether we’re seeing another coordinated response from the Fed to lift rate expectations, with markets having recently pared them back a fair bit.
It’s looking a little light on the high impact data front again but there are still some notable releases scattered throughout the day. We’ll get some inflation data from Germany and Spain this morning, as well as some sentiment data from the eurozone. This will be followed later by final fourth quarter GDP data and jobless claims from the US.
Ranging Phase Could Be Taking Hold Of The Swissy
Key Points:
- Near to medium-term ranging phase now likely.
- Slip to the downside expected eventually.
- Fundamental and technical bias in agreement.
The USDCHF looks ready to enter a ranging phase moving ahead which could last a number of weeks before a large slip to the downside is subsequently seen. This sideways movement will come as a result of the interaction of some countervailing technical forces and an equally mixed fundamental bias. Consequently, it may be worth taking a closer look at the pair as the range trading opportunities and the eventual downtrend could be worth taking into account.
Firstly, it’s worth noting that the Swissy remains confined within a broader consolidation pattern, namely, a falling wedge. Indeed, the most recent rally was, in part, a reaction to the pair being forced into conflict with the lower constraint of this overarching structure. However, despite the current bullish momentum, it is unlikely that we see the USDCHF continue to extend gains much higher as another zone of resistance should kick in prior to the upside constraint of the wedge being challenged.
Specifically, as is shown above, the coincidence of the 61.8% Fibonacci level and the 100 day moving average should provide a medium-term cap on gains for the Swissy. As a result, while we may see some modest upsides over the coming sessions, a reversal is likely to occur at least once before the constraints of the wedge are tested again. However, any potential reversals are likely to be short lived as there is a decent degree of underlying bullish sentiment in place for the pair.
In particular, the impending inversion of the Parabolic SAR to bullish and the imminent MACD signal line crossover are indicative of some sizable support. As these readings run contrary to the EMA bias, the current expectation is that the USDCHF enters a medium-term ranging phase and that it will bounce between the 61.8% and 38.2% Fibonacci levels. Such a trend would largely be in line with the fundamental bias which is also relatively neutral, this being a result of buoyancy stemming from expectations of a US rate hike and simultaneous negative sentiment from the CHF’s safe haven status.
Eventually, the ranging phase will come to an end which will likely necessitate a rather solid slip to the downside. Primarily, this will be due to the influence of the upside of the wedge coming into conflict with the USDCHF but the 100 day EMA could also play a role in sending it lower. Regardless, we should expect to see the pair tumble back to support around the 0.9824 mark as it seeks to complete its consolidation phase in earnest.
Ultimately, keep an eye on the Swissy moving ahead as it could have a somewhat interesting few weeks in store for us. As discussed, the near to medium-term ranging phase coupled with a subsequent plunge back to the downside of the structure presents a number of opportunities that may be worth seizing on. However, don’t neglect the fundamental side of things as a shift in the perceived probability of a US rate hike could see negative sentiment win out sooner than currently expected.
EUR/GBP Candlesticks and Ichimoku Analysis
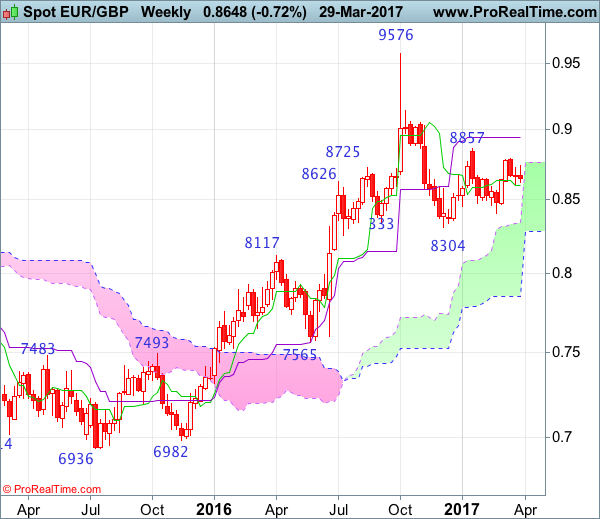
Weekly
• Last Candlesticks pattern: N/A
• ime of formation: N/A
• Trend bias: Near term up
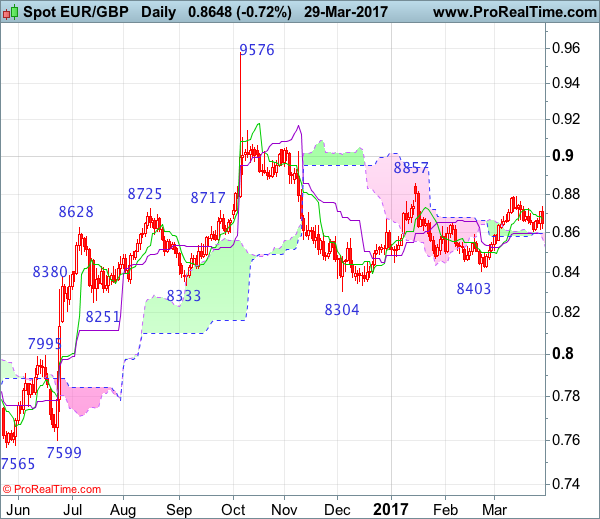
Daily
• Last Candlesticks pattern: Hammer
• Time of formation: 3 Feb 2016
• Trend bias: Up
EURGBP – 0.8643
Although the single currency did rebound after finding support at 0.8605 as suggested, as euro ran into resistance at 0.8735 yesterday and has retreated quite sharply, deferring our bullishness and further consolidation would take place, however, still reckon downside would be limited to 0.8605 (said support and current level of the Kijun-Sen), bring another rise later, above said resistance at 0.8735 would signal pullback from 0.8788 has ended, bring retest of this level. Looking ahead, break there would extend rise from 0.8403 to 0.8810-15 but as broad outlook remains consolidative, reckon upside would be limited to previous resistance at 0.8857, risk from there is seen for a retreat to take place later. Only break of said resistance at 0.8857 would signal the rise from 0.8304 low is underway for headway to 0.8900, then towards 0.8940 (50% Fibonacci retracement of 0.9576-0.8304) which is likely to hold from here.
On the downside, whilst marginal weakness from here cannot be ruled out, reckon the Kijun-Sen (now at 0.8605) would contain downside and bring another rise later. A daily close below the Kijun-Sen would signal top is formed and bring weakness to 0.8550-55 and then test of the lower Kumo (now at 0.8527) but break of 0.8505-10 is needed to signal the rebound from 0.8403 has ended, bring subsequent fall to 0.8460-65, however, price should stay well above said support at 0.8403 and bring another rebound later.
Recommendation: Hold long entered at 0.8605 for 0.8785 with stop below 0.8505.
On the weekly chart, as the single currency has remained confined within recent established range, retaining our view that initial consolidation below indicated resistance at 0.8788 would be seen and pullback to the Tenkan-Sen (now at 0.8596) cannot be ruled out, however, reckon downside would be limited to 0.8580 and bring another rise later. Above said resistance at 0.8788 would extend the rebound from 0.8403 towards said resistance at 0.8857. Looking ahead, only a break of this level would revive bullishness and extend the rise from 0.8304 to 0.8940 (50% Fibonacci retracement of 0.9576-0.8304 and current level of the Kijun-Sen) but price should falter below resistance at 0.9026.
On the downside, expect pullback to be limited and 0.8595-00 should hold, bring another rebound. Below 0.8550 would defer and risk weakness to 0.8520 but reckon 0.8495-00 would contain downside. Below 0.8460-65 would bring retest of 0.8403 but break there is needed to revive bearishness and extend the fall from 0.8857 to 0.8350-55. Looking ahead, below there would signal decline from 0.9576 top has resumed for retest of 0.8304 but only break there would extend the fall from 0.9576 top for retracement of medium term upmove to previous support at 0.8251, then 0.8200.
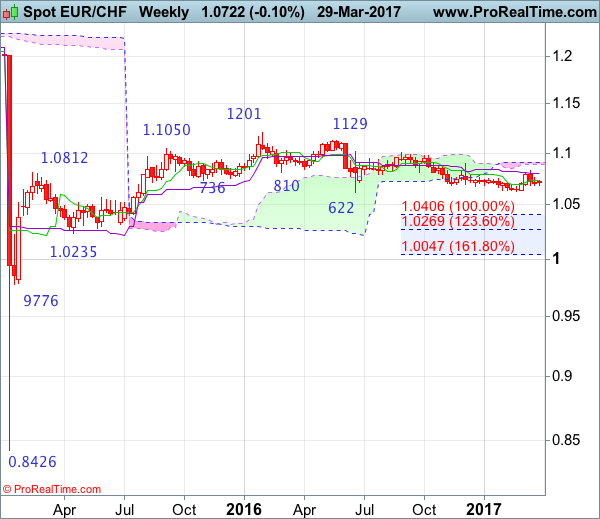
EUR/CHF Candlesticks and Ichimoku Analysis
Weekly
• Last Candlesticks pattern: Doji
• Time of formation: 20 Feb 2017
• Trend bias: Up
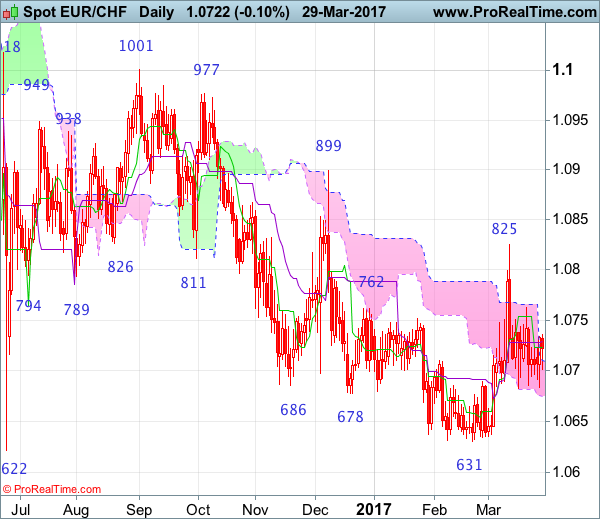
Daily
• Last Candlesticks pattern: Doji
• Time of formation: 1 Sep 2016
• Trend bias: Near term down
EUR/CHF – 1.0723
As the single currency continued finding support around 1.0683-84 and has recovered, retaining our view that further sideways consolidation would be seen and mild downside bias remains for another retreat to said support, however, break of 1.0622-31 level is needed to retain bearishness and signal the decline from 1.1201 (2016 high) has resumed and extend further fall to 1.0590-00, then towards 1.0530-35 but loss of downward momentum should prevent sharp fall below 1.0500, price should stay well above 1.0400-10, risk from there has increased for a strong rebound to take place later.
On the upside, whilst recovery towards resistance at 1.0763 cannot be ruled out, reckon upside would be limited and bring another decline later. A daily close above 1.0763 would risk another bounce to indicated resistance at 1.0825 but break there is needed to shift risk back to upside and signal low has been formed instead, bring further subsequent gain to 1.0850, however, price should falter below key resistance at 1.0899 (Dec high), risk from there is seen for a retreat later.
Recommendation: Hold short entered at 1.0725 for 1.0525 with stop above 1.0825.
On the weekly chart, as the single currency retreated after meeting resistance at 1.0825 earlier this month and a long black candlestick was formed, suggesting top is possibly formed there and consolidation below this level is seen with mild downside bias for weakness towards strong support at 1.0622-31, however, break there is needed to signal recent decline from 1.1201 top has resumed and extend further fall to 1.0550-55, then 1.0500-10 but oversold condition should prevent sharp fall below 1.0400-10 (100% projection of 1.1201-1.0622 measuring from 1.1001) and price should stay well above previous support at 1.0314, risk from there is seen for a rebound to take place later.
On the upside, expect recovery to be limited and resistance at 1.0763-70 should hold, bring another decline. Only above said resistance at 1.0825 would signal low has been formed at 1.0631, bring retracement of recent decline to 1.0850 but a break above indicated resistance at 1.0899 is needed to add credence to this view and bring a stronger rebound to 1.0970-75, then test of 1.1001. Looking ahead, only a sustained breach above 1.1001 would signal the fall from 1.1201 has ended, bring further gain to 1.1100 but reckon resistance at 1.1129 would hold on first testing.