Sample Category Title
Daily Technical Analysis
EURUSD
The EURUSD continued its bearish momentum yesterday bottomed at 1.0739. The bias remains bearish in nearest term testing 1.0700 region. A clear break and daily close below that area would expose 1.0600 region as a part of the “shooting star” formation (daily chart)bearish scenario after the false break above 1.0873 on Monday. Immediate resistance is seen around 1.0785. A clear break above that area could lead price to neutral zone in nearest term testing 1.0825 area. Overall I remain neutral.
GBPUSD
The GBPUSD attempted to push lower yesterday bottomed at 1.2375 but whipsawed to the upside and closed higher at 1.2435. The bias is neutral in nearest term but as long as stay below 1.2475 I prefer a bearish scenario at this phase targeting 1.2350 – 1.2300 region as a part of the bearish scenario after fell below the bullish channel as you can see on my H1 chart below. On the upside, a clear break and daily close back above 1.2475 would nullify the current short-term bearish trend testing 1.2530 area or higher. Overall I remain neutral.
USDJPY
The USDJPY was indecisive yesterday. The bias is neutral in nearest term. The “hammer” bullish reversal scenario remains valid and any sustained movement back above 111.30 could create a nice bullish run testing 112.00 – 113.00 region or higher. On the downside, key support remains at 110.10. A clear break below that area would cancel the “hammer” bullish reversal scenario.
USDCHF
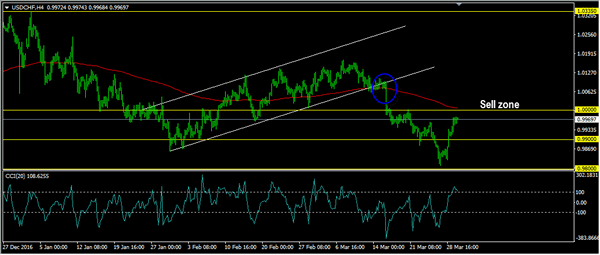
The USDCHF continued its bullish momentum yesterday topped at 0.9976. The bias remains bullish in nearest term testing 1.0000 key resistance area which is a good place to sell with a tight stop loss. Immediate support is seen around 0.9935. A clear break below that area could lead price to neutral zone in nearest term testing 0.9900 or lower. Overall I remain neutral.
USDJPY Elliott Wave View: Flat Correction
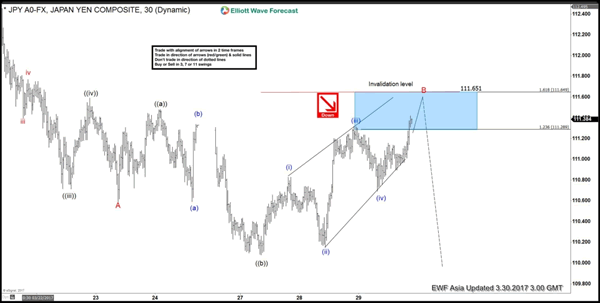
Short term Elliott Wave view in USDJPY suggests that cycle from 3/10 peak (115.53) has ended with Minor wave A at 110.589. Decline from 115.53 is unfolding as a 5 waves impulse Elliott wave structure with an extension where Minute wave ((i)) ended at 114.46, Minute wave ((ii)) ended at 115.19, Minute wave ((iii)) ended at 110.7, Minute wave ((iv)) ended at 111.59, and Minute wave ((v)) of A ended at 110.59. USDJPY ended cycle from 3/10 peak and correcting that cycle in wave B bounce in 3, 7, or 11 swing.
Wave B bounce is unfolding as an Expanded Flat Elliott wave structure where Minute wave ((a)) ended at 111.48 and Minute wave ((b)) ended at 110.077. Minute wave ((c)) of B ideally ends at 111.29 – 111.65 area or 1.236 – 1.618 extension of Minute ((a)) and ((b)) and from the area, pair should then either resume to a new low or at least pullback in 3 waves. However, due to the nature of an expanded Flat structure, wave C of a Flat can extend even beyond 1.618 extension. In other words, cycle from 3/27 low ideally ends at 111.29 – 111.65, but can also extend a bit higher and still considered to be part of the same Flat structure starting from 3/27 low. The more important invalidation level therefore is the pivot at 3/10 high (115.53) and wave B bounce should unfold in 3, 7, or 11 swing and the bounce is expected to stay below 115.53 for the next extension to the downside. We don’t like buying the pair.
1 Hour USDJPY Elliott Wave Chart
Daily Technical Outlook And Review
A note on lower timeframe confirming price action...
Waiting for lower timeframe confirmation is our main tool to confirm strength within higher timeframe zones, and has really been the key to our trading success. It takes a little time to understand the subtle nuances, however, as each trade is never the same, but once you master the rhythm so to speak, you will be saved from countless unnecessary losing trades. The following is a list of what we look for:
- A break/retest of supply or demand dependent on which way you're trading.
- A trendline break/retest.
- Buying/selling tails ... essentially we look for a cluster of very obvious spikes off of lower timeframe support and resistance levels within the higher timeframe zone.
- Candlestick patterns. We tend to only stick with pin bars and engulfing bars as these have proven to be the most effective.
EUR/USD
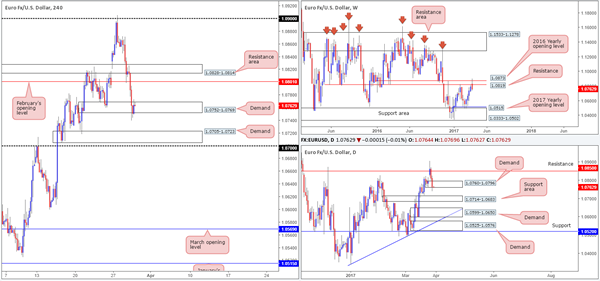
Despite the H4 demand at 1.0752-1.0769 holding firm yesterday, the EUR is under noticeable pressure. The selloff from the 2016 yearly opening level at 1.0873 has been strong. According to the weekly timeframe, and this is assuming that price also remains below resistance at 1.0819, the next downside target does not come into view until the 2017 yearly opening level at 1.0515/support area at 1.0333-1.0502. On a more positive note, however, daily demand at 1.0760-1.0796 is in play and may lend a hand to the H4 bulls!
Our suggestions: To our way of seeing things, the pair reflects quite a strong bearish stance at present. While there are daily/H4 demands currently in motion, both have recently suffered a breach. The next downside hurdle beyond the current H4 demand is 1.0705-1.0723: another H4 demand base which happens to occupy the top edge of a daily support area coming in at 1.0714-1.0683. Seeing as how there are only 20 or so pips to play with between the two H4 areas, our team is reluctant to commit to shorts. Sometimes no position is the better position!
Data points to consider: US final GDP and US unemployment claims at 1.30pm. FOMC member Kaplan also takes the stage at 4pm GMT.
Levels to watch/live orders:
- Buys: Flat (stop loss: N/A).
- Sells: Flat (stop loss: N/A).
GBP/USD
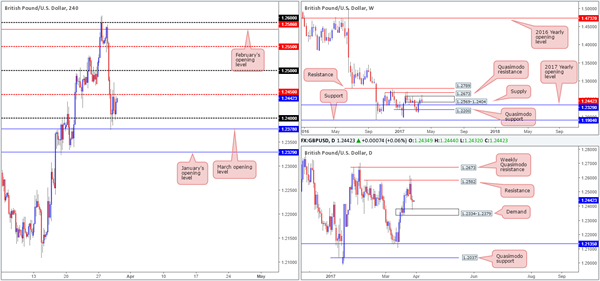
Following an upside breach of the weekly supply zone at 1.2569-1.2404, the bears have remained in the driving seat. Unfortunately though, this selling could come to a halt sometime soon, due to the 2017 yearly opening base sitting just below at 1.2329. On the other side of the coin, nevertheless, daily action has already touched base with a demand area pegged at 1.2334-1.2379. Should the bulls hold ground here, the unit could potentially rally back up to resistance drawn in at 1.2582.
Jumping across to the H4 candles, we can see that the pair spent yesterday’s sessions fluctuating between a mid-level resistance at 1.2450 and the 1.24 handle, as British Prime Minister Theresa May invoked Article 50 of the Lisbon Treaty. Directly below this temporary range is March’s opening level at 1.2378, whereas to the upside we have the 1.25 handle in sight.
Our suggestions: A difference of opinion is clearly seen on the higher timeframes (see above). Therefore, trading this market is tricky. In the event that the H4 closes above 1.2450 and holds as support, however, there might be scope to trade long here for a quick bounce up to 1.25. We would not want to target any higher than this given that there is a weekly supply area in motion.
Data points to consider: US final GDP and US unemployment claims at 1.30pm. FOMC member Kaplan also takes the stage at 4pm GMT.
Levels to watch/live orders:
- Buys: Watch for price to engulf 1.2450 and look to trade any retest seen thereafter ([waiting for a lower-timeframe signal to form following the retest is advised – see the top of this report] stop loss: dependent on where one confirms the line).
- Sells: Flat (stop loss: N/A).
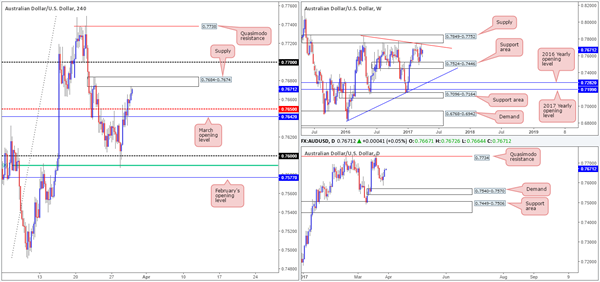
AUD/USD
As can be seen from the H4 chart this morning, supply at 0.7684-0.7674 elbowed its way into the spotlight yesterday, following the break of the mid-level resistance 0.7650. A short from this region is not something we would typically label as high probability. Not only is there little leg room seen below to 0.7650/March’s opening level at 0.7642, the supply also lacks higher-timeframe convergence.
An area we do like the look of, however, is the H4 Quasimodo resistance level coming in at 0.7738. This line brings together a collection of noteworthy resistances: the daily Quasimodo resistance at 0.7734 and a weekly trendline resistance etched from a high of 0.7835, which is located directly below the weekly supply at 0.7849-0.7752.
Our suggestions: Apart from the H4 Quasimodo resistance level highlighted above, there’s not much else to hang our hat on at the moment. Should price strike 0.7738 sometime today, we would, dependent on the time of day, consider entering short without additional confirmation and placing stops above the apex of the Quasimodo formation at 0.7752.
Data points to consider: US final GDP and US unemployment claims at 1.30pm. FOMC member Kaplan also takes the stage at 4pm GMT.
Levels to watch/live orders:
- Buys: Flat (stop loss: N/A).
- Sells: 0.7738 (stop loss: 0.7752).
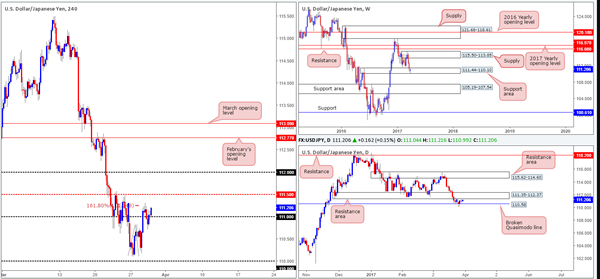
USD/JPY
In recent sessions, the USD/JPY sold off from the 161.8% H4 Fib ext. at 111.25 (taken from the low 110.11) and even managed to surpass the 111 handle. As you can see though, price managed to recover relatively quickly and broke back above 111 going into the US segment.
In view of weekly bulls defending the support area at 111.44-110.10, the H4 mid-level resistance at 111.50 will likely be challenged today. 111.50 also happens to be housed within a daily resistance area at 111.35-112.37, which has capped upside since the 23rd March.
Our suggestions: The bulls do look to be gaining the upper hand at the moment. With that being said though, we would like to see a decisive H4 close above 111.50 before committing here. A close above this number would, in our opinion, demonstrate strength from the weekly support area and weakness from the daily resistance area.
As such, a close above 115.50, followed by a retest as support and a lower-timeframe confirming signal (see the top of this report) is, we believe, enough to justify a long position, targeting 112 as an initial take-profit zone.
Data points to consider: US final GDP and US unemployment claims at 1.30pm. FOMC member Kaplan also takes the stage at 4pm GMT.
Levels to watch/live orders:
- Buys: Watch for price to engulf 111.50 and look to trade any retest seen thereafter ([waiting for a lower-timeframe signal to form following the retest is advised] stop loss: dependent on where one confirms the line).
- Sells: Flat (stop loss: N/A).
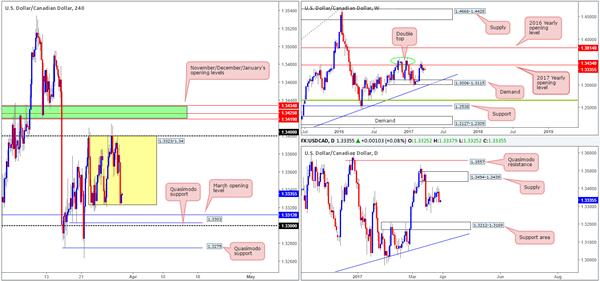
USD/CAD
Since the 22nd March, the USD/CAD has been chiseling out a consolidation fixed between 1.3323/1.34. Helped by a recovery in oil prices, the pair was forced down to the lower limits of this range yesterday, which, as you can see, is currently holding form. Of particular interest here is that this H4 range has formed just below the 2017 yearly opening level at 1.3434. Owing to there being space for the market to selloff on both the weekly and daily charts, the consolidation will eventually break to the downside. So, we’ll refrain from entering long within this boundary.
Our suggestions: Although the higher timeframes show room to drop lower, H4 structure could potentially throw a spanner in the works here. Directly below the current H4 range, there’s March’s opening level at 1.3312 to contend with, as well as the H4 Quasimodo support at 1.3303 and 1.33 handle. Given this factor, a short on the break of this range is also not really something we’d feel comfortable trading.
Data points to consider: US final GDP and US unemployment claims at 1.30pm. FOMC member Kaplan also takes the stage at 4pm GMT.
Levels to watch/live orders:
- Buys: Flat (stop loss: N/A).
- Sells: Flat (stop loss: N/A).
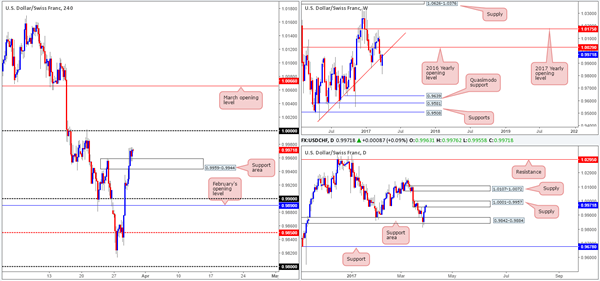
USD/CHF
Kicking this morning’s report off with a look at the weekly chart, we can see that price is now testing the underside of a recently broken trendline support taken from the low 0.9443. In conjunction with weekly price, the buyers and sellers on the daily chart are currently battling for position within supply drawn from 1.0001-0.9957.
Turning our attention to the H4 chart, nonetheless, the support area at 0.9959-0.9944 is holding firm, which could force price to test parity (1.0000) sometime today. 1.0000 is, in our opinion, a sound number to be looking to short from owing to it also being planted within the top edge of the current daily supply!
Our suggestions: Psychological boundaries are typically prone to fakeouts, and 1.0000 is not any different. Therefore, before a sell is considered here, we would like to see some form of lower-timeframe confirmation present itself (see the top of this report). This will help avoid the dreaded fakeout! The first take-profit target from this angle is the above noted H4 support area.
Data points to consider: US final GDP and US unemployment claims at 1.30pm. FOMC member Kaplan also takes the stage at 4pm GMT.
Levels to watch/live orders:
- Buys: Flat (stop loss: N/A).
- Sells: 1.0000 region ([waiting for a lower-timeframe confirming signal to form before pulling the trigger is advised] stop loss: dependent on where one confirms the area).
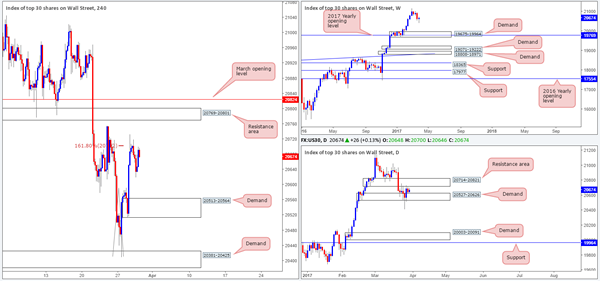
DOW 30
US stocks managed to catch an offer from the H4 161.8% ext. at 20703 (drawn from the low 20410) going into the early hours of yesterday’s session. This brought the unit down to a low of 20620, before price stabilized and begun to advance into the day’s end. As mentioned in Wednesday’s report, the H4 Fib ext. is bolstered by a daily resistance area coming in at 20714-20821. So, there is a chance that the sellers could step in on this market again today. The flipside to this, of course, is that weekly action is in the process of printing a nice-looking buying tail on a pullback from record highs of 21170. It takes a lot of money (professional money) to create such a pattern on this scale!
Our suggestions: Neither a long nor short seems attractive at this time. It doesn’t help to see daily price so tightly confined between the aforementioned resistance area and demand at 20527-20626. To confirm bullish strength, we want to see H4 price close above March’s opening level at 20824.
Data points to consider: US final GDP and US unemployment claims at 1.30pm. FOMC member Kaplan also takes the stage at 4pm GMT.
Levels to watch/live orders:
- Buys: Flat (stop loss: N/A).
- Sells: Flat (stop loss: N/A).
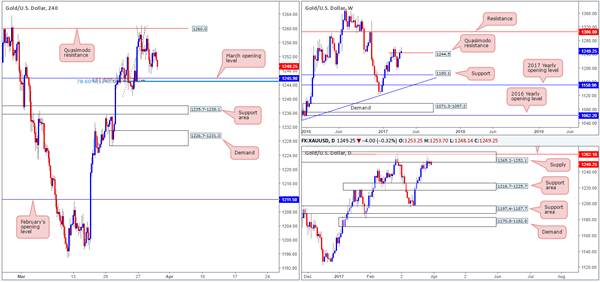
GOLD
Gold prices are little changed this morning, despite the unit ranging over $7. As such, H4 price remains loitering just ahead of March’s opening level at 1245.9. Further bolstering this level is a 161.8% Fib ext. at 1245.3 taken from the high 1260.9 and a 78.6% retracement penciled in from the low 1240.8 at 1245.0. Additionally, there is a potential three-drive H4 approach setting up from the high 1260.9.
As we mentioned in yesterday’s report that although we do expect a bounce to be seen from the 1245.0/1245.9 neighborhood, let’s not forget to be mindful of the bigger picture here. Weekly movement shows that price is trading above a weekly Quasimodo resistance line at 1244.5. Nevertheless, our desk has noted that until the high of this formation is broken (1263.7), the weekly line will remain valid. In other words, all the while the daily supply area at 1265.2-1252.1 is in play, the bears have the upper hand.
Our suggestions: Based on the confluence seen surrounding the 1245.9 zone, we might look to trade this level for a scalp this morning (still, we would prefer it if this level is confirmed by the lower timeframes beforehand [see the top of this report]). Aiming to trade this level for anything more than a small bounce is risky given the higher-timeframe structures in motion right now.
Levels to watch/live orders:
- Buys: 1245.9 region ([waiting for a lower-timeframe confirming signal to form is advised before pulling the trigger [stop loss: dependent on where one confirms this area).
- Sells: Flat (stop loss: N/A).
European Open Briefing
Global Markets:
- Asian stock markets: Nikkei down 0.35 %, Shanghai Composite lost 1.10 %, Hang Seng declined 0.50 %, ASX 200 gained 0.35 %
- Commodities: Gold at $1249 (-0.40 %), Silver at $18.17 (-0.45 %), WTI Oil at $49.50 (-0.05 %), Brent Oil at $52.45 (-0.20 %)
- Rates: US 10-year yield at 2.39, UK 10-year yield at 1.15, German 10-year yield at 0.34
News & Data:
- Australia HIA New Home Sales (MoM) Feb: 0.2% (prev -2.2%)
- Australia Job Vacancies (QoQ) Feb: 1.8% (prev 2.2%)
- PBoC Fixes USDCNY Reference Rate At 6.8889 (prev fix 6.8915 prev close 6.8898)
- Fed’s Williams: I would not rule out more than three increases total for this year, but emphasis is on ‘gradual’ pace in increases
- Williams: US economy is as close to Fed’s dual mandate “as we’ve ever been”
- Fed’s Rosengren: The Economy Is Strong Enough to Have 4 Hikes This Year
- Asia shares creep up to near two-year peak, dollar firms – RTRS
Markets Update:
The US Dollar appreciated against most other major currencies following hawkish comments from several Federal Reserve members.
EUR/USD declined to a low of 1.0740 in Asia. Key support is seen ahead of 1.07. Should it break below that level, the technical outlook would look increasingly bearish again. Meanwhile, the Pound declined on the official Brexit Day, but stayed relatively calm in the past two trading sessions. There were no surprised and it was mostly old news. Strong support is seen around 1.2350, and a break below would signal a move back to 1.22. However, GBP/USD remains well bid so far and could have another test of 1.25 resistance soon.
Despite the hawkish Fed comments, USD/JPY was not able to rally much. The pair reached a high of 111.42, but selling interest ahead of the key 111.50 resistance level proved to be decent. Key support is seen at 110.50 and 110.00, while resistance lies at 111.50 and 112.20-25.
Today we will the US GDP number, which could boost volatility in the FX market and set the direction of the US Dollar for the rest of the week.
Upcoming Events:
- 11:00 GMT – Euro Zone Consumer Confidence
- 13:00 GMT – German CPI
- 13:30 GMT – US GDP
- 13:30 GMT – US Initial Jobless Claims
Market Morning Briefing
STOCKS
Worries of monetary tightening continue to impact the stocks negatively. Shanghai (3216.73, -0.79%) came down, breaking below the immediate support on the daily candles. Important support below current levels would come near 3200 which is expected to hold in the medium term. The dip could be short lived and we could possibly see a bounce back in the coming sessions.
Dow (20659.32, -0.20%) was almost trading flat with no major movement seen yesterday. If we do not see a n immediate rise back above 20800, there could be chances that the corrective dip may not be over yet. The index may remain stable this week above 20400.
Dax (12203, +0.44%) tried to move up slightly making an intra-day high of 12233, achieving our initial target of 12220 but closed at lower levels. A rise towards 12300 and higher looks possible.
Nikkei (19169.92, -0.25%) is almost stable near current levels. 19400 could act as an immediate resistance which could keep the index sideways for another 2-3 sessions.
Nifty (9143.80, +0.47%) closed above 9100 yesterday and could continue to move towards 9200-9280 levels in the medium term.
COMMODITIES
Gold (1248) found resistance at 1264 and trading within a narrow range of 1240-1260. A break on either side could be decisive.
Silver (18.18) is still trading above its support at 17.80 of its trading range of 16.82-18.35. We have U.S. weekly unemployment claims data at 6 p.m IST, which may influence the price of silver as well as copper.
Copper (2.62) has found resistance at 2.70 levels. Only above 2.70, higher resistances of 2.80 can come into consideration. In the medium term 2.55-57 are going to be a strong support now and the chances of a close above 2.70 have increased.
Less than expected increase in U.S. weekly crude oil inventory (expected +1.2M, actual +0.9M) has helped Brent (52.35) and WTI (49.65) to close higher. This bounce was expected and it may continue for a few sessions more. Brent could touch 53.36 as it is trading above 52.20 but WTI is trading below 50.30. We will remain bearish on the energy pack in medium term due to continuous increase in U.S. crude inventory.
FOREX
Dollar remains strong against all the majors and may gradually appreciate a bit more but most of the majors are approaching near term support.
Dollar Index (100.12) has opened up higher targets of 100.70-101.00 after breaking above the interim resistance of 99.90 in line with expectations.
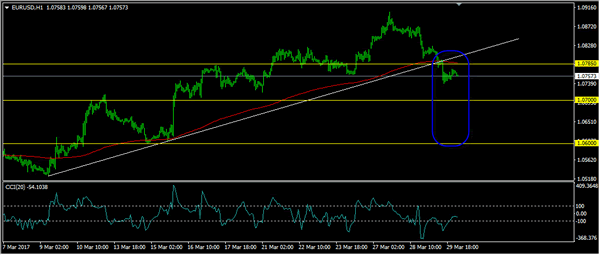
Euro (1.0746) has cracked below 1.08 and already trading much closer to the immediate target/support around 1.07 levels. It may consolidate in the range of 1.07-1.08 for the next few sessions.
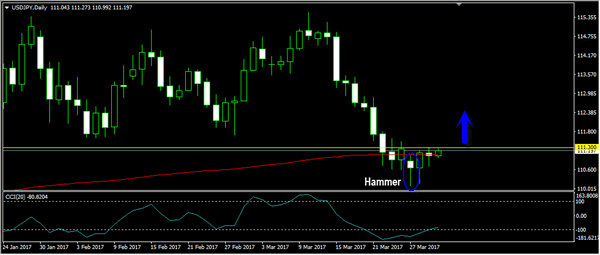
Dollar-Yen (111.33) hasn’t moved much in the last 24 hours as it still struggles around the near term resistance of 111.50-60 but the chances of a breakout towards 113.00 may be slightly higher at this point. However, a failure near 111.50-60 can resume the major downtrend and trigger the lower targets of 109.40 and 108.50 again.
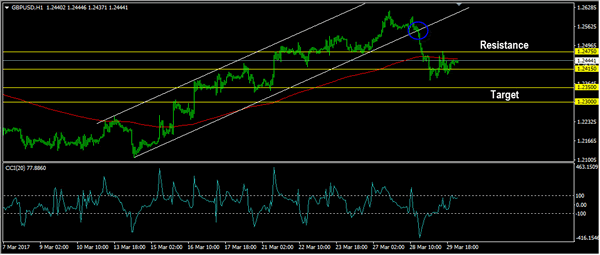
Pound (1.2439) has bounced back exactly from our support of 1.2370-60 even after the UK PM triggering the Article 50 for Brexit. A range in 1.2350-1.2600 can be built in the next few sessions and a sideways consolidation may be likely.
Aussie (0.7658) is going nowhere as expected and the sideways consolidation in the range of 0.7600-0.7750 continues, which may go on for a few more days.
Dollar Rupee (64.90) is trading at 64.84 in the NDF market, very close to our immediate target of 64.80. The price action in our target/support zone will be crucial. Resistance unchanged at 65.20.
INTEREST RATES
The German-Us 2YR (-2.04%) and the German-US 10YR (-2.06%) have both fallen and may continue to fall in the near term. This could indicate fresh Dollar strength in the near term. Euro could come down in the next 2-weeks, in that case.
The US-UK 10yr (-1.25%) is again coming off from -1.18% and looks bearish in the near term. Pound could resume the long term down trend in the coming sessions,
The Japanese yields are rising. The 5Yr (-0.13%) has risen sharply and could test resistance near -0.09% in the near term. The 10YR (0.06%) and the 30Yr (0.84%) have some more room on the upside.
Looking at the sharp falling momentum of the UK 10-5 yield spread, it looks as if it may possibly test lower levels of 0.4%, retracing the whole rise seen from Oct’16 to Feb’17.
A50 Smooth, Fed Amps Up Rhetoric
The long-awaited Article 50 trigger was largely taken in-stride by a market that had months to prepare. Instead, it was the ECB that stole the show on a report that the market had got ahead of itself. In the US, two influential FOMC member offered a hawkish shift. There are 7 Premium trades currently in progress, 3 in FX, 2 in indices and 2 in commodities.
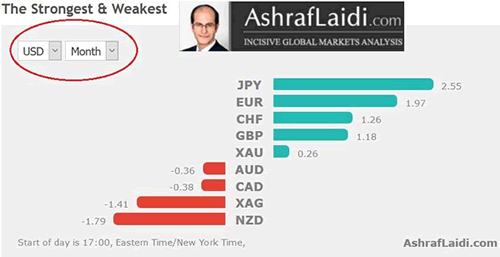
Wednesday's focus was on the pound but it finished just a handful of pips lower. The Australian dollar was the top performer while the euro lagged.
The lack of volatility on the Article 50 trigger shouldn't be a huge surprise. It was an event that was telegraphed for months and politicians on both sides avoid any inflammatory rhetoric. The next phase of GBP trading will be all about the details of negotiations but with EU leaders still getting their mandate organized, the next month may be quiet and that could send some GBP shorts to the exits.
As Article 50 headlines were crossing, the ECB had a surprise of its own. A newswire ECB sources story said markets had over-interpreted the message from the March meeting and that it was meant to convey fewer tail risks, not a change towards a more dovish policy.
The report helped to confirm the false breakout in EUR/USD as it fell more than 50 pips and back into the Dec-Feb range.
What strikes us as odd is that Nowotny and Praet have recently doubled down on the hawkish talk by signaling a potential change in the deposit rate. Perhaps this is some fine tuning by the ECB to signal a tighter corridor but no move higher in the main refi rate any time soon.
In the US, the message was clear from Williams and Rosengren - the risks are to the upside. Rosengren argued for four hikes this year and Williams said it was possible. Both pointed to a tighter labour market and upside risks.
With all the Trump, Brexit and other political jostling this week, we remind readers that ultimately economic data wins out and yesterday's consumer confidence reading was the best in 17 years. On Friday the PCE report is due and next week, the ISMs and non-farm payrolls could easily put the Fed on a more hawkish course and the dollar back in charge.
Go With The Herd And Short Gold?
After featuring XAU/AUD (the ugly cousin?), over the last couple of weeks, a double top in XAU/USD has eventually brought us back home!
First up we focus on the gold daily chart, featuring a nice double top at previous support turned possible resistance:
XAU/USD Daily:
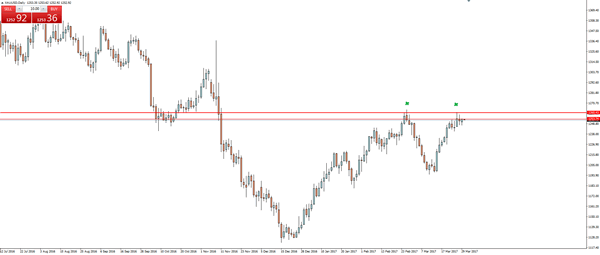
A double top that just happens to coincide with that previous swing low you can see on your MT4 charts from back in September 2016.
I guess you could call that a confluence of resistance now that we have the second touch of a potential double top? Well, whichever way you want to look at it, you have price that has retested previous support as resistance on the daily and when you zoom in that little further you can see potential for a clear double top.
So now that price is being capped by resistance, we zoom into an intraday chart to look for possible short term pullbacks to short into:
XAU/USD Hourly:
Price hasn’t cleanly rejected off the daily level like we’d ideally like, but if you’re after textbook idealism then live forex trading probably isn’t for you.
In saying that, price is forming lower highs and lower lows and this level is a short term retest that we can use to enter off and manage risk around if you’re aggressive, while still being close to enough to the double top if you’re more conservative.
It was a tongue in cheek comment about how being a contrarian to trading calls made in the mainstream media is never a bad strategy.
My chart is obviously a little different to the Gold chart in that CNBC article, but the possible herd mentality of this trade is definitely something to be aware of.
Trade Idea Wrap-up: USD/CHF – Stand aside
USD/CHF - 0.9968
Most recent candlesticks pattern : N/A
Trend : Near term down
Tenkan-Sen level : 0.9949
Kijun-Sen level : 0.9905
Ichimoku cloud top : 0.9870
Ichimoku cloud bottom : 0.9946
New strategy :
Stand aside
Position : -
Target : -
Stop : -
The greenback rallied after finding renewed buying interest at 0.9831 yesterday, dampening our bearishness and suggesting recent decline has ended at 0.9813, hence upside risk remains for this rise from 0.9813 to bring retracement of recent decline and further gain to resistance at 0.9960 would be seen but break there is needed to provide confirmation and retain bullishness for further rise towards another previous chart resistance at 1.0003 later.
In view of this, would be prudent to stand aside in the meantime. below the Kijun-Sen (now at 0.9905) would suggest an intra-day top is formed instead, bring weakness to the lower Kumo (now at 0.9846) but break of said support at 0.9831 is needed to revive bearishness for retest of 0.9813 first.
Trade Idea Wrap-up: GBP/USD – Sell at 1.2500
GBP/USD - 1.2412
Most recent candlesticks pattern : N/A
Trend : Near term up
Tenkan-Sen level : 1.2437
Kijun-Sen level : 1.2458
Ichimoku cloud top : 1.2567
Ichimoku cloud bottom : 1.2543
Original strategy :
Sell at 1.2500, Target: 1.2365, Stop: 1.2535
Position : -
Target : -
Stop : -
New strategy :
Sell at 1.2500, Target: 1.2365, Stop: 1.2535
Position : -
Target : -
Stop : -
As cable has dropped sharply since yesterday, suggesting top has been formed at 1.2616 and the selloff from there is likely to bring retracement of recent upmove, hence further weakness to 1.2360-65 (50% Fibonacci retracement of 1.2109-1.2616) would be seen, however, loss of near term downward momentum should prevent sharp fall below 1.2335 support and reckon 1.2300-05 (61.8% Fibonacci retracement) would hold from here, bring rebound later.
In view of this, we are looking to turn short on recovery as the Kijun-Sen (now at 1.2486) should limit upside and bring decline. Above 1.2500-10 would defer but only break of previous support at 1.2539 would abort and signal the fall from 1.2616 has ended instead, bring rebound to 1.2560-65 first.
Trade Idea Wrap-up: EUR/USD – Stand aside
EUR/USD - 1.0753
Most recent candlesticks pattern : N/A
Trend : Near term up
Tenkan-Sen level : 1.0771
Kijun-Sen level : 1.0806
Ichimoku cloud top : 1.0867
Ichimoku cloud bottom : 1.0848
New strategy :
Stand aside
Position : -
Target : -
Stop : -
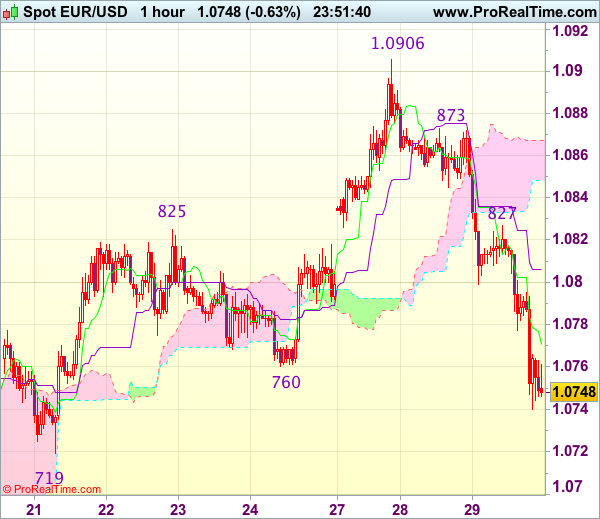
As the single currency has fallen again after brief recovery, suggesting the fall from 1.0906 is still in progress and downside risk remains for this fall to extend weakness towards support at 1.0719, however, near term oversold condition should prevent sharp all below 1.0695-00 and reckon 1.0670 would hold from here, risk from there is seen for a rebound to take place later.
In view of this, would not chase this fall here and would be prudent to stand aside in the meantime. Above 1.0780 would bring recovery to 1.0800 but only break of resistance at 1.0827 would signal low is formed, bring a stronger rebound to 1.0850 later.