
Sample Category Title
Trade Idea Update: USD/CHF – Stand aside
USD/CHF - 0.9955
New strategy :
Stand aside
Position : -
Target : -
Stop : -
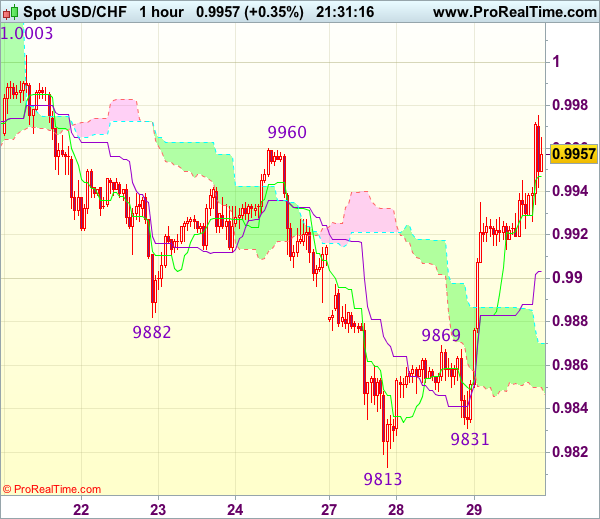
The greenback rallied after finding renewed buying interest at 0.9831 yesterday, dampening our bearishness and suggesting recent decline has ended at 0.9813, hence upside risk remains for this rise from 0.9813 to bring retracement of recent decline and further gain to resistance at 0.9960 would be seen but break there is needed to provide confirmation and retain bullishness for further rise towards another previous chart resistance at 1.0003 later.
In view of this, would be prudent to stand aside in the meantime. below the Kijun-Sen (now at 0.9888) would suggest an intra-day top is formed instead, bring weakness to the lower Kumo (now at 0.9851) but break of said support at 0.9831 is needed to revive bearishness for retest of 0.9813 first.
Trade Idea Update: GBP/USD – Sell at 1.2500
GBP/USD - 1.2420
Original strategy :
Sell at 1.2500, Target: 1.2365, Stop: 1.2535
Position : -
Target : -
Stop : -
New strategy :
Sell at 1.2500, Target: 1.2365, Stop: 1.2535
Position : -
Target : -
Stop : -
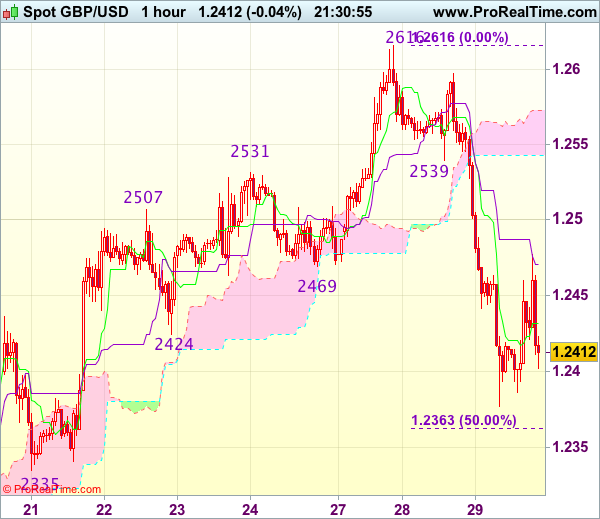
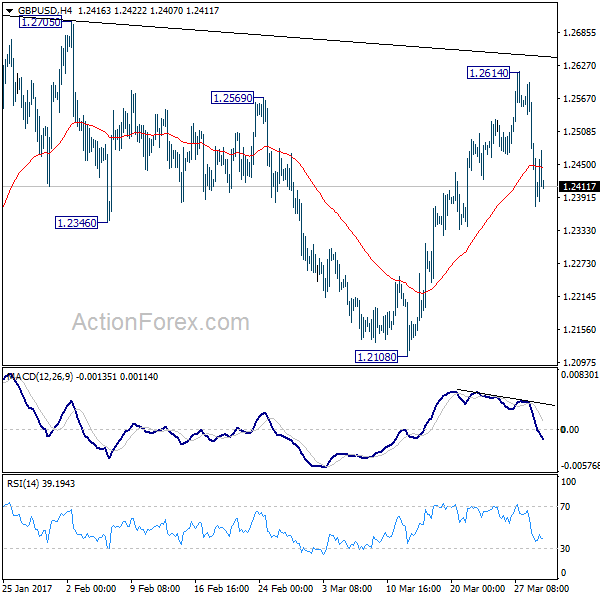
As cable has dropped sharply since yesterday, suggesting top has been formed at 1.2616 and the selloff from there is likely to bring retracement of recent upmove, hence further weakness to 1.2360-65 (50% Fibonacci retracement of 1.2109-1.2616) would be seen, however, loss of near term downward momentum should prevent sharp fall below 1.2335 support and reckon 1.2300-05 (61.8% Fibonacci retracement) would hold from here, bring rebound later.
In view of this, we are looking to turn short on recovery as the Kijun-Sen (now at 1.2486) should limit upside and bring decline. Above 1.2500-10 would defer but only break of previous support at 1.2539 would abort and signal the fall from 1.2616 has ended instead, bring rebound to 1.2560-65 first.
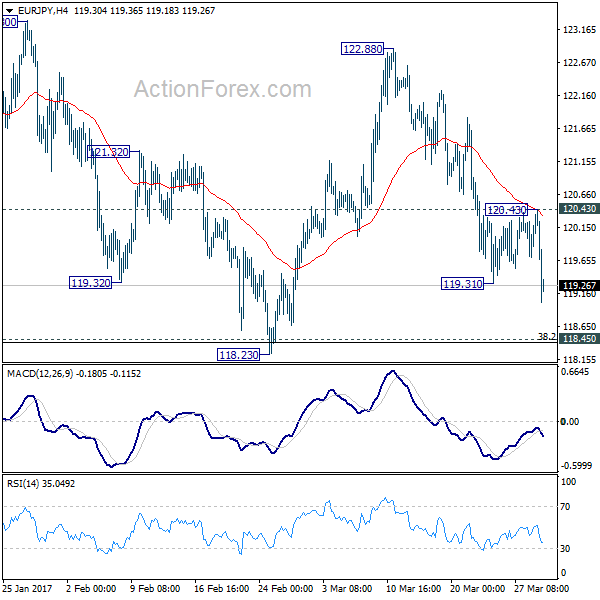
EUR/JPY Mid-Day Outlook
Daily Pivots: (S1) 119.79; (P) 120.08; (R1) 120.48; More...
EUR/JPY's fall from 122.88 resumed by taking out 119.31 and reaches as low as 119.00 so far. Intraday bias is back on the downside for 118.23 support. Overall, price actions from 124.08 are seen as a consolidation pattern. Hence we'd expect strong support around 118.45 key cluster support level (38.2% retracement of 109.20 to 124.08 at 118.39) to contain downside and bring rebound. On the upside, above 120.43 minor resistance will turn bias back to the upside for 122.88 resistance.
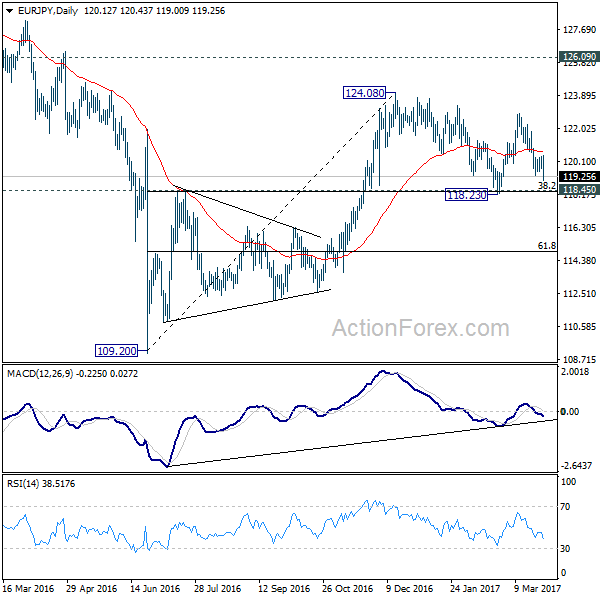
In the bigger picture, we're holding on to the view that medium term rise from 109.20 is still in progress. Focus is on 126.09 key resistance level. Sustained break will confirm completion of the whole decline from 149.76. And rise from 109.20 is of the same degree as the fall from 149.76. In such case, further rally would be seen to 104.04 resistance and possibly above before topping. Meanwhile, rejection from 126.09, or firm break of 118.45 cluster support, will likely extend the fall from 149.76 through 109.20 low.
Trade Idea Update: EUR/USD – Stand aside
EUR/USD - 1.0754
New strategy :
Stand aside
Position : -
Target : -
Stop : -
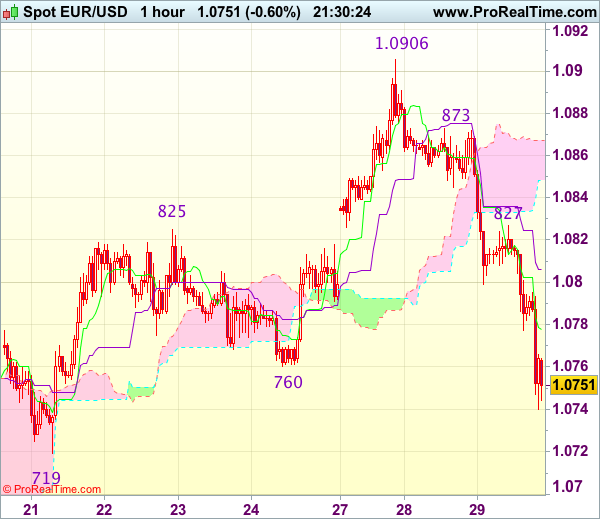
As the single currency has fallen again after brief recovery, suggesting the fall from 1.0906 is still in progress and downside risk remains for this fall to extend weakness towards support at 1.0719, however, near term oversold condition should prevent sharp all below 1.0695-00 and reckon 1.0670 would hold from here, risk from there is seen for a rebound to take place later.
In view of this, would not chase this fall here and would be prudent to stand aside in the meantime. Above 1.0780 would bring recovery to 1.0800 but only break of resistance at 1.0827 would signal low is formed, bring a stronger rebound to 1.0850 later.
EUR/GBP Mid-Day Outlook
Daily Pivots: (S1) 0.8639; (P) 0.8663; (R1) 0.8709; More...
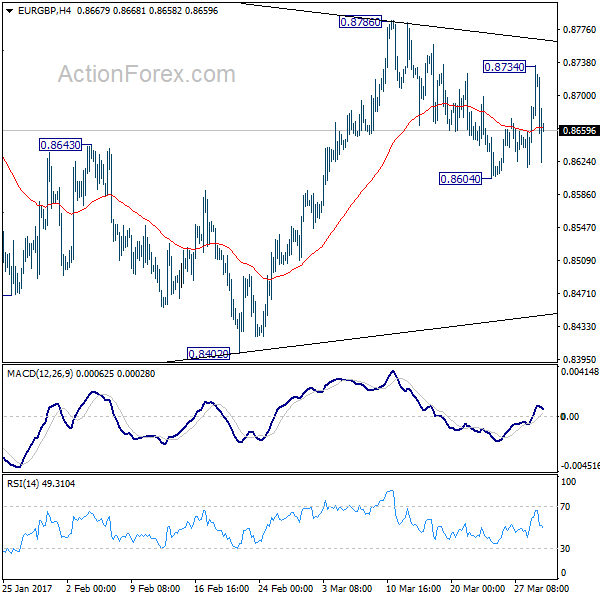
EUR/GBP rebounded to as high as 0.8734 earlier today but quickly reversed. The development mixed up the near term outlook a bit and turns intraday bias neutral first. Still, price actions from 0.8303 are forming a corrective pattern, as the second leg of the correction from 0.9304. Below 0.8604 will turn bias to the downside for 0.8402. Break will target 0.8116 cluster support, where the correction from 0.9304 should end. On the upside, above 0.8786 will target 61.8% retracement of 0.9304 to 0.8303 at 0.8922 instead.
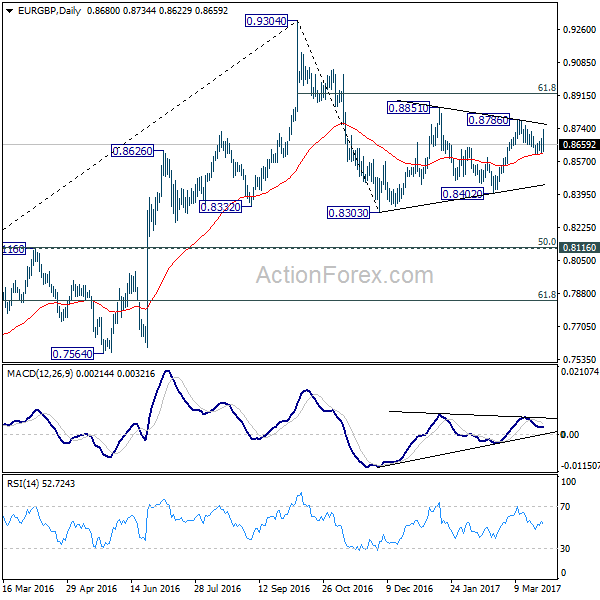
In the bigger picture, price actions from 0.9304 are viewed as a medium term corrective pattern. Deeper fall cannot be ruled out yet. But we'd expect strong support from 0.8116 cluster support (50% retracement of 0.6935 to 0.9304 at 0.8120) to contain downside. Overall, the corrective pattern would take some time to complete before long term up trend resumes at a later stage. Break of 0.9304 will pave the way to 0.9799 (2008 high).
Trade Idea Update: USD/JPY – Hold short entered at 111.20
USD/JPY - 110.90
Original strategy :
Sold at 111.20, Target: 110.20, Stop: 111.35
Position : - Short at 111.20
Target : - 110.20
Stop : - 111.35
New strategy :
Hold short entered at 111.20, Target: 110.20, Stop: 111.35
Position : - Short at 111.20
Target : - 110.20
Stop : - 111.35
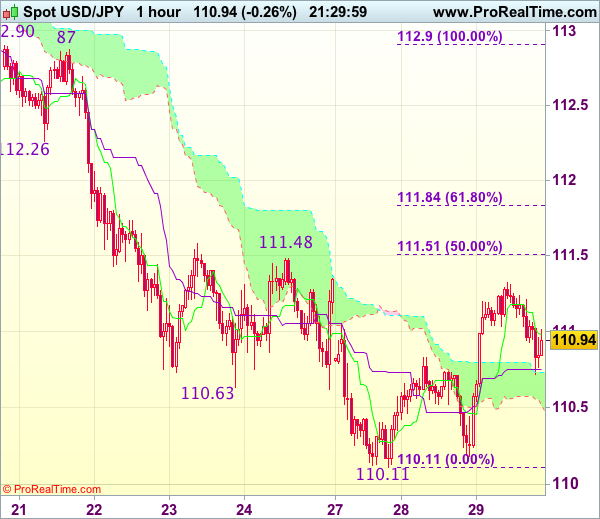
Although dollar staged a strong rebound after holding above support at 110.11, as this move is still viewed as retracement of recent decline, reckon upside would be limited to 111.30-35 and bring retreat later, below the Kijun-Sen (now at 110.75) would bring weakness to 110.50 but only break of said support at 110.11 would confirm recent decline has resumed and extend weakness to 109.95-00 but loss of downward momentum should prevent sharp fall below 109.70-75 and reckon 109.50 would hold.
In view of this, we are holding on to our short position entered at 111.20, Only above 111.48-51 (previous resistance and 50% Fibonacci retracement of 112.90-110.11) would abort and signal low is formed, bring a stronger rebound to 111.80-85 first (61.8% Fibonacci retracement).
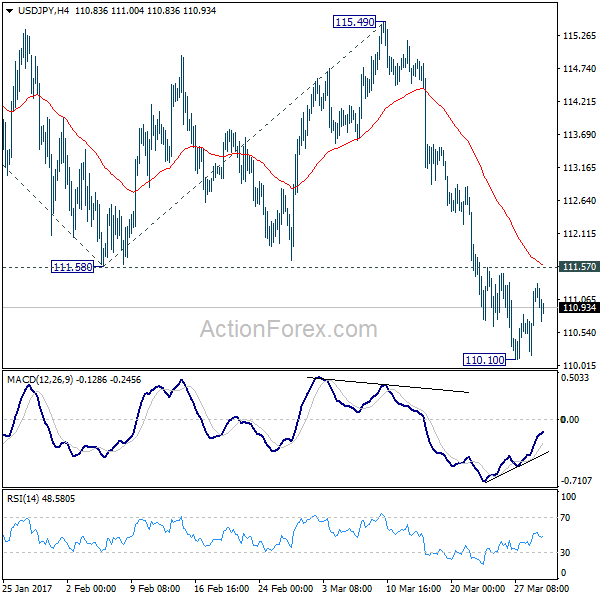
USD/JPY Mid-Day Outlook
Daily Pivots: (S1) 110.47; (P) 110.84; (R1) 111.49; More...
USD/JPY's consolidation from 110.10 temporary low is still in progress and intraday bias stays neutral first. As long as 111.57 resistance holds, deeper decline is in favor. Below 110.10 will extend the current fall from 118.65 to 100% projection of 118.65 to 111.58 from 115.49 at 108.42 and possibly below. Meanwhile, firm break of 111.57 will indicate short term bottoming and bring rebound back to 55 day EMA (now at 112.96).
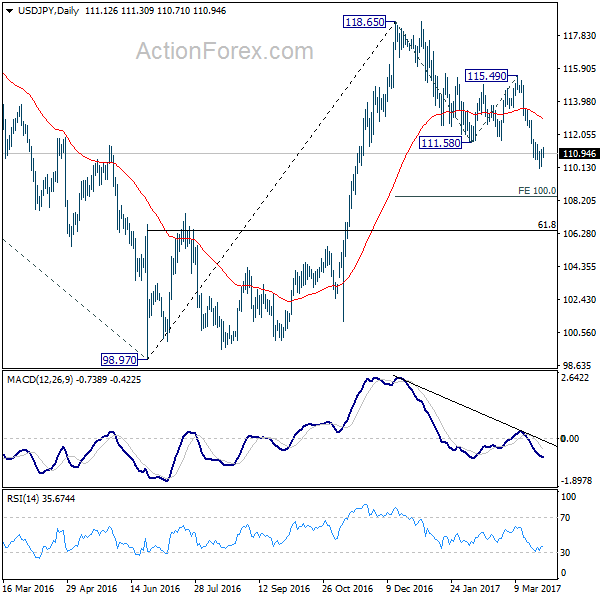
In the bigger picture, price actions from 125.85 high are seen as a corrective pattern. sustained trading below 55 week EMA (now at 111.11) will indicates that such consolidation is not completed. And another fall would be seen back to 98.97 as the third leg. In that case, downside would be contained by 61.8% retracement of 75.56 to 125.95 at 94.77 to complete the correction. On the upside, above 115.49 will extend the rise from 98.97 to retest 125.85 first. Overall, up trend from 75.56 is expected to resume after the consolidation from 125.85 completes.
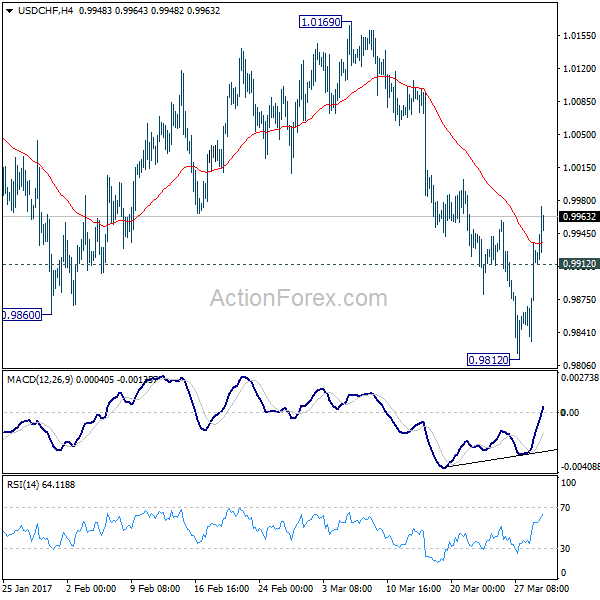
USD/CHF Mid-Day Outlook
Daily Pivots: (S1) 0.9858; (P) 0.9897; (R1) 0.9962; More.....
USD/CHF's rebound from 0.9812 extends higher today. The break of 0.9959 resistance indicates short term bottoming at 0.9812 on bullish convergence condition in 4 hour MACD. Intraday bias is turned back to the upside for 55 day EMA (now at 1.0025). Sustained trading above there will argue that whole decline from 1.0342 has completed. Further rise should then be seen to 1.0169 resistance for confirmation. On the downside, below 0.9912 minor support will turn bias back to the downside for 0.9812 instead.
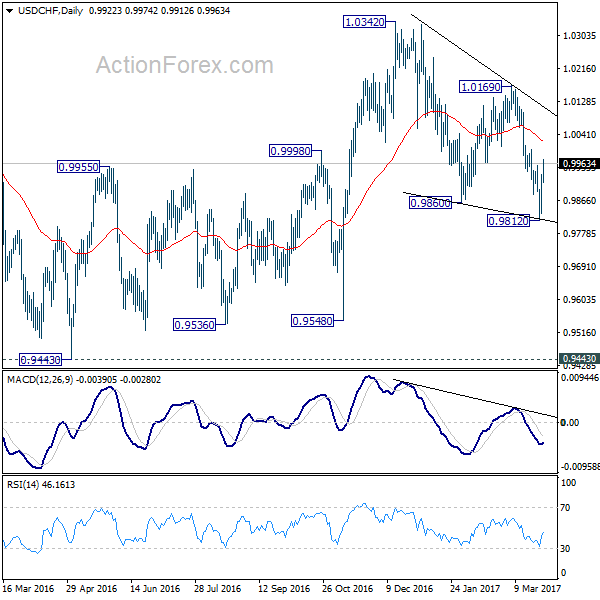
In the bigger picture, USD/CHF is staying in medium term sideway pattern between 0.9443/1.0342. In any case, decisive break of 1.0342 resistance is needed to confirm underlying strength. Otherwise, we'll stay neutral in the pair first. In case of deeper fall, we'd expect strong support from 0.9443/9548 support zone.
GBP/USD Mid-Day Outlook
Daily Pivots: (S1) 1.2395; (P) 1.2496; (R1) 1.2551; More...
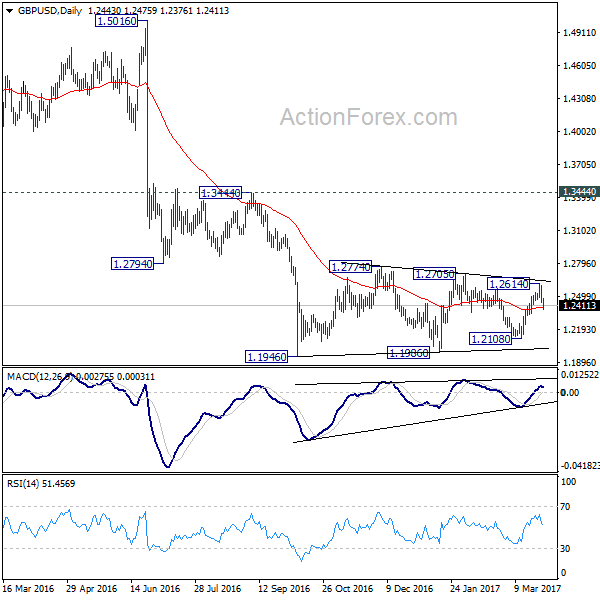
Intraday bias in GBP/USD remains on the downside for the moment as fall from 1.2614 continues. Rebound from 1.2108 could have completed on bearish divergence condition in 4 hours MACD. Deeper decline would be seen back to 1.2108 support. Overall, price actions from 1.1946 are viewed as a consolidation pattern pattern. Break of 1.2108 support will be the first sign of larger down trend resumption and would target 1.1946 low for confirmation. On the upside, above 1.2614 will bring another rise. In that case, we'd expect upside to be limited by 1.2705/2774 to bring down trend resumption eventually.
In the bigger picture, fall from 1.7190 is seen as part of the down trend from 2.1161. There is no sign of medium term reversal yet. Sustained trading below 61.8% projection of 2.1161 to 1.3503 from 1.7190 at 1.2457 will target 100% projection at 0.9532. Overall, break of 1.3444 resistance is needed to confirm medium term bottoming. Otherwise, outlook will remain bearish.
Canadian Dollar Subdued Ahead of US Crude Inventories
USD/CAD is showing little movement in the Wednesday session. Currently, the pair is trading at 1.3370. On the release front, it's another quiet day, with no Canadian events on the schedule. The key event in US is Pending Home Sales, which is expected to rebound with a gain of 2.3%. As well, the US releases Crude Oil Inventories, with the markets forecasting a gain of 1.5 millions barrels. On Thursday, the US releases Final GDP and unemployment claims.
Bank of Canada Governor Stephen Poloz was refreshingly candid in a speech on Tuesday in Oshawa. Poloz hinted that the BoC would not be raising interest rates in the near future, saying that the economy had not yet recovered from the huge drop in oil prices. He added that raising interests rates back to "normal" would have a negative effect on the economy and would likely trigger a recession. The last time the BoE raised rates was in 2010, and analysts don't forecast another hike before 2018. President Trump's "America first" stance is a serious concern for Canada, which is heavily reliant on open trade. Poloz criticized Trump's protectionist agenda, saying that "protectionism does not promote growth and its costs are steep".
President Donald Trump found himself on the wrong end of the rough-and tumble politics in Washington, as his bill to replace the Affordable Care Act was pulled before it even went to a vote. This was a humiliating setback for Trump, given that the Republicans enjoying a majority in Congress. The bruising defeat has sent the US dollar sharply lower and market jitters higher. Trump's administration has stumbled out of the starting gate, and after more than two months in office, he has yet to provide any details over even an outline of economic policy. The inquiry into the Trump administration's links with Russia is gathering steam, and is another cause for concern for nervous investors. Trump has said he will now focus on tax reform, but he has his work cut out, trying to convince a skeptical Congress and general public that he can deliver the goods and push his tax legislation through Congress.