Sample Category Title
USDJPY – Weekly Cloud Top Continues To Cap Recovery, Outlook Remains Negative
Initial basing signal came after repeated downside rejections at 110.00 support that left two consecutive long-tailed daily candled, but the pair so far failed to capitalize on this.
Recovery attempts were so far limited, with key near-term barrier at 111.36 (weekly cloud top / Fibo 23.6% of 115.49/110.09 fall) remaining intact.
This maintains downside risk for renewed attack at strong 110.00 zone (psychological support / 50% retracement of 101.17/118.65 rally), break of which would signal bearish continuation of the downleg from 115.49 (10 Mar high).
Firm bearish setup of daily studies favors scenario of selling on correction, with 111.36 marking strong barrier ahead of falling daily Tenkan-sen (111.78) expected to cap any stronger uptick.
Repeated close below weekly cloud top is needed to confirm strong bearish stance.
Res: 111.36, 111.56, 111.78, 112.15
Sup: 110.92, 110.60, 110.00, 109.50
Forex Technical Analysis
EUR/USD
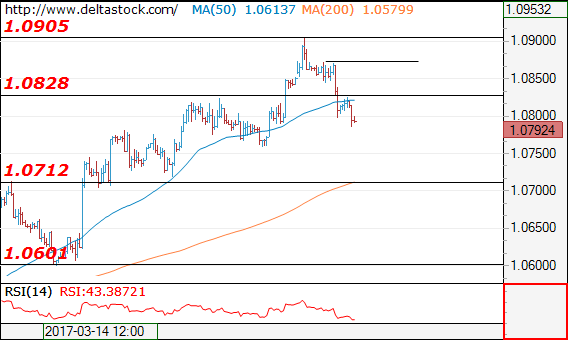
Current level - 10792
The outlook is bearish after the recent violation of 1.0828 support, for a slide towards 1.0700 area. Crucial on the upside is 1.0870 high.
| Resistance | Support | ||
| intraday | intraweek | intraday | intraweek |
| 1.0828 | 1.0945 | 1.0760 | 1.0710 |
| 1.0904 | 1.1010 | 1.0710 | 1.0600 |
USD/JPY
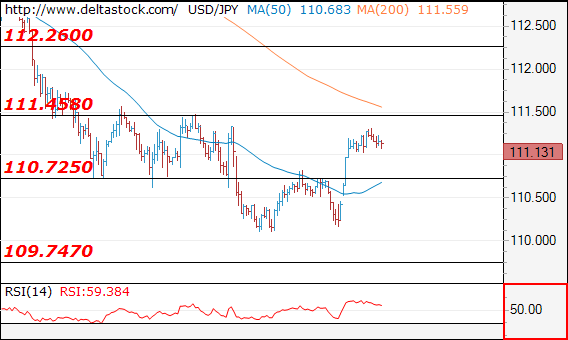
Current level - 111.13
The second attempt downwards failed as well and after the violation of 110.70 resistance, the bias is already positive, for a rise towards 112.26 zone. Initial static support is projected at 110.70.
| Resistance | Support | ||
| intraday | intraweek | intraday | intraweek |
| 111.45 | 113.50 | 110.70 | 109.75 |
| 112.26 | 115.65 | 110.10 | 107.80 |
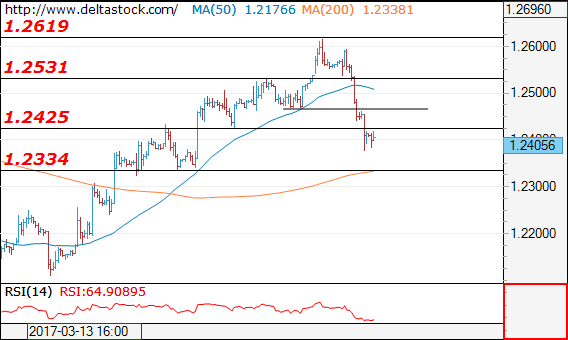
GBP/USD
Current level - 1.2405
Yesterday's break through 1.2530 support signals a reversal at 1.2619 and the outlook is bearish below 1.2470, for a slide towards 1.2335, en route to 1.2230.
| Resistance | Support | ||
| intraday | intraweek | intraday | intraweek |
| 1.2470 | 1.2619 | 1.2335 | 1.2107 |
| 1.2619 | 1.2705 | 1.2230 | 1.1984 |
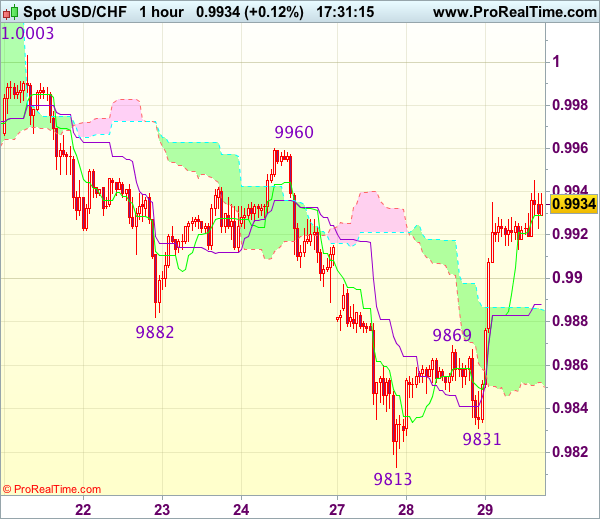
Trade Idea Update: USD/CHF – Stand aside
USD/CHF - 0.9936
Original strategy :
Exit short entered at 0.9910,
Position : - Short at 0.9910
Target : -
Stop : -
New strategy :
Stand aside
Position : -
Target : -
Stop : -
The greenback rallied after finding renewed buying interest at 0.9831 yesterday, dampening our bearishness and suggesting recent decline has ended at 0.9813, hence upside risk remains for this rise from 0.9813 to bring retracement of recent decline and further gain to resistance at 0.9960 would be seen but break there is needed to provide confirmation and retain bullishness for further rise towards another previous chart resistance at 1.0003 later.
In view of this, would be prudent to stand aside in the meantime. below the Kijun-Sen (now at 0.9888) would suggest an intra-day top is formed instead, bring weakness to the lower Kumo (now at 0.9851) but break of said support at 0.9831 is needed to revive bearishness for retest of 0.9813 first.
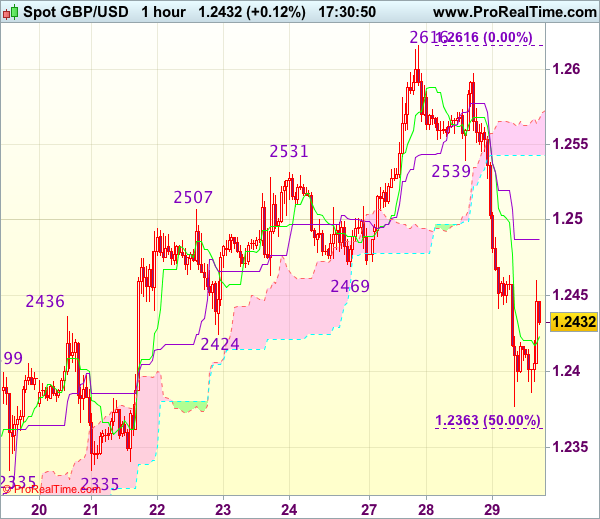
Trade Idea Update: GBP/USD – Sell at 1.2500
GBP/USD - 1.2431
Original strategy :
Sell at 1.2485, Target: 1.2365, Stop: 1.2520
Position : -
Target : -
Stop : -
New strategy :
Sell at 1.2500, Target: 1.2365, Stop: 1.2535
Position : -
Target : -
Stop : -
As cable has dropped sharply since yesterday, suggesting top has been formed at 1.2616 and the selloff from there is likely to bring retracement of recent upmove, hence further weakness to 1.2360-65 (50% Fibonacci retracement of 1.2109-1.2616) would be seen, however, loss of near term downward momentum should prevent sharp fall below 1.2335 support and reckon 1.2300-05 (61.8% Fibonacci retracement) would hold from here, bring rebound later.
In view of this, we are looking to turn short on recovery as the Kijun-Sen (now at 1.2486) should limit upside and bring decline. Above 1.2500-10 would defer but only break of previous support at 1.2539 would abort and signal the fall from 1.2616 has ended instead, bring rebound to 1.2560-65 first.
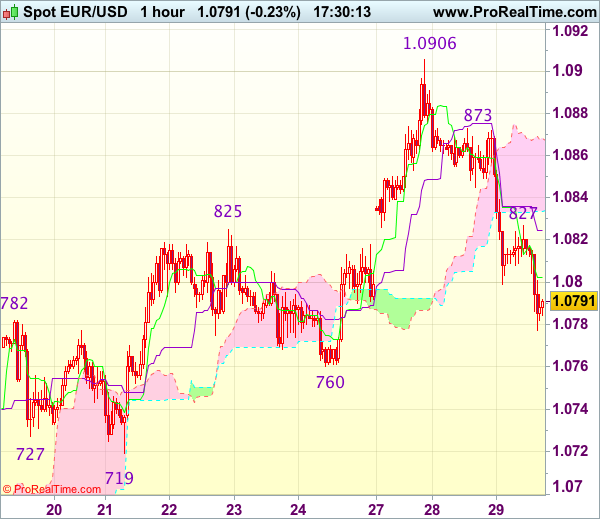
Trade Idea Update: EUR/USD – Hold long entered at 1.0800
EUR/USD - 1.0791
Original strategy :
Bought at 1.0800, Target: 1.0900, Stop: 1.0765
Position : - Long at 1.0800
Target : - 1.0900
Stop : - 1,0765
New strategy :
Hold long entered at 1.0800, Target: 1.0900, Stop: 1.0765
Position : - Long at 1.0800
Target : - 1.0900
Stop : - 1.0765
Although the single currency has remained under pressure after overnight selloff and near term downside risk remains for marginal weakness, as this move is viewed as retracement of recent upmove, reckon downside would be limited and bring rebound later, above 1.0825-30 would suggest and intra-day low is formed but break of 1.0845-50 is needed to add credence to this view, bring test of resistance at 1.0873 first. Only break of 1.0873 would signal the retreat from 1.0903 has ended, bring retest of this level, above there would extend recent rise to 1.0930-35 (61.8% Fibonacci retracement of 1.1300-1.0340) but loss of near term upward momentum should prevent sharp move beyond 1.0955-60 and price should falter below 1.0990-00.
In view of this, we are holding on to our long position entered at 1.0800. Only below support at 1.0760 would abort and signal top has been formed at 1.0906, bring retracement of recent upmove to 1.0730 but 1.0719 support should remain intact.
Article 50 Ready To Be Delivered
News and Events:
Brexit: Article 50 to be triggered today
Nine months after the Brexit vote, Theresa May will finally start the exit process by triggering Article 50 of the Lisbon Treaty. May will speak in front of the House of Commons at noon. A letter will then be delivered by 1.30pm to Donald Tusk. Negotiations should last at least two years but the UK will still benefit many bilateral agreements in the meanwhile.
The pound fell last night from 1.2460 to 1.2380 against the dollar. In our view, we believe that the markets are still overly pessimistic about the UK situation. Recent economic data is improving, but we also believe that the pound should appreciate in the medium-term. It is clear that economists widely missed the target with their doomsday prophecies and ironically, it is this very market pessimism that is supporting the UK economy by increasing the competitiveness of its exports.
Now that Brexit is officially a done deal, the next questions will revolve around the nature and tone of negotiations. 27 counterparts must accept and agree with the UK’s terms with each country holding a veto over these conditions. It is for this reason that it is so difficult for countries to renegotiate treaties in general. For this reason, we find the promise to renegotiate treaties somewhat scammy.
Pressure on oil builds
Despite the negative sentiment around oil, there are increasing indications of risk to the upside. Ian Roper Taylor CEO of Vito, the world’s largest private oil trader, has provided verbal support to OPEC production cuts. As the headlines hit, crude popped to $49, slightly above the short-term sideways channel top. In addition, Libya experienced supply disruption, which pulled approx. 140k bbl/day offline. All this comes on the back of reports that OPEC and non-OPEC nations are looking to extend oil production cuts by six months. December's 1.8m bbl / day cut has failed to meaningfully address the demand /supply equilibria (deal product cut is estimated at 94%) and other nations (notably USA) have seized the opportunity. Crude-front month climbed to $50 bbl but quickly retreated as US shales oil producers came online (forecasts for US crude production expected to reach a decade high). The failure of current product cuts has provided a wake-up call to OPEC. A draft statement indicated that nations are working closer to reach a solution to further lift prices. Markets have been focused on shale's low production cost and new product from Brazil and Canada, yet OPEC remains the dominant force.
The Risk Today:
EUR/USD has failed to hold above former resistance given at 1.0874 (08/12/2017 high). Hourly support is given at 1.0719 (21/03/2017 low). Stronger support can be found at 1.0493 (22/02/2017 low). Expected to show renewed bullish pressures. In the longer term, the death cross late October indicated a further bearish bias. The pair has broken key support given at 1.0458 (16/03/2015 low). Key resistance holds at 1.1714 (24/08/2015 high). Expected to head towards parity.
GBP/USD has exited short-term uptrend channel. We consider that there are still rooms for further strength. Hourly resistance is located at 1.2615 (27/03/2017 high). Hourly support is given at 1.2324 (03/17/2017 low). Expected to show continued strength towards resistance at 1.2771 (05/10/2016 high). The long-term technical pattern is even more negative since the Brexit vote has paved the way for further decline. Long-term support given at 1.0520 (01/03/85) represents a decent target. Long-term resistance is given at 1.5018 (24/06/2015) and would indicate a long-term reversal in the negative trend. Yet, it is very unlikely at the moment.
USD/JPY's bearish pressures are fadingHourly resistance can be located at 113.57 (16/03/2017 high) while support is given at 110.11 (27/03/2017 low). We favor a long-term bearish bias. Support is now given at 96.57 (10/08/2013 low). A gradual rise towards the major resistance at 135.15 (01/02/2002 high) seems absolutely unlikely. Expected to decline further support at 93.79 (13/06/2013 low).
USD/CHF is surging. Hourly support is given at 0.9814 (27/03/2017 low). Key resistance can be found at a distance at 1.0344 (15/12/2016 high). Expected to show continued weakness. In the long-term, the pair is still trading in range since 2011 despite some turmoil when the SNB unpegged the CHF. Key support can be found 0.8986 (30/01/2015 low). The technical structure favours nonetheless a long term bullish bias since the unpeg in January 2015.
| EURUSD | GBPUSD | USDCHF | USDJPY |
| 1.1300 | 1.3445 | 1.0652 | 121.69 |
| 1.0954 | 1.3121 | 1.0344 | 118.66 |
| 1.0906 | 1.2771 | 1.0171 | 115.62 |
| 1.0859 | 1.2589 | 0.9857 | 110.67 |
| 1.0494 | 1.1986 | 0.9550 | 106.57 |
| 1.0341 | 1.1841 | 0.9444 | 106.04 |
| 1.0000 | 1.0520 | 0.9259 | 101.20 |
Trade Idea Update: USD/JPY – Hold short entered at 111.20
USD/JPY - 111.05
Original strategy :
Sold at 111.20, Target: 110.20, Stop: 111.35
Position : - Short at 111.20
Target : - 110.20
Stop : - 111.35
New strategy :
Hold short entered at 111.20, Target: 110.20, Stop: 111.35
Position : - Short at 111.20
Target : - 110.20
Stop : - 111.35
Although dollar staged a strong rebound after holding above support at 110.11, as this move is still viewed as retracement of recent decline, reckon upside would be limited to 111.30-35 and bring retreat later, below the Kijun-Sen (now at 110.75) would bring weakness to 110.50 but only break of said support at 110.11 would confirm recent decline has resumed and extend weakness to 109.95-00 but loss of downward momentum should prevent sharp fall below 109.70-75 and reckon 109.50 would hold.
In view of this, we are holding on to our short position entered at 111.20, Only above 111.48-51 (previous resistance and 50% Fibonacci retracement of 112.90-110.11) would abort and signal low is formed, bring a stronger rebound to 111.80-85 first (61.8% Fibonacci retracement).

Gold Small Consolidation, Silver Consolidating Above $18, Crude Oil Renewed Bullish Pressures.
Gold Small consolidation.
Gold is getting stronger. The momentum seems back to bullish despite some consolidation. Strong resistance is located at 1263 (27/02/2017 high). Hourly support can be found at 1224.10 (16/03/2017 low). Expected to show further strengthening.
In the long-term, the technical structure suggests that there is a growing upside momentum. A break of 1392 (17/03/2014) is necessary ton confirm it, A major support can be found at 1045 (05/02/2010 low).
Silver Consolidating above $18.
Silver has increased above 18.00. Resistance given at 17.56 has been broken. Hourly support is given at 16.82 (15/03/2017 low).
In the long-term, the death cross indicates that further downsides are very likely. Resistance is located at 25.11 (28/08/2013 high). Strong support can be found at 11.75 (20/04/2009).
Crude oil Renewed bullish pressures.
Crude oil's bearish pressures seems to fade. The commodity had been located in a bearish trend since the commodity had been unable to mount a serious challenge to resistance at 55.24 (03/01/2017 high). Hourly support is given at 47.09 (016/03/2017 low).
In the long-term, crude oil has recovered after its sharp decline last year. However, we consider that further weakness are very likely. Strong support lies at 24.82 (13/11/2002) while resistance can now be found at 55.24 (03/01/2017 high).
EUR/CHF Temporary Bounce, EUR/JPY Pausing Around 120, EUR/GBP Bullish Breakout.
EUR/CHF Temporary bounce.
EUR/CHF's is moving up and down. The medium-term pattern suggests us to see continued bearish pressures towards key support that can be found at 1.0623 (24/06/2016 low).
In the longer term, the technical structure is mixed. Resistance can be found at 1.1200 (04/02/2015 high). Yet,the ECB's QE programme is likely to cause persistent selling pressures on the euro, which should weigh on EUR/CHF. Supports can be found at 1.0184 (28/01/2015 low) and 1.0082 (27/01/2015 low).
EUR/JPY Pausing around 120.
EUR/JPY rejection at 122.88 has triggered a correction. The pair is also very volatile. Hourly support can be found at 119.33 (23/03/2017 low). Resistance stands at 122.88 (13/03/0217 high). Expected to show continued weakness.
In the longer term, the technical structure validates a medium-term succession of lower highs and lower lows. As a result, the resistance at 149.78 (08/12/2014 high) has likely marked the end of the rise that started in July 2012. Strong support at 94.12 (24/07/2012 low) looks nonetheless far away.
EUR/GBP Bullish breakout.
EUR/GBP's bullish flag turned out to be true. The pair is now heading towards resistance at 0.8787 (13/03/2017 high). Key resistance is given at 0.8854 (15/01/2017 high). Hourly support can be found at 0.8605 (23/03/2017 low. Expected to show continued weakness.
In the long-term, the pair has largely recovered from recent lows in 2015. The technical structure suggests a growing upside momentum. The pair is trading above from its 200 DMA. Strong resistance can be found at 0.9500 psychological level.
USD/CHF Bouncing Back, USD/CAD Short-Term Strengthening, AUD/USD Bouncing.
USD/CHF Bouncing back.
USD/CHF is surging. Hourly support is given at 0.9814 (27/03/2017 low). Key resistance can be found at a distance at 1.0344 (15/12/2016 high). Expected to show continued weakness.
In the long-term, the pair is still trading in range since 2011 despite some turmoil when the SNB unpegged the CHF. Key support can be found 0.8986 (30/01/2015 low). The technical structure favours nonetheless a long term bullish bias since the unpeg in January 2015.
USD/CAD Short-term strengthening.
USD/CAD is pushing higher. A break of resistance area around 1.3400 is needed to invalidate the current short term bearish technical structure. The road seems still wideopen for larger decline. Key support is given at 1.2969 (31/01/2017 low).
In the longer term, there is a golden cross with the 50 dma crossing the 200 dma indicating further upside pressures. Strong resistance is given at 1.4690 (22/01/2016 high). Long-term support can be found at 1.2461 (16/03/2015 low).
AUD/USD Bouncing.
AUD/USD keeps on correcting lower since the pair has failed to test the key resistance at 0.7778 (08/11/2016 high). Expected to see some shortterm weakness towards support area around 0.7500.
In the long-term, we are waiting for further signs that the current downtrend is ending. Key supports stand at 0.6009 (31/10/2008 low) . A break of the key resistance at 0.8295 (15/01/2015 high) is needed to invalidate our long-term bearish view.