Sample Category Title
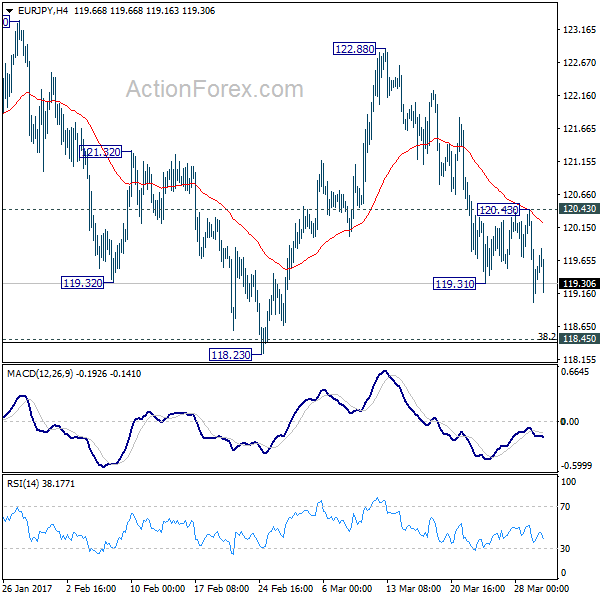
EUR/JPY Daily Outlook
Daily Pivots: (S1) 119.79; (P) 120.08; (R1) 120.48; More...
Intraday bias in EUR/JPY remains mildly on the downside as the fall from 122.88 should target 118.23 support. At this point, we're holding on to the view that price actions from 124.08 are forming a consolidation pattern. There, strong support is expected around 118.45 key cluster support level (38.2% retracement of 109.20 to 124.08 at 118.39) to contain downside and bring rebound. On the upside, above 120.43 minor resistance will turn bias back to the upside for 122.88 resistance.
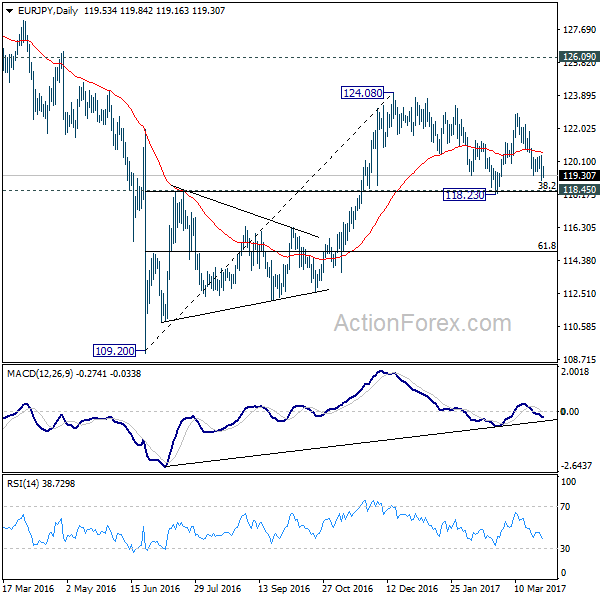
In the bigger picture, we're holding on to the view that medium term rise from 109.20 is still in progress. Focus is on 126.09 key resistance level. Sustained break will confirm completion of the whole decline from 149.76. And rise from 109.20 is of the same degree as the fall from 149.76. In such case, further rally would be seen to 104.04 resistance and possibly above before topping. Meanwhile, rejection from 126.09, or firm break of 118.45 cluster support, will likely extend the fall from 149.76 through 109.20 low.
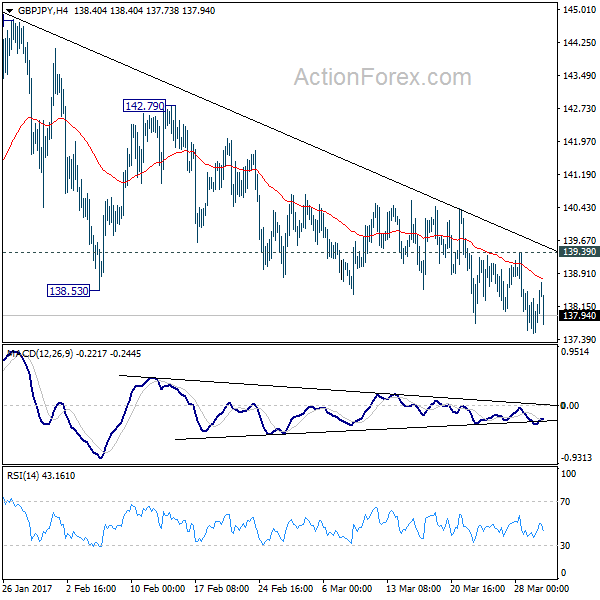
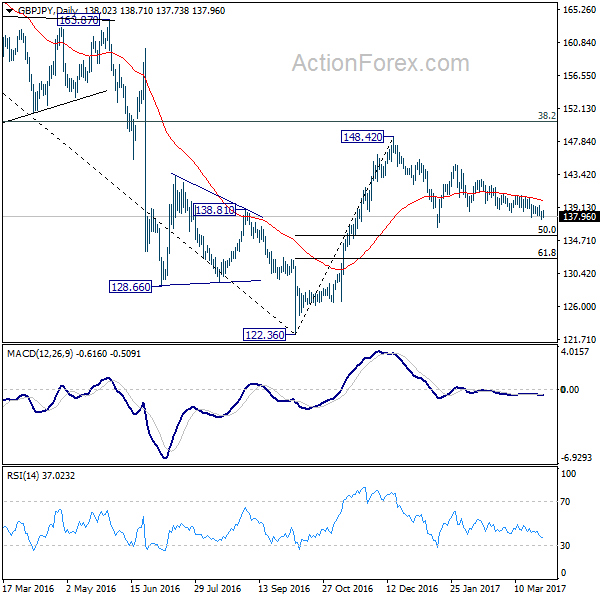
GBP/JPY Daily Outlook
Daily Pivots: (S1) 137.55; (P) 138.03; (R1) 138.54; More...
Intraday bias in GBP/JPY remains mildly on the downside for the moment. Choppy decline from 144.77 would target 136.44 support and below. But we'd expect support from 50% retracement of 122.36 to 148.42 at 135.39 to contain downside and bring rebound. On the upside, break of 139.39 minor resistance will turn bias to the upside and send GBP/JPY through 142.79 resistance. Overall, price actions from 148.42 are forming a consolidation pattern.
In the bigger picture, price actions from 122.36 medium term bottom are still seen as a corrective pattern. Main focus is on 38.2% retracement of 195.86 to 122.36 at 150.42. Rejection from there will turn the cross into medium term sideway pattern. Or, sustained break of 50% retracement of 122.36 to 148.42 at 135.39 will turn outlook bearish for a test on 122.36 low. Though, sustained break of 150.42 will extend the rebound towards 61.8% retracement of 195.86 to 122.36 at 167.78.
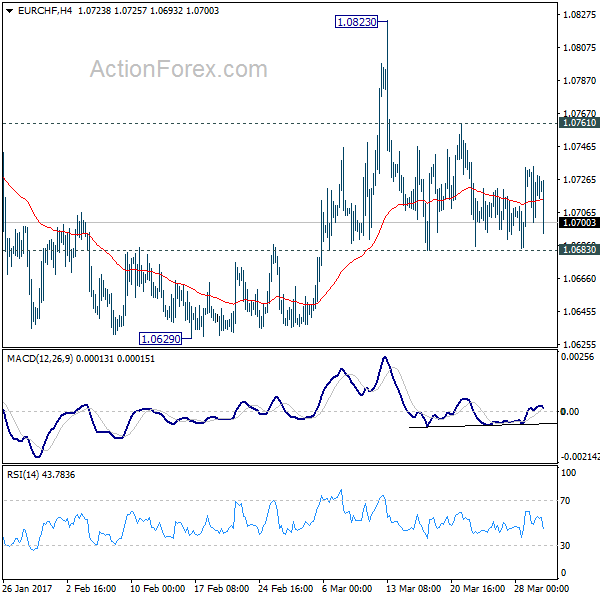
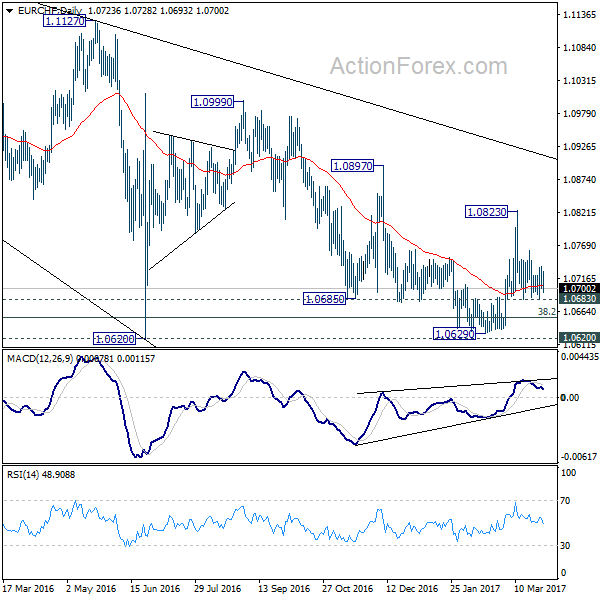
EUR/CHF Daily Outlook
Daily Pivots: (S1) 1.0706; (P) 1.0720; (R1) 1.0740; More...
EUR/CHF remains bounded in range of 1.0683/0761 and intraday bias remains neutral for the moment. We'd slightly favoring the case of trend reversal on bullish convergence condition in daily MACD. And, further rise is mildly in favor as long as 1.0683 minor support holds. Above 1.0761 minor resistance will turn bias to the upside for 1.0823 resistance first. Break will re-affirm the case of trend reversal and target 1.0897 resistance next. However, firm break of 1.0683 minor support will turn bias to the downside for 1.0620 key support level again.
In the bigger picture, the decline from 1.1198 is seen as a corrective move. Decisive break of 1.0897 resistance should confirm that it's completed. And in that case, larger up trend is resuming for another high above 1.1198. Meanwhile, sustained trading below 38.2% retracement of 0.9771 to 1.1198 at 1.0653 will target 50% retracement at 1.0485.
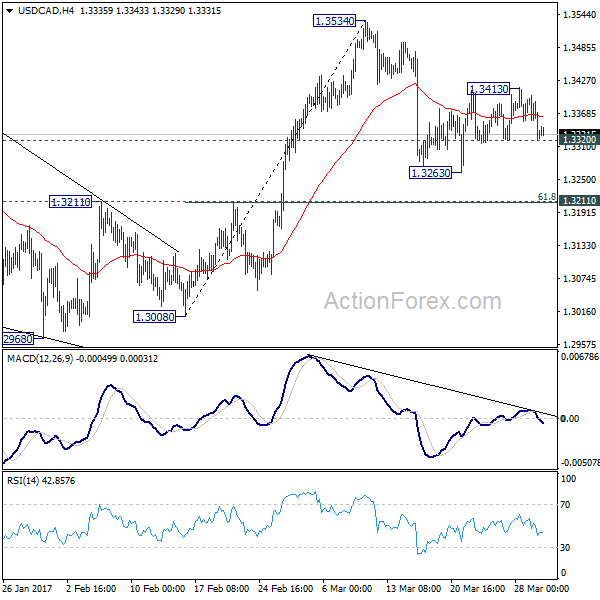
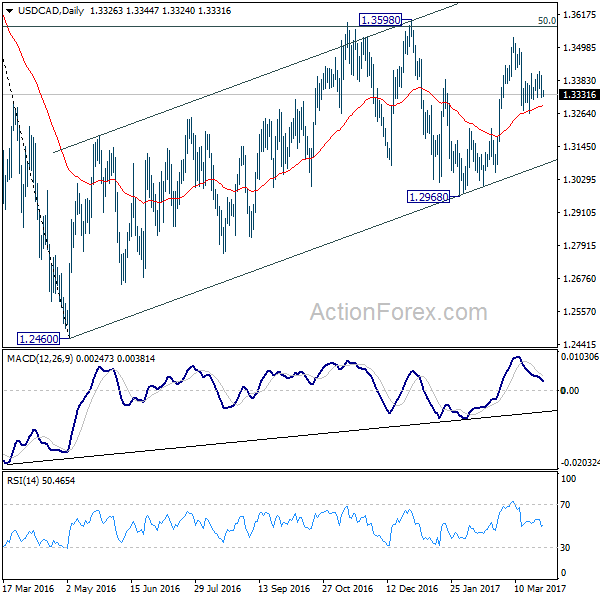
USD/CAD Daily Outlook
Daily Pivots: (S1) 1.3299; (P) 1.3349; (R1) 1.3378; More....
Intraday bias in USD/CAD is turned neutral as recovery lost moment after hitting 1.3413. On the downside, below 1.330 minor support will extend the corrective fall from 1.3534 through 1.3263. But in that case, we'd expect strong support from 1.3211 cluster level (61.8% retracement of 1.3008 to 1.3534 at 1.3209) to contain downside and bring rebound. On the upside, above 1.3413 will target a test on 1.3534 resistance first. Overall, rise from 1.2968 is expected to resume later to extend through the whole medium term rise from 1.2460 through 1.3598.
In the bigger picture, price actions from 1.4689 medium term top are seen as a correction pattern. The first leg has completed at 1.2460. The second leg is likely still in progress and could target 61.8% retracement of 1.4689 to 1.2460 at 1.3838. We'd look for reversal signal there to start the third leg. Break of 1.2968 wold at least bring at retest of 1.2460 low. However, sustained trading above 1.3838 would pave the way to retest 1.4689 high.
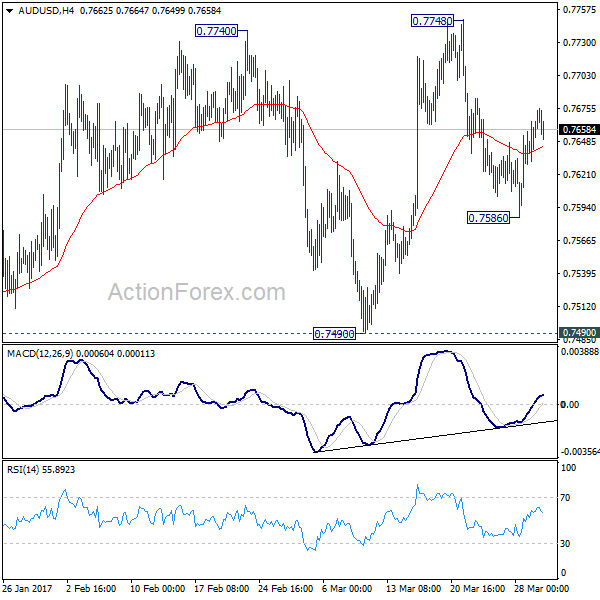
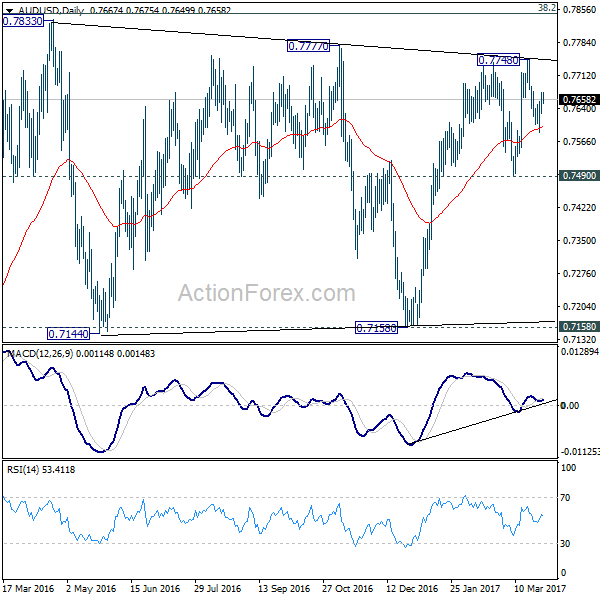
AUD/USD Daily Outlook
Daily Pivots: (S1) 0.7640; (P) 0.7657; (R1) 0.7685; More...
Intraday bias in AUD/USD remains neutral at this point. On the upside, break of 0.7748 will extend the rally from 0.7158. In that case, we'd expect strong resistance from long term retracement level at 0.7849 to limit upside. On the downside, below 0.7586 will turn bias back to the downside for 0.7490 support. Firm break there will confirm completion of rise from 0.7158. In such case, near term outlook will be turned bearish for 0.7158 support next.
In the bigger picture, we're still treating price actions from 0.6826 low as a correction. And, as long as 38.2% retracement of 0.9504 to 0.6826 at 0.7849 holds, long term down trend from 1.1079 is expected to resume sooner or later. Break of 0.6826 low will target 0.6008 key support level. However, firm break of 0.7849 will indicate that rise from 0.6826 is developing into a medium term rebound, rather than a sideway pattern. In such case, stronger rise should be seen to 55 month EMA (now at 0.8169) and above.
USD Firms Ahead Of Q4 GDP Final Reading
The dollar index has rebounded noticeably from a 4-and-a-half-month low of 98.85, helped by outperforming US consumer confidence for March, and recent Fed comments. This morning, the dollar index rallies and touches a 1-week high of 100.02, . Today, at 13:30 BST, sees the release of US Q4 GDP final reading and Q4 PCE inflation figures for March; with better-than-expected readings it is likely to provide further support to USD. However, per the first and second Q4 GDP annualized readings: a 1.9% growth, showing a slowdown comparing to a 3.5% growth in Q3.
OPEC is considering whether to extend the oil output cut for another 6 months to lift weak oil prices. The decision will likely be made in their scheduled meeting on May 25 in Vienna. In addition, the EIA crude oil inventories (the week ending March 24) dropped to 0.867 million barrels; less than expectations of 1.183 m and the previous figure of 4.954. These two factors cushioned oil prices creating a noticeable bounce off on Wednesday.
Britain's ambassador to the EU, Tim Barrow, handed over the Brexit triggering notification letter, signed by the UK Prime Minister Theresa May, to the EU Council President, Donald Tusk, in Brussels. Tusk is expected to present draft Brexit guidelines to the European Union's remaining 27 member states by this Friday. A withdraw agreement must be accepted by 72% out of the 27 states, representing 65% of the population.
Member states are expected to hold a Brexit summit on April 29. The Guardian reports (per a leaked copy of the European Parliament draft resolution) that the EU appears to be taking a strong position aka. “a hard Brexit”. It will likely result in no free trade agreements between the UK and the EU over the next two years, with a transition period of no longer than 3 years. The draft resolution is likely to be discussed next week.
Theresa May now faces a severe challenge: dealing with a prospective hard Brexit negotiation with the EU, at the same time, maintaining the UK territory from falling apart with the threat of Scotland's independence attempt.
The Eurozone economic sentiment, business climate and consumer confidence (Mar) will be released at 10:00 BST today, followed by German CPI (Mar) at 13:00 BST, accompanied by the US Q4 GDP final readings and US Q4 PCE.
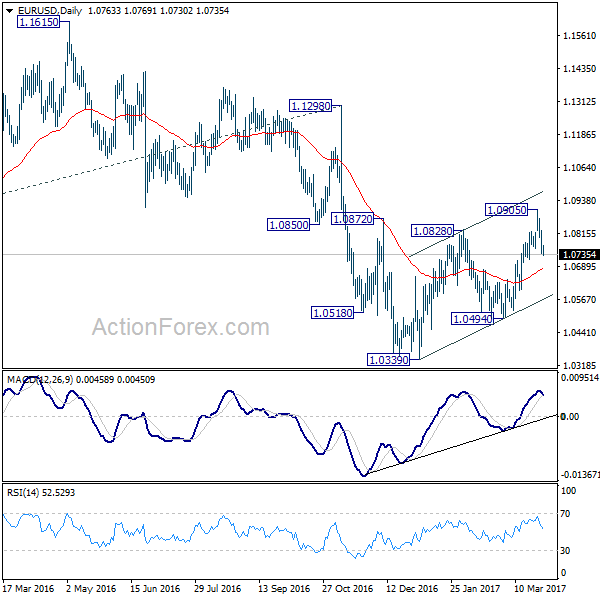
EUR/USD Daily Outlook
Daily Pivots: (S1) 1.0727; (P) 1.0777 (R1) 1.0814; More.....
Intraday bias in EUR/USD remains on the downside for the moment. As noted before, rise from 1.0494 should have completed at 1.0905 on bearish divergence condition in 4 hour MACD. The whole corrective rise from 1.0339 is possibly finished too. Deeper fall should be seen back to 55 day EMA (now at 1.0682) first. Sustained break there will affirm this view and target 1.0494 resistance for confirmation. On the upside, above 1.0826 minor resistance will indicate that the corrective rise from 1.0339 is still in progress. Intraday bias would then be flipped back to the upside for 1.0905 and above.
In the bigger picture, as long as 1.1298 key resistance holds, whole down trend from 1.6039 (2008 high) is still expected to continue. Break of 1.0339 low will send EUR/USD through parity to 61.8% projection of 1.3993 to 1.0461 from 1.1298 at 0.9115. However, considering bullish convergence condition in weekly MACD, break of 1.1298 will indicate term reversal. this would also be supported by sustained trading above 55 week EMA.
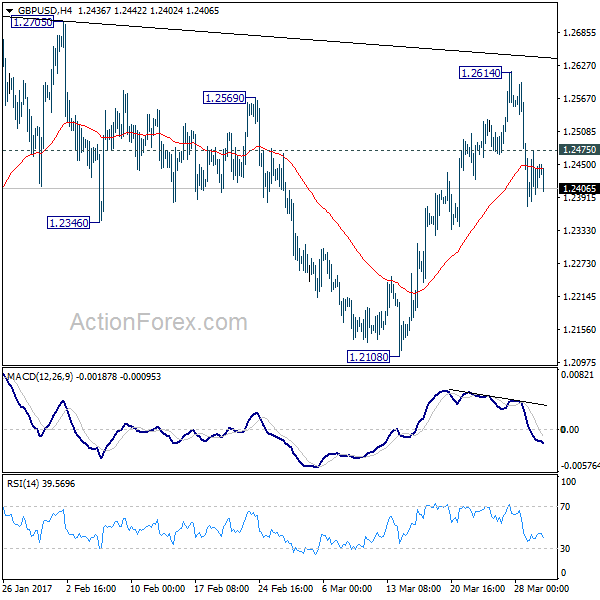
GBP/USD Daily Outlook
Daily Pivots: (S1) 1.2381; (P) 1.2428; (R1) 1.2482; More...
Intraday bias in GBP/USD remains on the downside for the moment. Rebound from 1.2108 should have completed at 1.2614 already. Deeper fall should be seen back to 1.2108 support. As noted before, price actions from 1.1946 are viewed as a consolidation pattern pattern. Break of 1.2108 support will be the first sign of larger down trend resumption and would target 1.1946 low for confirmation. On the upside, above 1.2475 minor resistance will turn bias back to the upside for 1.2614 resistance instead.
In the bigger picture, fall from 1.7190 is seen as part of the down trend from 2.1161. There is no sign of medium term reversal yet. Sustained trading below 61.8% projection of 2.1161 to 1.3503 from 1.7190 at 1.2457 will target 100% projection at 0.9532. Overall, break of 1.3444 resistance is needed to confirm medium term bottoming. Otherwise, outlook will remain bearish.
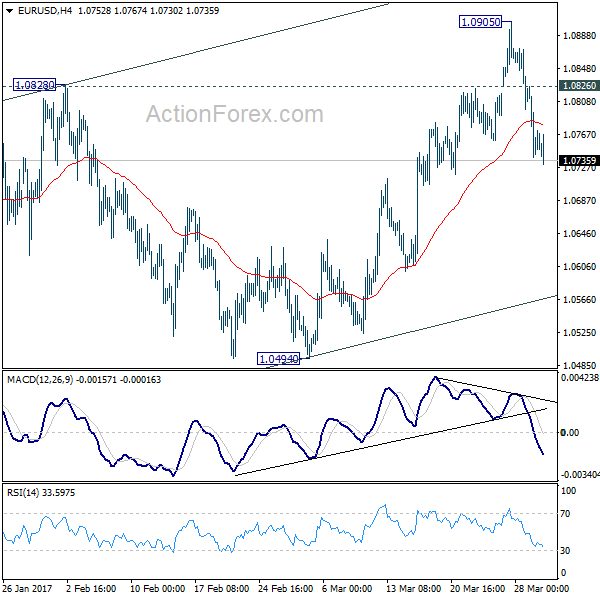
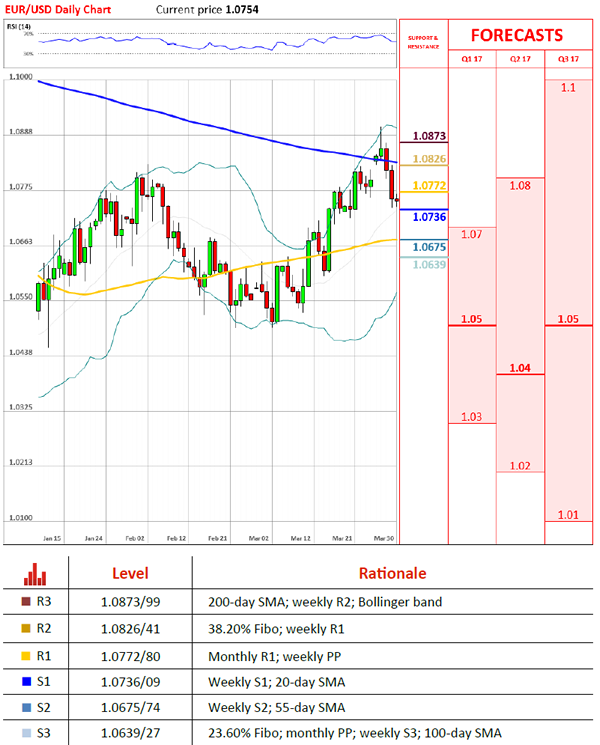
EUR/USD Reaches Below 1.0750 Mark
'The euro fell the most in five weeks on a report that European Central Bank officials are wary of changing their dovish message and after the U.K. set in motion the first withdrawal of a country from the European Union.' – Lananh Nguyen and Vincent Cignarella, Bloomberg
Pair's Outlook
On Thursday morning the common European currency traded against the US Dollar near the 1.0750 level, as it was fluctuating between two levels of significance. The rate reached this level due to fundamental events like dovish ECB monetary policy signals and the triggering of Article 50 by the UK. From the upside the currency exchange rate is facing the combined resistance of the monthly R1 at 1.0772 and weekly PP at the 1.0780 mark. Meanwhile, immediate support to the pair was provided by the weekly S1 at 1.0736. It is likely that the rate will continue to move lower in the near future, as that is the medium term direction set by the rebound from the long term resistance line.
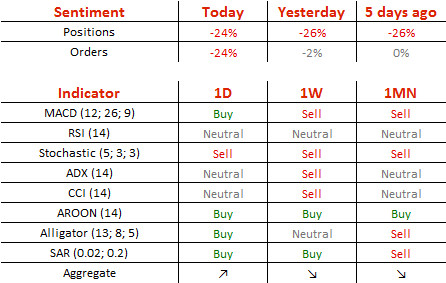
Traders' Sentiment
SWFX traders remain bearish, as 62% of open positions are short and 62% of trader set up orders are to sell.
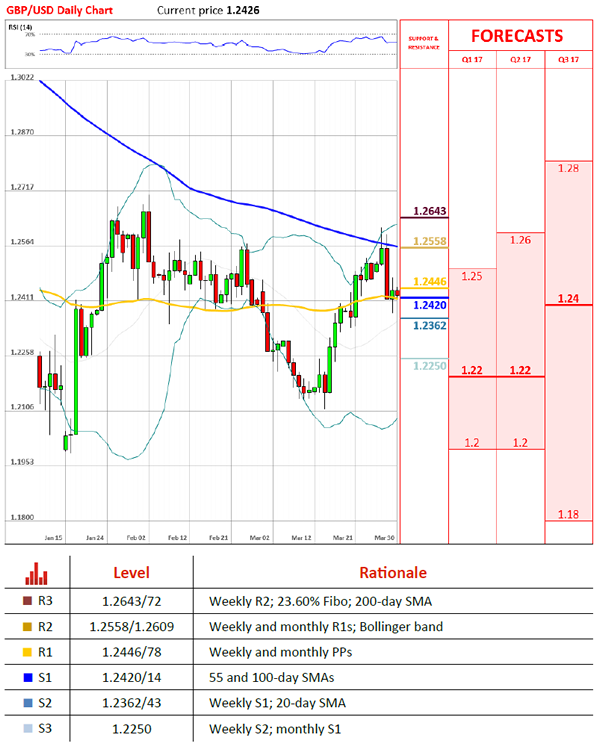
GBP/USD Risks Falling Under 1.24
'Given the positioning, our bias would still be toward a stronger pound over the coming weeks.' – MUFG (based on Business Recorder)
Pair's Outlook
The GBP/USD currency pair managed to avoid serious losses on Wednesday, as the weekly PP, the 55 and the 100-day SMAs provided sufficient support. The Cable remains on the back foot, but the immediate demand cluster could still keep the exchange rate above the 1.24 mark today. Technical studies in the daily timeframe support this outlook, but given the latest developments, more downside is expected. On the other hand, from the technical perspective there might soon be a relatively strong purchase signal, which implies the Pound could strengthen against the Buck and erase all this week's losses.
Traders' Sentiment
There are 59% of traders holding long positions today (previously 57%). At the same time, the share of sell orders inched up from 55 to 56%.