Sample Category Title
USD/CHF Riding Again Towards Parity, USD/CAD Demand Is Fading, AUD/USD Bouncing.
USD/CHF Riding again towards parity.
USD/CHF is strengthening. Hourly support is given at 0.9814 (27/03/2017 low). Key resistance can be found at a distance at 1.0344 (15/12/2016 high). Expected to show further consolidating below parity.
In the long-term, the pair is still trading in range since 2011 despite some turmoil when the SNB unpegged the CHF. Key support can be found 0.8986 (30/01/2015 low). The technical structure favours nonetheless a long term bullish bias since the unpeg in January 2015.
USD/CAD Demand is fading.
USD/CAD is struggling to go any higher. A break of resistance area around 1.3400 is needed to invalidate the current short term bearish technical structure. The road seems still wideopen for larger decline. Key support is given at 1.2969 (31/01/2017 low).
In the longer term, there is a golden cross with the 50 dma crossing the 200 dma indicating further upside pressures. Strong resistance is given at 1.4690 (22/01/2016 high). Long-term support can be found at 1.2461 (16/03/2015 low).
AUD/USD Bouncing.
AUD/USD is moving higher. The pair has failed to test the key resistance at 0.7778 (08/11/2016 high). Expected to see some short-term weakness towards support area around 0.7500.
In the long-term, we are waiting for further signs that the current downtrend is ending. Key supports stand at 0.6009 (31/10/2008 low) . A break of the key resistance at 0.8295 (15/01/2015 high) is needed to invalidate our long-term bearish view.
USD/CAD Elliott Wave Analysis
USD/CAD – 1.3343
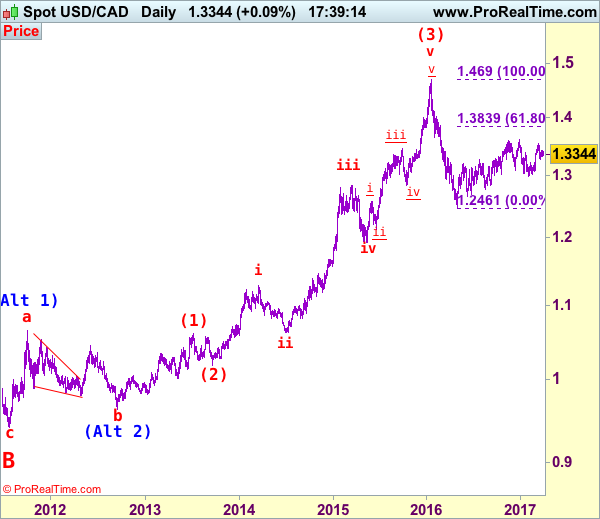
USD/CAD – Wave v ended at 0.9407 and a-b-c correction may extend gain to 1.4700
As the greenback met resistance at 1.3415 and has retreated, consolidation with mild downside bias is seen for weakness to 1.3300 but break of support at 1.3264 is needed to add credence to our view that a temporary top has been formed at 1.3535 earlier this month, bring correction of recent upmove to previous resistance at 1.3210-12 (now support). Only below this level would suggest the rebound from 1.2969 has ended and prolong choppy trading, bring weakness to 1.3100 but downside should be limited to 1.3056 support, bring rebound later.
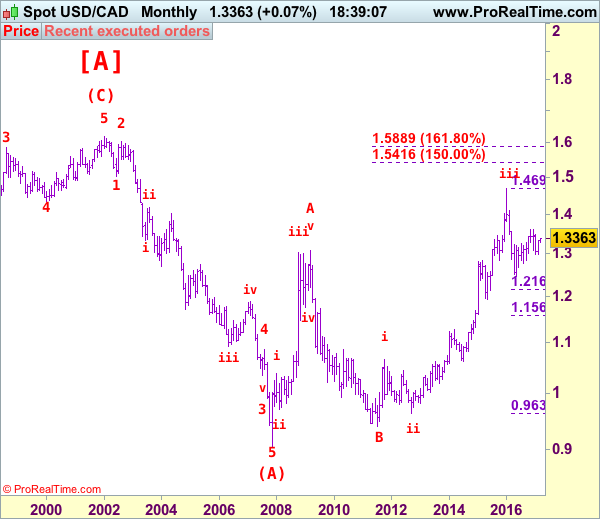
We are keeping our view that the wave b from 1.0657 (a leg top) has possibly ended at 0.9633 with (a): 0.9800, wave (b): 1.0447 and wave c at 0.9633, the subsequent rise from there is now treated as wave c exceeded indicated upside target at 1.3770-80 and 1.4000 and wave (3) has possibly ended at 1.4690 and wave (4) correction has commenced for retracement back to 1.2832 support, then 1.2410-20.
On the daily chart, our latest preferred count remains that the A of (B) rally from 0.9059 low (7 Nov 2007) unfolded into an impulsive wave with i: 0.9059-1.0380, ii ended at 0.9819, iii at 1.3019 followed by triangle wave iv at 1.2026 , then wave v formed a top at 1.3066 and also ended the wave A. The wave B is unfolding as an double three a-b-c-x-a-b-c and is sub-divided as a: 1.2192, b: 1.2716 and wave c at 1.0784, followed by wave x at 1.1725, another set of a-b-c unfolded with 2nd a at 0.9931, 2nd b at 1.0674. the 2nd c has possibly ended at 0.9407, therefore, consolidation with upside bias is seen for major correction, indicated target at 1.3900 had been met and gain to 1.4700 would follow.
On the upside, expect recovery to be limited to 1.3390-00 and bring another decline. Above 1.3425-30 would suggest the retreat from 1.3535 has possibly ended, bring a stronger rebound to 1.3500, then retest of 1.3535. A break of this resistance would revive bullishness and signal the rise from 1.2969 is still in progress for retest of 1.3599 top, once this level is penetrated, this would confirm the erratic rise from 1.2461 low has resumed for a stronger correction of early decline from 1.4690 (2016 high) to 1.3700 and later towards 1.3790-00, however, reckon upside would be limited to 1.3835-40 (61.8% Fibonacci retracement of 1.4690-1.2461) and bring retreat later.
Recommendation: Sell at 1.3390 for 1.3190 with stop above 1.3490.
Longer term - The selloff from 1.6194 (21 Jan 2002) to 0.9059 (07 Nov 2007) is viewed as (A) wave which is a 5-waver as labeled on the monthly chart as below, the subsequently rally is labeled as (B) with impulsive A leg of (B) ended at 1.3066, wave B of (B) is unfolding which has either ended at 0.9407 or would extend one more fall but downside should be limited to 0.9200 and 0.9000 should hold.
EURUSD May See More Weakness
We have seen some nice dollar gains in the last few sessions against some major currencies, such as EUR, GBP; CHF and JPY, but not against commodity currencies. So if you are looking at Dollar Index price chart and want to be involved in long dollar trade, then I would say to avoid commodity pairs at the moment as these are not calculated in DX quote; well only CAD is but for 9.1%, while EUR has 57.6% weight. We also see commodity markets moving in-line with higher stocks, which is another reason why commodity currencies are doing quote well compared to EUR, GBP, JPY and CHF.
That said, if DX is headed higher then my eyes should be on EUR/USD and positively correlated pairs. I like the structure on euro at the moment, because of clear five wave fall from 1.0905; an impulse that can see a reversal now in three waves. I will normally wait on prices to retrace at least 38.2% before I may look for a resumption of a downtrend. So first resistance is seen near 1.0800, while second and maybe more important one is at 1.0825.
EURUSD, 1H
EUR/USD Continued Weakness, GBP/USD Consolidating On Support Area At 1.24, USD/JPY Moving Sideways.
EUR/USD Continued weakness.
EUR/USD is getting lower. The pair has failed to hold above former resistance given at 1.0874 (08/12/2017 high). Hourly support is given at 1.0719 (21/03/2017 low). Stronger support can be found at 1.0493 (22/02/2017 low). The short-term technical structure indicates further weakness..
In the longer term, the death cross late October indicated a further bearish bias. The pair has broken key support given at 1.0458 (16/03/2015 low). Key resistance holds at 1.1714 (24/08/2015 high). Expected to head towards parity.
GBP/USD Consolidating on support area at 1.24.
GBP/USD has exited short-term uptrend channel. Hourly resistance is located at 1.2615 (27/03/2017 high). Hourly support is given at 1.2324 (03/17/2017 low). Expected to show renewed strengthening towards resistance at 1.2771 (05/10/2016 high).
The long-term technical pattern is even more negative since the Brexit vote has paved the way for further decline. Long-term support given at 1.0520 (01/03/85) represents a decent target. Long-term resistance is given at 1.5018 (24/06/2015) and would indicate a long-term reversal in the negative trend. Yet, it is very unlikely at the moment.
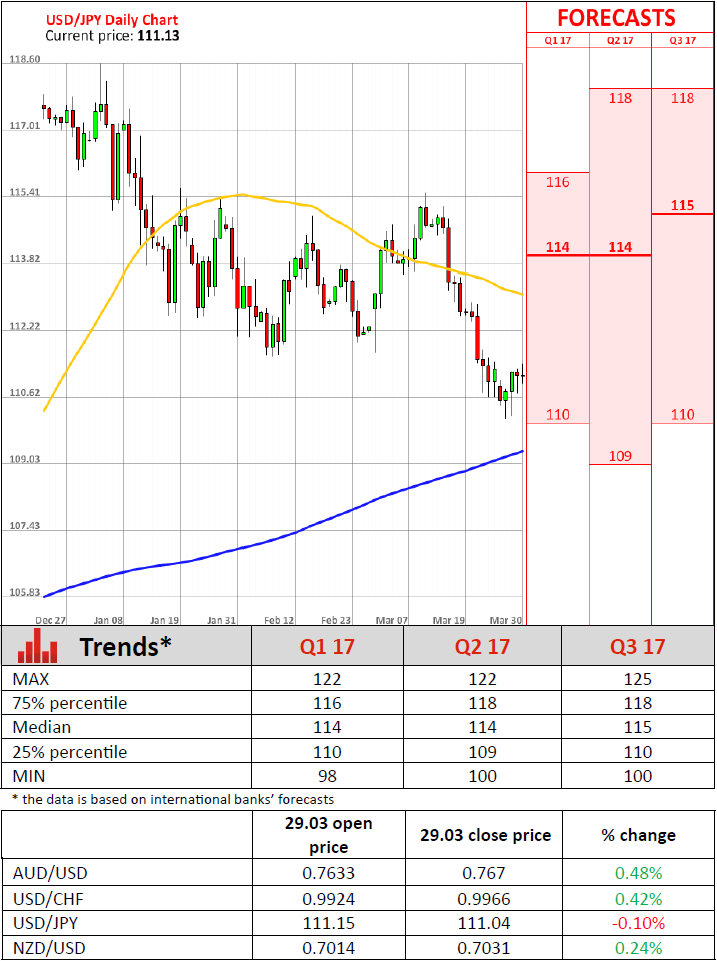
USD/JPY Moving sideways.
USD/JPY's bearish pressures are fading. Hourly resistance can be located at 113.57 (16/03/2017 high) while support is given at 110.11 (27/03/2017 low).
We favor a long-term bearish bias. Support is now given at 96.57 (10/08/2013 low). A gradual rise towards the major resistance at 135.15 (01/02/2002 high) seems absolutely unlikely. Expected to decline further support at 93.79 (13/06/2013 low).
US Existing Home Sales Rally In February, Сrude Oil Inventories Rise But Less Than Estimated
'The good news is that warm winter weather has led to a surge in construction that will hopefully result in a bloom of new homes for sale this spring.' - Joseph Kirchner, realtor.com
Pending home sales increased substantially and, thus, surprised many experts, who did not expect such a leap. In February, the Pending Home Sales Index spiked 5.5% and reached the highest level in almost a year and the second highest level in over a decade. Growth was partially attributable to a record-warm end of winter, which motivated people to start looking for a house more actively than usual. Another factor that boosted sales was households' concern over a possible rise of interest rates by the end of this year. However, the main reason behind increased sales was strong demand, which was driven by improving economic conditions in the US. Yet, many potential home-buyers faced the problem of supply shortages, which negatively impacted prices, especially in the lower- and mid-market price ranges.
Other data released on Wednesday revealed that US crude oil inventories rose 900,000 barrels last week, following the preceding week's gain of 5 million barrels. Meanwhile, analysts anticipated a climb of 1.2 million barrels during the reported week. Oil prices rose shortly after the release, with WTI jumping above $49 per barrel. Data suggests that the OPEC production deal cut has finally started bearing fruits.
Brazil’s Government Caps Spending, UK Triggers Brexit
News and Events:
Brazilian government caps spending (by Arnaud Masset)
In spite of rising global uncertainty, emerging market currencies have been rather resilient over the last couple of weeks. However, one has to acknowledge that volatility also increased temporarily as investors preferred to remain cautious in the event that Donal Trump had to face another setback in implementing his programme. After completely erasing losses from last November and returning to around 3.05 in February, the Brazilian real has been trading in a volatile range since then, moving between 3.06 and 3.20 as investors await further clarity on the US outlook to emerge.
It goes without saying that local developments in EM countries have been largely ignored recently - with the exception of the political turmoil in South Africa earlier this week - as market participants were too busy trying to anticipate Trump’s next move. A fresh batch of economic data from Brazil is due for release later today. January retail sales are expected to come in at -4.3%y/y (versus -4.9% in December) or +0.5%m/m (versus -2% in the previous month). The Brazilian economy is slowly gearing up as the central bank progressively eases its monetary policy. The Selic rate is currently at 12.25% but the market anticipates the benchmark rate to reach 9% by the end of the year as inflation is expected to return within the BCB’s target range of 4.5% +/-1.5%. All in all, looking at the hard data it seems as though Brazil is on the right track, however on the domestic side, the political situation is in complete upheaval and the uncertainty that stems from it should prevent the real from returning quickly towards its pre-recession levels. Moreover, the austerity measures planned by the government will further delay a speedy recovery. Nevertheless, it is a necessary evil to restore confidence and attract foreign investments. Short-term BRL gains cannot be ruled out as investors are still chasing returns and Brazil’s temporary stability is quite attractive.
UK: The exit process has finally begun (by Yann Quelenn)
Since yesterday’s triggering of Article 50, the Footsie 100 has risen and is now trading 16% higher than pre-Brexit levels.
While the Brexit vote last year triggered a sell-off, we believe that there will not be a hard Brexit. However, it is clear that negotiations will be tough with all members having to agree on the final deal, which means that the next two years will be a serious rollercoaster ride.
We believe that the pound will further appreciate this year. Losing 20% in the wake of the referendum vote, the weaker sterling has provided the UK with a strong exports boost. Strengthening of the pound is now very likely especially as Europe faces a veritable minefield with the upcoming French and German elections. Time to reload GBP.
Today's Key Issues (time in GMT):
- Mar Economic Confidence, last 91,5 TRY / 07:00
- Mar KOF Leading Indicator, exp 105,8, last 107,2, rev 106,9 CHF / 07:00
- Mar P CPI MoM, exp 0,20%, last -0,40% EUR / 07:00
- Mar P CPI YoY, exp 2,60%, last 3,00% EUR / 07:00
- Mar P CPI EU Harmonised MoM, exp 1,50%, last -0,30% EUR / 07:00
- Mar P CPI EU Harmonised YoY, exp 2,70%, last 3,00% EUR / 07:00
- Feb Foreign Tourist Arrivals YoY, exp -13,40%, last -9,80% TRY / 08:00
- Bank of Finland Governor Liikanen Briefing on Monetary Policy EUR / 08:00
- Mar Economic Confidence, exp 108,3, last 108 EUR / 09:00
- Mar Business Climate Indicator, exp 0,87, last 0,82 EUR / 09:00
- Mar Industrial Confidence, exp 1,4, last 1,3 EUR / 09:00
- Mar Services Confidence, exp 14, last 13,8 EUR / 09:00
- Mar F Consumer Confidence, exp -5, last -5 EUR / 09:00
- ECB's Nowotny Speaks at Austrian central bank presser EUR / 09:15
- Feb PPI MoM, exp 0,50%, last 0,40% ZAR / 09:30
- Feb PPI YoY, exp 5,60%, last 5,90% ZAR / 09:30
- ECB Executive Board member Praet speaks in Berlin EUR / 10:00
- Mar FGV Inflation IGPM MoM, exp 0,05%, last 0,08% BRL / 11:00
- Mar FGV Inflation IGPM YoY, exp 4,88%, last 5,38% BRL / 11:00
- Feb Electricity Consumption YoY, last -0,60% ZAR / 11:00
- Feb Electricity Production YoY, last 0,80% ZAR / 11:00
- Central Bank Q1 Inflation Report BRL / 11:00
- Dutch Central Bank to Publish Annual Report EUR / 11:00
- mars.24 Foreigners Net Bond Invest, last $10m TRY / 11:30
- mars.24 Foreigners Net Stock Invest, last $44m TRY / 11:30
- Jan Economic Activity MoM, exp -0,10%, last -0,26% BRL / 11:30
- Jan Economic Activity YoY, exp -0,20%, last -1,82% BRL / 11:30
- Feb South Africa Budget, last -38.7b ZAR / 12:00
- Jan Retail Sales YoY, exp -4,30%, last -4,90% BRL / 12:00
- Jan Retail Sales MoM, exp 0,50%, last -2,00% BRL / 12:00
- Jan Retail Sales Broad YoY, exp -5,90%, last -6,70% BRL / 12:00
- Jan Retail Sales Broad MoM, exp -0,90%, last -0,10% BRL / 12:00
- Mar P CPI MoM, exp 0,40%, last 0,60% EUR / 12:00
- Mar P CPI YoY, exp 1,80%, last 2,20% EUR / 12:00
- Mar P CPI EU Harmonized MoM, exp 0,50%, last 0,70% EUR / 12:00
- Mar P CPI EU Harmonized YoY, exp 1,90%, last 2,20% EUR / 12:00
- 4Q T GDP Annualized QoQ, exp 2,00%, last 1,90% USD / 12:30
- 4Q T Personal Consumption, exp 3,00%, last 3,00% USD / 12:30
- 4Q T GDP Price Index, exp 2,00%, last 2,00% USD / 12:30
- Feb Industrial Product Price MoM, exp 0,40%, last 0,40% CAD / 12:30
- 4Q T Core PCE QoQ, exp 1,20%, last 1,20% USD / 12:30
- Feb Raw Materials Price Index MoM, exp 0,90%, last 1,70% CAD / 12:30
- mars.25 Initial Jobless Claims, exp 247k, last 261k USD / 12:30
- mars.18 Continuing Claims, exp 2031k, last 1990k USD / 12:30
- mars.24 Gold and Forex Reserve, last 395.7b RUB / 13:00
- Finance Minister Padoan, Bank of Italy Governor at Event EUR / 13:00
- Fed's Mester Speaks in Chicago on Payment System Improvement USD / 13:45
- mars.26 Bloomberg Consumer Comfort, last 51,3 USD / 13:45
- Dallas Fed's Kaplan Speaks in Washington USD / 15:00
- Fed's Williams Speaks at Learning Community Event in New York USD / 15:15
- Feb Central Govt Budget Balance, exp -21.6b, last 19.0b BRL / 18:00
- Fed's Dudley Speaks in Sarasota USD / 20:30
- Feb Building Permits MoM, last 0,80% NZD / 21:45
The Risk Today:
EUR/USD is getting lower. The pair has failed to hold above former resistance given at 1.0874 (08/12/2017 high). Hourly support is given at 1.0719 (21/03/2017 low). Stronger support can be found at 1.0493 (22/02/2017 low). The short-term technical structure indicates further weakness.. In the longer term, the death cross late October indicated a further bearish bias. The pair has broken key support given at 1.0458 (16/03/2015 low). Key resistance holds at 1.1714 (24/08/2015 high). Expected to head towards parity.
GBP/USD has exited short-term uptrend channel. Hourly resistance is located at 1.2615 (27/03/2017 high). Hourly support is given at 1.2324 (03/17/2017 low). Expected to show renewed strengthening towards resistance at 1.2771 (05/10/2016 high). The long-term technical pattern is even more negative since the Brexit vote has paved the way for further decline. Long-term support given at 1.0520 (01/03/85) represents a decent target. Long-term resistance is given at 1.5018 (24/06/2015) and would indicate a long-term reversal in the negative trend. Yet, it is very unlikely at the moment.
USD/JPY's bearish pressures are fading. Hourly resistance can be located at 113.57 (16/03/2017 high) while support is given at 110.11 (27/03/2017 low). We favor a long-term bearish bias. Support is now given at 96.57 (10/08/2013 low). A gradual rise towards the major resistance at 135.15 (01/02/2002 high) seems absolutely unlikely. Expected to decline further support at 93.79 (13/06/2013 low).
USD/CHF is strengthening. Hourly support is given at 0.9814 (27/03/2017 low). Key resistance can be found at a distance at 1.0344 (15/12/2016 high). Expected to show further consolidating below parity. In the long-term, the pair is still trading in range since 2011 despite some turmoil when the SNB unpegged the CHF. Key support can be found 0.8986 (30/01/2015 low). The technical structure favours nonetheless a long term bullish bias since the unpeg in January 2015.
| EURUSD | GBPUSD | USDCHF | USDJPY |
| 1.1300 | 1.3445 | 1.0652 | 121.69 |
| 1.0954 | 1.3121 | 1.0344 | 118.66 |
| 1.0906 | 1.2771 | 1.0171 | 115.62 |
| 1.0738 | 1.2413 | 0.9965 | 111.07 |
| 1.0494 | 1.1986 | 0.9550 | 106.57 |
| 1.0341 | 1.1841 | 0.9444 | 106.04 |
| 1.0000 | 1.0520 | 0.9259 | 101.20 |
EUR/USD Range Has Formed Two POC Zones
After a steady uptrend on EUR/USD, we see that important trend line has been broken and the pair has been dropping consistently for 2 days. One of the reasons why EUR/USD is dropping is possibly profit taking which was enacted by hedge funds as French elections grow closer. Today POC zone for selling is 1.0775-90 (D H3, ATR Pivot, inner trend line, EMA89) while we might expect buyers within 1.0665-85 zone (Order block, D L5, W L5, 78.6). Any break of Upper POC range (1.0790) and Lower POC range (1.0665) should establish new intraweek trend. At this point we need to treat this as range play with 2 zones where EUR/USD might react.
Quick Summary:
D H3 - Daily Camarilla Pivot (Daily Resistance)
POC - Point Of Confluence (The zone where we expect price to react - aka entry zone)
D L5 - Daily L5 Camarilla (Strongest Daily Support)
W L5- Weekly L5 Camarilla (Strongest Weekly Support)
Bullish Order Block - The height of bearish candle prior to move up
ECB March Signals Were Over-Interpreted
The euro came under selling pressure yesterday, following a Reuters report that investors over-interpreted the signals from the ECB's March policy meeting. The report revealed that ECB officials only wanted to communicate reduced risks and not a step towards a reduction in stimulus. In addition, it was noted that policymakers are now cautious of making any new changes to the April statement, and that they are worried of a potential surge in the bloc's government bond yields.
During the European morning Wednesday, EUR/USD was trading near the key zone of 1.0800 and the uptrend line drawn from the low of the 9th of March. Nevertheless, the signals this report sent to market participants pushed the rate below that key support crossroad, which in our view shifts the short-term outlook of the pair to neutral for now. The rate could continue lower for a while given this change in sentiment towards the ECB plans and is possible to aim for the 1.0725 (S1) support soon. A clear break below that level could target the next one of 1.0700 (S2). However, we think it's too early to assume that the outlook has turned back bearish.
Yesterday's report suggests that the ECB is unlikely to change its language in April, especially considering that the meeting will take place ahead of the French election, a political event that could add a risk premium to European bond yields. Something like that could enhance the concerns of ECB policymakers with regards to a surge in yields and therefore, we expect the ECB to maintain a balanced tone, at least until the outcome of the election is sealed. For the next couple of months, EUR-traders may shift their attention to headlines regarding the French vote.
UK vs EU: Let the negotiations begin
Yesterday, the EU officially received the UK's Article 50 letter, which marks the beginning of two years of negotiations, the guidelines of which will be published by the EU within the next couple of days. These guidelines are expected to focus on the 'divorce bill' first. The EU wants the UK to cover the budget commitments they agreed to, which amount to EUR 63 billion. This bill seems to face high criticism from the UK government. The UK Trade Secretary previously described the notion of being charged for leaving the EU as 'absurd'.
As for the pound, it didn't react much on the triggering given that the event and the timing were known and expected. Nevertheless, we expect the 'divorce bill' to attract market attention. In our opinion, signals that the UK will not pay this bill could weigh on sterling, as something like that could lead to delays in the rest of the negotiating process. Considering that the UK has two years to negotiate its exit deal, we think that potential delays may be viewed as more negative for Britain than the EU. Overall though, we believe that the financial world may focus primarily on the subject of trade. So, in our view, the pound's broader path could depend on that to a large extend.
GBP/JPY was one of the sterling crosses to trade higher in the aftermath of the triggering. The pair rebounded from 137.50 (S2) to find resistance slightly below 138.80 (R1). The price structure on the 4-hour chart still suggests a short-term downtrend and as such, we would expect the bears to make a comeback soon. A dip back below 138.30 (S1) could confirm that and perhaps pave the way for another test near 137.50 (S2).
As for today's highlights:
Germany's preliminary CPI for March is due out, just one day ahead of Eurozone's print. The forecast is for the nation's CPI to have slowed to +1.9% yoy from +2.2% yoy previously, which could increase speculation for the bloc's rate to move in a similar fashion. Although something like that may cause the euro to trade a bit lower, we doubt that it will be particularly worrisome for ECB policymakers, given that they made it clear they pay more attention to core CPI prints.
In the US, the final estimate of Q4 2016 is due out, but considering that the 1st quarter of 2017 is almost over, we will treat these data as outdated. Initial jobless claims for the week ended March 24th are also out.
As for the speakers, we have three on the agenda: New York Fed President William Dudley, Dallas Fed President Robert Kaplan and ECB Executive Board member Yves Mersch.
EUR/USD
Support: 1.0725 (S1), 1.0700 (S2), 1.0665 (S3)
Resistance: 1.0770 (R1), 1.0800 (R2), 1.0825 (R3)
GBP/JPY
Support: 138.30 (S1), 137.50 (S2), 137.00 (S3)
Resistance: 138.80 (R1), 139.40 (R2), 140.40 (R3)
EUR/GBP Daily Outlook
Daily Pivots: (S1) 0.8608; (P) 0.8671; (R1) 0.8720; More...
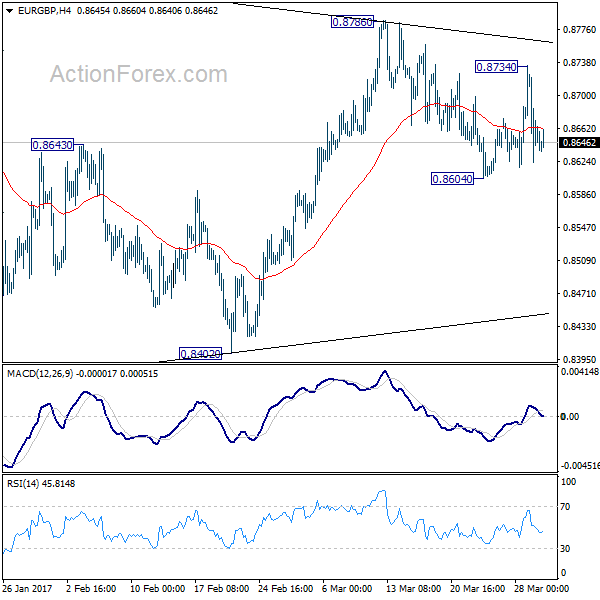
Intraday bias in EUR/GBP remains neutral for the moment. Overall, price actions from 0.8303 are forming a corrective pattern, as the second leg of the correction from 0.9304. Below 0.8604 will turn bias to the downside for 0.8402. Break will target 0.8116 cluster support, where the correction from 0.9304 should end. On the upside, above 0.8786 will target 61.8% retracement of 0.9304 to 0.8303 at 0.8922 instead.
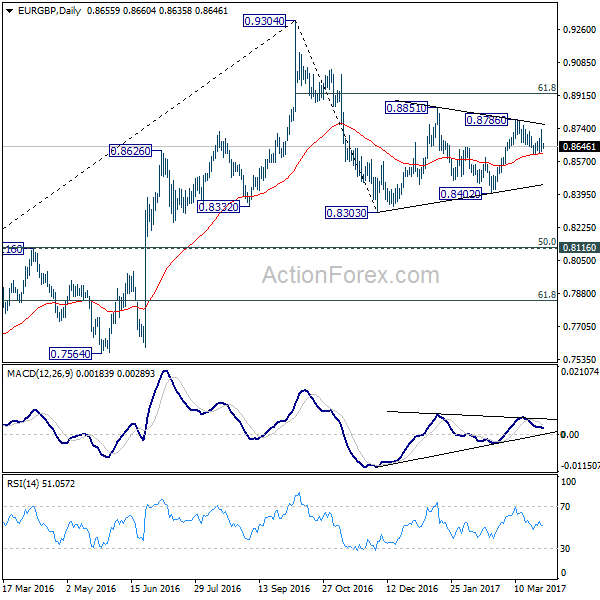
In the bigger picture, price actions from 0.9304 are viewed as a medium term corrective pattern. Deeper fall cannot be ruled out yet. But we'd expect strong support from 0.8116 cluster support (50% retracement of 0.6935 to 0.9304 at 0.8120) to contain downside. Overall, the corrective pattern would take some time to complete before long term up trend resumes at a later stage. Break of 0.9304 will pave the way to 0.9799 (2008 high).
EUR/AUD Daily Outlook
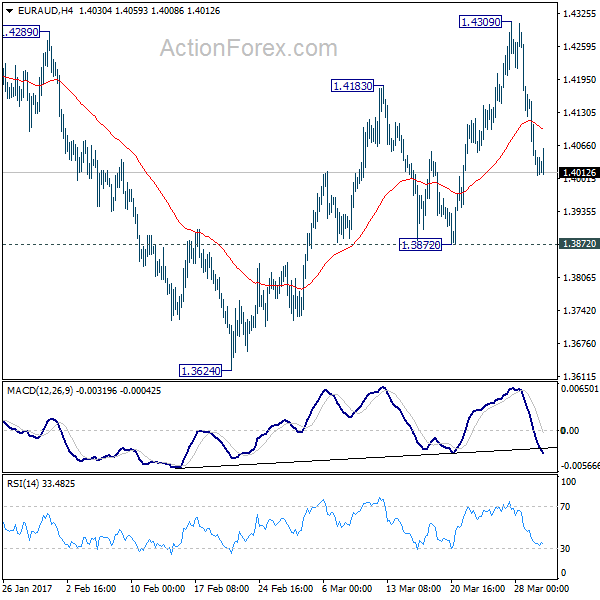
Daily Pivots: (S1) 1.3974; (P) 1.4070; (R1) 1.4132; More...
Intraday bias in EUR/AUD remains neutral for the moment. At this point, we're still mildly favoring the case of trend reversal. And, another rise is expected as long as 1.3872 support holds. Above 1.4309 should send the cross through channel resistance (now at 1.4378) to 1.4721 key resistance. However, break of 1.3872 will dampen our bullish view and bring retest of 1.3642 low instead.
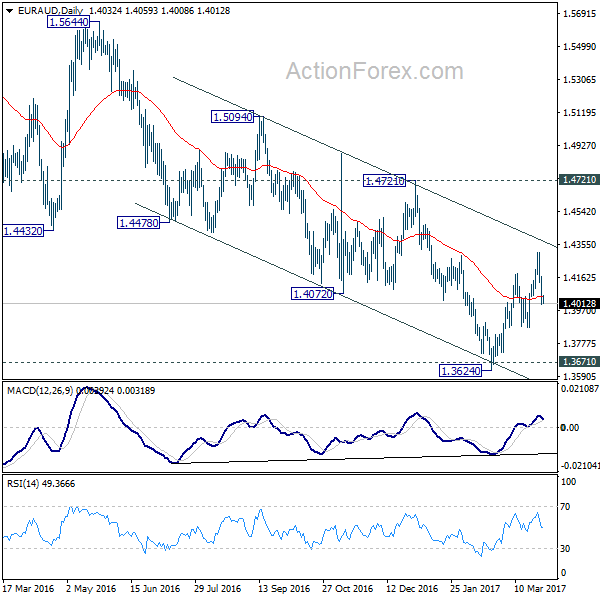
In the bigger picture, price actions from 1.6587 medium term top are viewed as a corrective pattern. Such correction could be completed after testing 1.3671 support. Break of 1.4721 cluster resistance (38.2% retracement of 1.6587 to 1.3624 at 1.4756) should confirm this case and target 61.8% retracement at 1.5455 and above. Overall, we'd expect the up trend from 1.1602 to resume later. However, sustained break of 1.3671 will invalidate our bullish view and would turn focus back to 1.1602 long term bottom.