
Sample Category Title
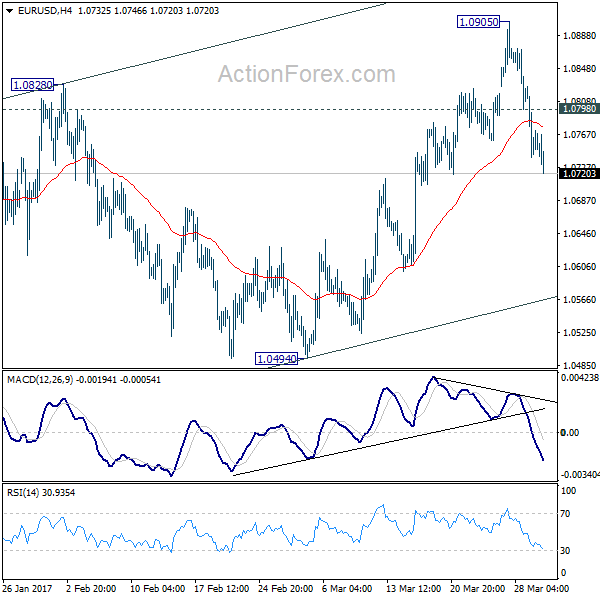
EUR/USD Mid-Day Outlook
Daily Pivots: (S1) 1.0727; (P) 1.0777 (R1) 1.0814; More.....
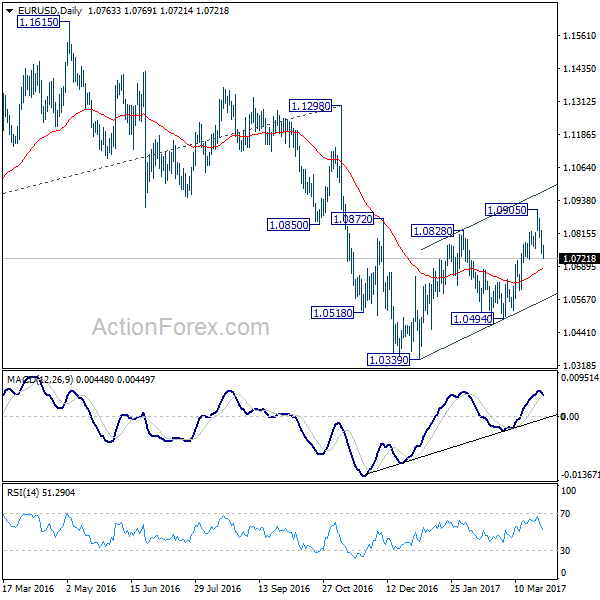
EUR/USD's fall continues today and reaches as low as 1.0721 so far. Current development argues that corrective rise from 1.0339 could be completed at 1.0905. Intraday bias remains on the downside for 55 day EMA (now at 1.0682) first. Sustained break there will affirm this view and target 1.0494 resistance for confirmation. On the upside, above 1.0798 minor resistance will turn bias back to the bias up to the upside for 1.0905 instead.
In the bigger picture, as long as 1.1298 key resistance holds, whole down trend from 1.6039 (2008 high) is still expected to continue. Break of 1.0339 low will send EUR/USD through parity to 61.8% projection of 1.3993 to 1.0461 from 1.1298 at 0.9115. However, considering bullish convergence condition in weekly MACD, break of 1.1298 will indicate term reversal. this would also be supported by sustained trading above 55 week EMA.
Dollar Shrugs off News on Trump’s Infrastructure Spending, Euro Soft after German CPI
Dollar trades mixed today in spite of news about US President Donald Trump's infrastructure spending. US Transportation Secretary Elaine Chao said the Trump would unveil a USD 1T infrastructure plan over ten years, later this year. But no detail was provided. Chao said that the plan would cover "more than transportation infrastructure, it will include energy, water and potentially broadband and veterans hospitals as well." However, the news is shrugged off by investors as they remain skeptical on Trump's ability push through his economic policies.
Released from US, initial jobless claims dropped 3k to 258k in the week ended March 25, above expectation of 245k. The four week moving average rose from 246.5k to 254.25k. Continuing claims rose 65k to 2.05m in the week ended March 18. Q4 GDP growth was revised up to 2.1% annualized, above expectation of 2.0%. GDP price index was also revised up to 2.1%. From Canada, IPPI rose 0.1% mom in February, RMPI rose 1.2% mom.
Euro stays soft on weak German CPI
Euro has been under some pressure as markets reassess the possibility of early stimulus exit by the central bank. And the common currency stays soft after mixed data. In particular, German CPI rose 0.2% mom, 1.6% yoy in March, slowed from 0.6% mom and 2.2% in February, and missed expectation of 0.4% mom, 1.8% yoy. Eurozone business climate was unchanged at 0.82 in March versus expectation of 0.87. Economic confidence dropped to 107.9 versus expectation of 108.3. Industrial confidence dropped to 1.2 versus expectation of 1.4. Services confidence dropped to 12.7 versus expectation of 14.0. Consumer confidence was finalized at -5. Also from Europe, Swiss KOF leading indicator rose to 107.6 in March.
ECB Nowotny: strategy for 2017 largely set
A Reuters report quoted unnamed source saying yesterday that the markets have over-interpreted ECB's message in the March meeting. Today, ECB governing council member Ewald Nowotny said together that "the strategy for 2017 has largely been set and from my point of view there is no reason to depart from this." Also, another governing council member Klass Knot said that "only if the economy does even better than we now expect in our estimates could we consider bringing the tapering forward." Regarding ending asset purchase before rate hike, Knot said that "this sequence makes sense, the forward guidance makes sense and I don't see a need to revisit that now."
EC Tusk to UK: We already miss you
European Council President Donald Tusk expressed his emotion on receiving the Brexit trigger letter from UK. Tusk said that there is "no reason to pretend that this is a happy day, neither in Brussels, nor in London." And, "what can I add to this? We already miss you." However, French President Francoise Hollande told May in a phone call that he opposed to negotiating the trade deal together with withdrawal from EU. A statement from Hollande's Élysée office said that "The president indicated that the talks must at first be about the terms of withdrawal, dealing especially with citizens' rights and obligations resulting from the commitments made by the United Kingdom. On the basis of the progress made, we could open discussions on the framework of future relations between the United Kingdom and the European Union." German Chancellor Angela Merkel expressed similar view yesterday.
UK prime minister Theresa May said in the Brexit letter than "we are leaving the European Union, but we are not leaving Europe - and we want to remain committed partners and allies to our friends across the continent."Brexit secretary David Davis said that UK will publish details on converting EU laws into UK laws to pave the way for a smooth transition and avoid any legal black holes. Davis said that "converting EU law into U.K. law, and ending the supremacy of lawmakers in Brussels, is an important step in giving businesses, workers and consumers the certainty they need."
BoJ Iwata: No need to buy US treasuries
In Japan, BoJ Deputy Governor Kikuo Iwata said that there is no need to buy US treasuries as sufficient monetary easing could be done by JGB purchases. He told parliament that "we can achieve our 2 percent inflation target and seek an eventual exit from our quantitative easing program without buying U.S. Treasury debt." And he warned that "buying U.S. Treasury debt unnecessarily would be interpreted as currency intervention."
EUR/USD Mid-Day Outlook
Daily Pivots: (S1) 1.0727; (P) 1.0777 (R1) 1.0814; More.....
EUR/USD's fall continues today and reaches as low as 1.0721 so far. Current development argues that corrective rise from 1.0339 could be completed at 1.0905. Intraday bias remains on the downside for 55 day EMA (now at 1.0682) first. Sustained break there will affirm this view and target 1.0494 resistance for confirmation. On the upside, above 1.0798 minor resistance will turn bias back to the bias up to the upside for 1.0905 instead.
In the bigger picture, as long as 1.1298 key resistance holds, whole down trend from 1.6039 (2008 high) is still expected to continue. Break of 1.0339 low will send EUR/USD through parity to 61.8% projection of 1.3993 to 1.0461 from 1.1298 at 0.9115. However, considering bullish convergence condition in weekly MACD, break of 1.1298 will indicate term reversal. this would also be supported by sustained trading above 55 week EMA.
Economic Indicators Update
| GMT | Ccy | Events | Actual | Forecast | Previous | Revised |
|---|---|---|---|---|---|---|
| 07:00 | CHF | KOF Leading Indicator Mar | 107.6 | 105.8 | 107.2 | 106.9 |
| 09:00 | EUR | Eurozone Business Climate Indicator Mar | 0.82 | 0.87 | 0.82 | |
| 09:00 | EUR | Eurozone Economic Confidence Mar | 107.9 | 108.3 | 108 | |
| 09:00 | EUR | Eurozone Industrial Confidence Mar | 1.2 | 1.4 | 1.3 | |
| 09:00 | EUR | Eurozone Services Confidence Mar | 12.7 | 14 | 13.8 | 13.9 |
| 09:00 | EUR | Eurozone Consumer Confidence Mar F | -5 | -5 | -5 | |
| 12:00 | EUR | German CPI M/M Mar P | 0.20% | 0.40% | 0.60% | |
| 12:00 | EUR | German CPI Y/Y Mar P | 1.60% | 1.80% | 2.20% | |
| 12:30 | USD | GDP Annualized Q4 T | 2.10% | 2.00% | 1.90% | |
| 12:30 | USD | GDP Price Index Q4 T | 2.10% | 2.00% | 2.00% | |
| 12:30 | USD | Initial Jobless Claims Mar 25 | 258K | 245k | 261k | |
| 12:30 | CAD | Industrial Product Price M/M Feb | 0.10% | 0.30% | 0.40% | 0.60% |
| 12:30 | CAD | Raw Materials Price Index M/M Feb | 1.20% | 0.80% | 1.70% | |
| 14:30 | USD | Natural Gas Storage | -42B | -150B |
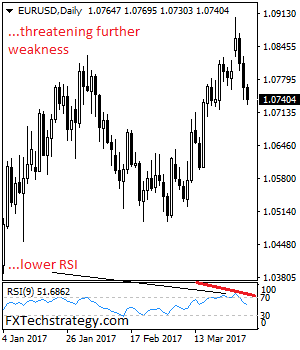
EURUSD: Bearish, Targets Further Weakness
EURUSD: With the pair closing further lower on Wednesday, it now looks to weaken further in the days ahead. This exposes its support located at 1.0700 level. Resistance comes in at 1.0800 level with a cut through here opening the door for more upside towards the 1.0850 level. Further up, resistance lies at the 1.0900 level where a break will expose the 1.0950 level. Conversely, support lies at the 1.0700 level where a violation will aim at the 1.0650 level. A break of here will aim at the 1.0600 level. All in all, EURUSD faces further pullback threats.
Markets Mixed ahead of US GDP
Global stock markets were mixed on Thursday with investors losing their appetite for risk after the Brexit reality started to sink in. Asian shares turned lower amid the China liquidity fears and the sense of caution has already limited gains in Europe. With the Brexit developments and fresh liquidity concerns in China possibly denting risk sentiment further, Wall Street may find itself under selling pressure. Although global stocks have handsomely benefited from the Trump effect and unwavering optimism over fiscal stimulus boosting US growth, the downside risks could be extreme if reality fails to match market expectations.
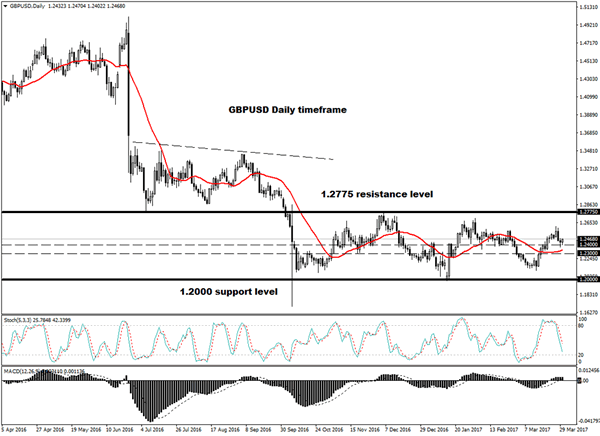
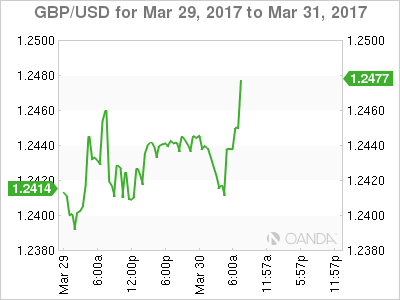
Sterling turns highly sensitive
Sterling could be instore for a very rocky ride moving forward as the Brexit talks officially get under way. With the remaining 27 EU member states meeting at the end of April to agree on the guidelines for the Brexit settlement and formal negations potentially starting as late as June, Sterling sensitivity may intensify as investors become jittery. With the hard Brexit fears lingering in the background and concerns of complications in the early stages of the negations weighing on sentiment, the bearish bias towards Sterling remains intact. While there is a possibility of the GBPUSD experiencing technical bounces as investors reposition, sellers may exploit the opportunities to install fresh rounds of selling. From a technical standpoint, the GBPUSD bears need to conquer 1.2400 to open a path lower towards 1.2300.
Dollar Index breaks above 100.00
The chorus of hawkish speeches from Fed officials during Wednesday's trading session has encouraged Dollar bullish investors to elevate the Dollar Index back above the psychological 100.00 level. It seems like markets may be looking beyond last week's failure of Trump's healthcare reform with investors maintaining some optimism over the pending fiscal stimulus. While a layer of uncertainty over Trump has created some headwinds for the bulls, the improving sentiment towards the US economy as a whole could play a part in ensuring the currency remains buoyed. Investors may direct their attention towards the pending US GDP report for four quarter of 2016 which could boost the Dollar further if the figure exceeds expectations. Technical traders may observe if the Dollar Index is able to attain a daily close above 100.00 which could encourage further upside.
Commodity spotlight - WTI
WTI Crude charged into gains on Wednesday with prices clipping above $49.60 after U.S Crude inventories grew less than expected which eased some oversupply concerns. Although the relatively bullish US crude inventories data and supply disruptions in Libya have provided oil markets a welcome boost, the gains may be limited as investors mull over the effectiveness of OPEC's supply cuts. As long as optimism continues to fade over OPEC stabilizing the saturated oil markets, bears will have many opportunities to attack prices lower. From a technical standpoint, oil bears may exploit the technical bounce to send oil prices back below $49.
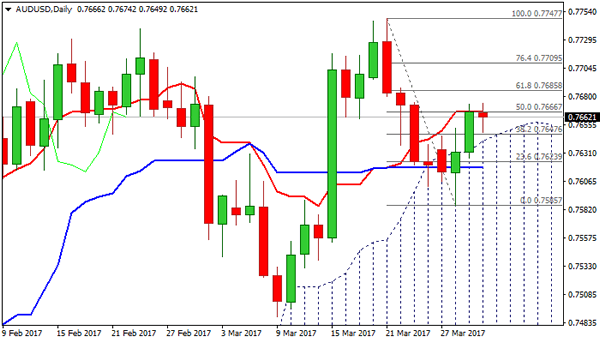
Aussie Holding above Thick Daily Cloud
The Aussie is holding above thick daily cloud on Thursday after previous day's strong rally, but so far unable to clearly next picot at 0.7666 (daily Tenkan-sen).
Consolidation below the latter is under way, with near-term action being biased higher on bullish near-term studies, with daily cloud top (currently at 0.7641) expected to hold and keep scope for further recovery in play.
However, bullish scenario requires sustained break above Tenkan-sen line for fresh extension higher and attack at next pivot at 0.7685 (Fibo 61.8% of 0.7747/0.7585 pullback).
Conversely, failure to hold above daily cloud would be negative signal, with extension below daily Kijun-sen at 0.7618, to revive near-term bears.
Res: 0.7666; 0.7685; 0.7709; 0.7739
Sup: 0.7641; 0.7618; 0.7588; 0.7550
Odds Favor U.K’s Divorce to Get Messy
Thursday March 30: Five things the markets are talking about
U.K's divorce proceeding with the E.U have officially begun, and like most separations, expect the "children," in this case the electorate, who will be the most affected when things get emotional and messy.
In this circumstance, a two-year timeline to complete and signoff on the exit seems very tight, and the cost will be like building a house, more than the initial proposed budget.
Over the coming months, and years, it's not going to be an easy ride for either sterling, Governor Carney or PM Theresa May, let alone the U.K electorate or mainland Europe. It will however keep capital markets very busy.
This divorce will redefine the country's relationship with its largest trading partner and end decades of deepening political integration on the continent.
Elsewhere, the U.S dollar has got a lift from 'hawkish' Fed officials, while crude gains on lower inventory numbers. The U.S reports its third estimate for Q4 GDP this morning, while tomorrow's data include data on personal spending and incomes.
1. Stock slip on Q1 close
Global equities are under pressure as investors approach the end of the best quarter for stocks in four years.
Japan's Topix fell -0.9%. The index is up +0.6% for the quarter, despite the yen's (¥111.23) strengthening this year. Down-under, the Aussie's S&P/ASX 200 index climbed +0.4%, gaining for a third day to the highest since April 2015 as energy shares jumped.
In Hong Kong, the Hang Seng fell -0.3% while the Hang Seng China Enterprises Index lost -0.7%.
In China, the Shanghai Composite (-1%) was one of the worst performers, as investors ponder the People's Bank of China's (PBoC) support after the central bank skipped its reverse repo operation injection for the fifth consecutive day.
In Europe, equity indices are trading mixed, but generally higher as market participants digest the formal start of Brexit. Banking stocks are generally lower in the Eurostoxx, while commodity and energy trade notably higher in the FTSE 100.
U.S stocks are set to open in the red (-0.1%).
Indices: Stoxx50 -0.1% at 3,470, FTSE +0.1% at 7,378, DAX +0.1% at 12,215, CAC-40 flat at 5,070, IBEX-35 flat at 10,370, FTSE MIB +0.1% at 20,289, SMI +0.1% at 8,666, S&P 500 Futures -0.1%
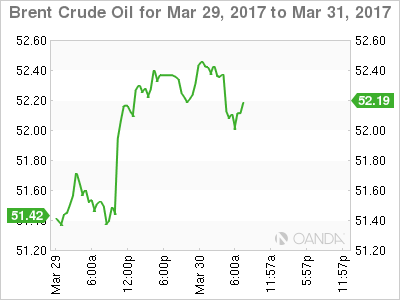
2. Oil prices steady after two days of gains, gold slips
Crude oil prices are little changed ahead of the U.S open after two-days of increases as bloated U.S. inventories limited the impact of supply disruptions in Libya and lower supply from other OPEC exporters.
Brent crude oil is unchanged at +$52.42 a barrel, while U.S light crude oil (WTI) is down -5c at +$49.56. Both benchmarks rose more than +$1 a barrel yesterday to their highest levels for two-weeks, rallying back from a four-month low.
Note: Oil production in Libya has fallen more than -250k bpd this week as armed protesters have blocked oilfields of Sharara and Wafa.
A Reuters survey released yesterday showed that OPEC members have complied with +95% of their commitments under last Nov.'s deal cut. Nevertheless, members are still finding it difficult to tighten the oil market because inventories in many parts of the world are at, or near, record highs.
Note: This week's U.S EIA report showed that U.S. crude stocks rose +867k barrels to a record of nearly +534m barrels last week.
Investors are waiting to see if OPEC and non-OPEC members decide to extend its production curbs into H2.
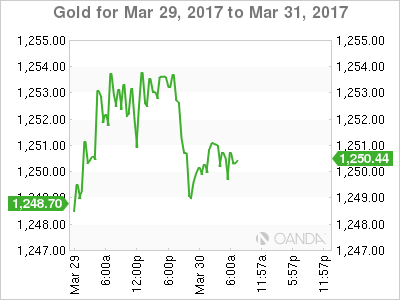
Gold prices have dipped overnight (down -0.1% at +$1,250.66 an ounce) as the dollar strengthened, but economic uncertainty around the U.K's departure from the E.U and the approaching French elections has capped those losses.
3. Rate divergence the "name of the game"
In Europe, yields on 10-year German Bunds (-2 bps to +0.29%) are under pressure in the secondary market after a series of inflation releases on a state level show consumer prices are rising at a slower pace. The reports appear to fall in line with the recent ECB view that the pick up in inflation was "temporary." This reinforces the view that the ECB is not anywhere near the exit of its QE.
Elsewhere, ten-year Italian BTP's have rallied more than +10 bps against Bunds this month, and with the ECB trying to eliminate the hike/tapering discussion; investors should be expecting more spread tightening in the short-term.
Ahead of the U.S open, yields on U.S 10's are little changed at +2.38%. The yield fell -4 bps yesterday after backing up the same amount on Tuesday. Aussie 10-year yields fell -3 bps to +2.69%.
4. Dollar finds much needed Fed support
The 'mighty' dollar is better bid overnight after Fed officials yesterday suggested that some policymaker's (Rosengren) favor raising interest rates more than twice this year.
Note: Fed fund futures show a +20% chance that rates will end the year above +1.5%. Bank of Cleveland President Loretta Mester, Bank of Dallas President Robert Kaplan and New York Fed President William Dudley are all due to speak later today.
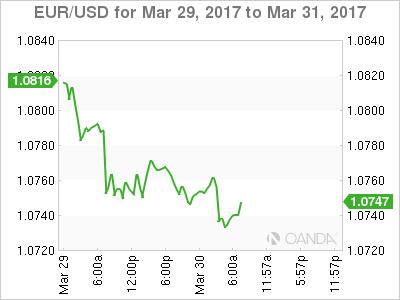
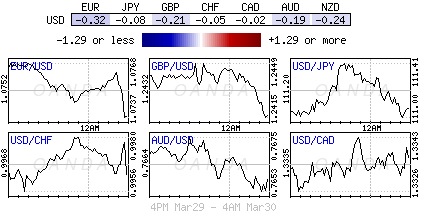
The EUR/USD (-0.3% to a new week low at €1.0731) has come under selling pressure since a report Wednesday said that the ECB thought the March meeting was "over interpreted" as too hawkish. Expect speeches by ECB policymakers to be closely watched today.
Sterling (-0.25% at £1.2406) is withstanding the formal start to Brexit. Investors now have to gauge how much of a "hard" divorce is already priced in?
5. March inflation data eases for both Germany and Spain
This morning's Euro inflation data releases for March appear to fall in line with recent ECB view that the pick up in inflation was "transitory."
Consumer-price growth in Spain (+2.1%) weakened for the first time in almost a year, while Germany's Saxony date also shows a drop (+1.8% vs. +2.4%).
Note: German regional inflation numbers are being released throughout the morning.
The market expects the euro-zone flash inflation number due Friday to show a drop to +1.8%.
These weaker headline prints should reinforces view that the ECB is not anywhere near the exit of its expansionary monetary strategy and would maintain its forward guidance that rates to stay low or lower in the forecast horizon.
USD/CAD – Canadian Dollar Unchanged Ahead Of US GDP
USD/CAD is unchanged in the Thursday session. Currently, the pair is trading at 1.3340. On the release front, the US releases Final GDP, with an estimate of 2.0%, compared to Preliminary GDP which came in at 1.9%. We’ll also get a look at unemployment claims. There are no Canadian events on the schedule. On Friday, Canada releases GDP, with the estimate standing at 0.3%. The US releases UoM Consumer Sentiment, which is expected to improve to 97.8 points.
What’s next for the Bank of Canada? On Tuesday, BoC Governor Stephen Poloz hinted that the BoC would not be raising interest rates in the near future, saying that the Canadian economy had not yet recovered from the huge drop in oil prices. He added that raising interests rates back to “normal” would have a negative effect on the economy and would likely trigger a recession. The last time the BoE raised rates was in 2010, and analysts don’t forecast another hike before 2018. President Trump’s “America first” stance is a serious concern for Canada, which is heavily reliant on open trade. Poloz criticized Trump’s protectionist agenda, saying that “protectionism does not promote growth and its costs are steep”.
It’s been a rough start for the Trump administration, which has been beset by controversy and crises. Trump, who has been in office for more than two months, has yet to provide any details of an economic policy, to the consternation of the markets. Last week, Trump’s proposed bill was dead on arrival before even being voted on, a humiliating defeat for the president. This setback has made the markets even more jittery about Trump, and the inquiry into the Trump administration’s links with Russia is gathering steam, which is another cause for concern for nervous investors. Trump has said he will now focus on tax reform, but the White House will need to improve coordination with Republican lawmakers to ensure that his next attempt to pass legislation is not a repeat of the healthcare debacle.
European Market Update: Mar Inflation Data Eases For Both Germany And Spain, Reinforces Dovish ECB Monetary Policy Outlook
Mar inflation data eases for both Germany and Spain, reinforces dovish ECB monetary policy outlook
Notes/Observations
Mar CPI readings for German States and Spain ease from prior multi-year highs (as forecasted; Reinforces view that ECB was not anywhere near the exit of its expansionary monetary strategy
Overnight:
Asia:
China Premier Li Keqiang expected to win another term as Premier (**Note: Speculation was brewing that his tenure might end at this year’s twice-a-decade leadership shuffle)
PBoC skipped its open market operations for 5th straight session noting that liquidity was at a relatively high level
Europe:
ECB's Praet (Belgium, chief economist): unconventional policies have been effective in enhancing our ability to deliver on our mandate in a medium-term. Non-standard measures have been designed in such a way that they cannot compensate for failures in other policy areas
Americas:
Fed's Rosengren (moderate, non-voter): Fed should think about normalizing faster; economy strong enough to withstand 4 rate hikes per year
Fed's Williams (moderate, non-voter): sees probably 3-4 rate hikes this year; has been surprised by strength of job market
Two Republican House members: House GOP is considering another try on Obamacare repeal next week
US Treasury said to prepare to review China's market-economy status under WTO; expected to keep large tariffs on Chinese good
Economic Data
(NL) Netherlands Mar Producer Confidence: 7.8 v 7.0 prior
(DE) Germany Mar CPI Saxony M/M: 0.2% v 0.5% prior; Y/Y: 1.8% v 2.4% prior
(CH) Swiss Mar KOF Leading Indicator: 107.6 v 105.8e
(ES) Spain Mar Preliminary CPI M/M: 0.0% v 0.2%; Y/Y: 2.3% v 2.6%e
(ES) Spain Mar Preliminary CPI EU Harmonized M/M: 1.1% v 1.5%e; Y/Y: 2.1% v 2.7%e
(TR) Turkey Mar Economic Confidence: 96.1 v 91.5 prior
(DE) Germany Mar CPI Brandenburg M/M: 0.3% v 0.5% prior; Y/Y: 1.4% v 2.0% prior
(DE) Germany Mar CPI Hesse M/M: 0.0% v 0.6% prior; Y/Y: 1.7% v 2.5% prior
(DE) Germany Mar CPI Bavaria M/M: 0.4% v 0.6% prior; Y/Y: 1.7% v 2.1% prior
(AT) Austria Mar Manufacturing PMI: 56.8 v 57.2 prior
(DE) Germany Mar CPI North Rhine Westphalia M/M: 0.1% v 0.6% prior; Y/Y: 1.7% v 2.3% prior
(PT) Portugal Mar Consumer Confidence: -3.4 v -4.4 prior; Economic Climate Indicator: 1.6 v 1.4 prior
(EU) Euro Zone Mar Business Climate Indicator: 0.82 v 0.87e; Consumer Confidence (Final): -5.0 v -5.0e; Economic Confidence:107.9 v 108.3e, Industrial Confidence: 1.2 v 1.4e, Services Confidence: 12.7 v 14.0e
Fixed Income Issuance:
(SE) Sweden sold total SEK 750M vs. SEK750M indicated in I/L 2027 and 2032 Bonds
(IT) Italy Debt Agency (Tesoro) sold total €4.75B vs. €3.75-4.75B indicated in 5-year and 10-year BTP Bonds
Sold €2.25B vs €1.75-2.25B indicated in 1.20% Jan 2022 BTP; Avg Yield: 1.04% v 1.11% prior; Bid-to-cover: 1.51x v 1.25x prior
Sold €2.5B vs €2.0-2.5B indicated in 2.2% June 2027 BTP; Avg Yield: 2.25% v 2.28% prior; Bid-to-cover: 1.36x v 1.41x prior
(IT) Italy Debt Agency (Tesoro) sold total €1.75B vs. €1.0-1.75B indicated in 2020 and 2067 BTP bonds
(IT) Italy Debt Agency (Tesoro) sold €2.5B vs. €2.0-2.5B indicated in Feb 2024 CCTeu (Floating Rate Bond); Avg yield: 0.70% v 0.79% prior; Bid-to-cover: 1.33x v 1.56x prior
SPEAKERS/FIXED INCOME/FX/COMMODITIES/ERRATUM
Index snapshot (as of 10:00 GMT)
Indices [Stoxx50 -0.1% at 3,470, FTSE +0.1% at 7,378, DAX +0.1% at 12,215, CAC-40 flat at 5,070, IBEX-35 flat at 10,370, FTSE MIB +0.1% at 20,289, SMI +0.1% at 8,666, S&P 500 Futures -0.1%]
Market Focal Points/Key Themes: European equity indices are trading mixed but generally higher as market participants are still digesting the formal start of Brexit; Banking stocks generally lower across the board; shares of Daimler the notable laggard in the Eurostoxx as it trades ex-dividend; shares of Ashtead trading notably higher in the FTSE 100 after receiving an analyst upgrade; oil stocks trading higher in the index as Brent and WTI trade just off weekly highs.
Upcoming scheduled US earnings (pre-market) include Dell Technologies, Lindsay Corp, Science Applications International Co, Titan Machinery.
Equities (as of 09:50 GMT)
Consumer Discretionary: [AO World AO.UK -0.8% (trading update), Baywa BYW6.DE +0.3% (final FY16 results), Hennes & Mauritz HMB.SE -4.5% (Q1 results), Intelligent Energy Holdings IEH.UK -32.4% (prelim H1 results)]
Consumer Staples: [Carr’s Group CARR.UK -18.9% (trading update)]
Energy: [SSE SSE.UK -1.3% (outlook)]
Industrials: [Manz Automation M5Z.DE -1.4% (FY16 results), RPC Group RPC.UK -3.1% (trading update), Singulus Technologies SNG.DE +0.3% (FY16 results)]
Materials: [Treatt TET.UK +3.4% (trading update)]
Technology: [accesso Technology Group ACSO.UK +3.0% (acquires Ingresso Group for initial £17.5M)]
Speakers
ECB's Liikanen (Finland) stressed that the Euro Area still needed substantial support. Reiterated view that ECB can adjust bond purchases if inflation weakens (**Reminder: Beginning in April ECB added to €20B/month to its QE bond buying program for total purchases of €80B)
ECB’s Mersch (Luxembourg): Council committed to greater level of transparency and remains independent
ECB’s Nowotny (Austria): ECB's monetary policy was working
Eurogroup Chief Dijsselbloem noted that no staff-level agreement yet on Greece bailout review
SNB's Maechler reiterated view that expansive monetary policy continues to be necessary and that without negative interest rates CHF currency (franc) would be overvalued
Bank of Spain: 2018 inflation seen below 1.5%. Expected a slowdown in CPI throughout 2017
Turkey Presidential advisor Ertem: Pressure on TRY currency (Lira) expected to dissipate
South Africa's Cabinet said to threaten walkout if President Zuma fired his Finance Minister Gordhan
Currencies
The European inflation data for March appeared to fall in line with recent ECB view that the recent pick up in inflation was transitory. Reinforces view that ECB is not anywhere near the exit of its expansionary monetary strategy and would maintain its forward guidance that rates to stay low or lower in the forecast horizon
EUR/USD was softer in the session and trading below 1.0740 just ahead of the NY morning.
The USD was little changed elsewhere among the majors with USD/JPY holding above the 111 level and GBP/USD probing the lower end of the 1.24 handle.
The South Africa Rand was firmer as ruling ANC members appear to curb the President from firing his Finance Minister. USD/ZAR trading below 12.94.
Fixed Income:
Bund futures trade at 161.36 up 21 ticks continuing momentum from yesterday's comments relating to the ECB beingpetrochina wary of making any fresh-policy shift in its communication at its April meeting. Continued upside targets 161.55 followed by 161.87. A reversal eyes 160.74 initially followed by 160.52 then 160.04.
Gilt futures trade at 127.44 up 14 ticks, continuing to rise along with Bunds as Britain formally triggered Article 50 . Resistance moves to 127.50 followed by 127.89. Support moves to 126.86 followed by yesyerday low of 126.40. Short Sterling futures trade 1 to 2bp higher across the strip with Jun17Jun18 spread narrowing to 20Bp down 3.5bp since yesterday.
Thursday's liquidity report showed Wednesday's excess liquidity rose sharply to €1.543T a rise of €197B from €1.347T prior. Use of the marginal lending facility fell to €315M from €319M prior.
Corporate issuance saw $6B come to market via 7 issuers headlined by Hyundai 3 part $1.1B offering and Union Pacific $1B 2 part offering. This puts weekly issuance at $17.4B and issuance for March above $125
Looking Ahead
(EG) Egypt Interest Rate Decision
05:30 (ZA) South Africa Feb PPI M/M: 0.5%e v 0.4% prior; Y/Y: 5.6%e v 5.9% prior
05:30 (HU) Hungary Debt Agency (AKK) to sell Bonds (3 tranches)
06:00 (PT) Portugal Feb Industrial Production M/M: No est v -0.5% prior; Y/Y: No est v 2.7% prior
06:00 (PT) Portugal Feb Retail Sales M/M: No est v 2.7% prior; Y/Y: No est v 2.0% prior
06:45 (NO) Norway Central Bank (Norges) Dep Gov Matsen
06:45 (US) Daily Libor Fixing
07:00 (CZ) Czech Central Bank (CNB) Interest Rate Decision: Expected to leave Repurchase Rate unchanged at 0.05%
07:00 (BR) Brazil Central Bank (BCB) Quarterly Inflation Report
07:00 (BR) Brazil Mar FGV Inflation IGPM M/M: 0.1%e v 0.1% prior; Y/Y: 4.9%e v 5.4% prior
07:00 (ZA) South Africa Feb Electricity Consumption Y/Y: No est v -0.6% prior; Electricity Production Y/Y: No est v 0.8% prior
07:00 (NL) Netherlands Central Bank annual report
07:30 (BR) Brazil Jan Economic Activity Index (Monthly GDP) M/M: -0.1%e v -0.3% prior; Y/Y: -0.2%e v -1.8% prior
08:00 (DE) Germany Mar Preliminary CPI M/M: 0.4%e v 0.6% prior; Y/Y: 1.8%e v 2.2% prior
08:00 (DE) Germany Mar Preliminary CPI EU Harmonized M/M: 0.5%e v 0.7% prior; Y/Y: 1.9%e v 2.2% prior
08:00 (BR) Brazil Jan Retail Sales M/M: +0.5%e v -2.0% prior; Y/Y: -4.3%e v -4.9% prior
08:00 (BR) Brazil Jan Broad Retail Sales M/M: -0.9%e v -0.1% prior; Y/Y: -5.9%e v -6.7% prior
08:00 (ZA) South Africa Feb Budget Balance (ZAR): No est v -38.7B prior
08:00 (CL) Chile Feb Manufacturing Production Y/Y: -2.5%e v -1.1% prior; Industrial Production Y/Y: -5.5%e v -0.9% prior
08:00 (CL) Chile Feb Total Copper Production: No est v 452.0K prior
08:15 (UK) Baltic Dry Bulk Index
08:15 (CZ) Czech Central Bank Gov Rusnok to hold post Rate Decision press conference
08:30 (US) Q4 Final GDP Annualized Q/Q: 2.0%e v 1.9% prelim; Personal Consumption: 3.0%e v 3.0% prelim
08:30 (US) Q4 Final GDP Price Index: 2.0%e v 2.0% prelim; Core PCE Q/Q: 1.2%e v 1.2% prelim
08:30 (US) Initial Jobless Claims: 247Ke v 261K prior; Continuing Claims: 2.03Me v 1.990M prior
08:30 (CA) Canada Feb Industrial Product Price M/M: 0.4%e v 0.4% prior; Raw Materials Price Index M/M: 0.9%e v 1.7% prior
08:30 (US) Weekly USDA Net Export Sales
09:00 (RU) Russia Gold and Forex Reserve w/e Mar 24th: No est v $395.7B prior
(ZA) South Africa Central Bank (SARB) Interest Rate Decision: Expected to leave Interest Rate unchanged at 7.00%
09:00 (IT) Italy Fin Min Padoan
09:45 (US) Fed’s Mester (hawkish, non-voter)
10:30 (US) Weekly EIA Natural Gas Inventories
11:00 (BR) Brazil to sell Fixed Rate 2023 and 2027 Bonds
11:00 (BR) Brazil to sell 2017, 2019 and 2020 LTN Bills
11:00 (US) Fed’s Kaplan (moderate, voter)
11:15 (US) Fed’s Williams (moderate, non-voter)
14:00 (MX) Mexico Central Bank (Banxico) Interest Rate Decision Expected to raise Overnight Rate by 25bps to 6.50%
15:00 (AR) Argentina Feb Industrial Production Y/Y: -6.0%e v -1.1% prior; Construction Activity Y/Y: No est v -2.4% prior
16:30 (MX) Mexico Feb YTD Budget Balance (MXN): No est v -29.6B prior
16:30 (US) Fed’s Dudley (dove, FOMC voter)
DAX Steady Ahead Of German CPI
The DAX Index is steady in the Thursday session, as the DAX trades at 12,208.00. On the release front, key releases out of the eurozone and the US could shake up the euro on Thursday. Germany will release Preliminary CPI, which is expected to soften to 0.4%. The US will publish Final GDP, with an estimate of 2.0%, compared to Preliminary GDP which came in at 1.9%. On Friday, Germany releases retail sales and unemployment claims, and the Eurozone will publish CPI Flash Estimate.
The DAX started the week with strong gains and pushed above the 12,000 level. This was triggered by a strong German business confidence report and President Trump's failure to pass health legislation to replace parts of Obamacare. Germany will release key consumer inflation and spending data on Thursday and Friday, and unexpected readings could affect the direction of the euro. The economy, the largest in Europe, has has enjoyed a robust first quarter in 2017. Stronger global trade has led to increased demand for German exports, notably cars and machinery. Germany's GDP expanded 1.6% in 2016, its highest rate since 2012. The generally positive picture in Germany has boosted the eurozone economy and if the strong numbers continue, the ECB will be under more pressure to tighten monetary policy.
It's been a difficult few months for the Trump administration, which has stumbled out of the starting gate. Trump, who has been in office for more than two months, has yet to provide any details of an economic policy, to the consternation of the markets. Last week, Trump's proposed bill was dead on arrival before even being voted on, a humiliating defeat for the president. This setback has made the markets even more jittery about Trump, and the inquiry into the Trump administration's links with Russia is gathering steam, which is another cause for concern for nervous investors. Trump has said he will now focus on tax reform, but the White House will need to improve coordination with Republican lawmakers to ensure that his next attempt to pass legislation is not a repeat of the healthcare debacle.
Sterling Falls as May Triggers Brexit
The Pound fell as markets reacted to news that the Article 50 letter had been signed and was on its way to European Council President Donald Tusk. Some analysts argued that Brexit had yet to be fully priced into the Pound, which was reflected when Sterling again dropped from its highs later in the day. Prime Minster Theresa May stated her intent in the letter to negotiate both divorce and trade terms together, over the next two years. Adding that under the current scenario, safety would be greatly diminished if there were no deal in place at the end of the two-year period. However, there was no mention in the letter of the repeated calls from EU officials for the UK to pay a Brexit bill of approximately £50 billion.
The outcome of Sterling depends on the deal the UK can seal with the EU over the next two years, but just as important are economic figures. David Kerns, commercial development lead for currency specialists, Halo Financial, comments, "Sterling did strengthen initially, until the size and scope of the negotiations started to sink in. It's important to keep a close eye on how the markets are moving while uncertainty continues."
German Chancellor Angela Merkel has already rejected these demands by insisting that negotiations on Britain's exit from the European Union cannot run in parallel with talks on the future UK-EU relationship. The size of Britain's exit bill and the rights of EU citizens in the UK must be agreed before talks can move forward. Perhaps it is now sinking in that these discussions will be protracted and supremely complex. Sterling is lower this morning and may struggle to rally in the current environment.
Looking ahead today, we have a busy day on the data front, with Eurozone consumer confidence, economic sentiment, industrial confidence and business climate all due out shortly. From midday, we have US Gross Domestic Product (GDP) and Core Personal Consumption expenditures to be released. Any unexpected political comments or data released may cause some volatility.
Friendly Competition
My girlfriend and I often laugh about how competitive we are.
But I tend to laugh more.