Sample Category Title
Trade Idea Wrap-up: USD/JPY – Stand aside
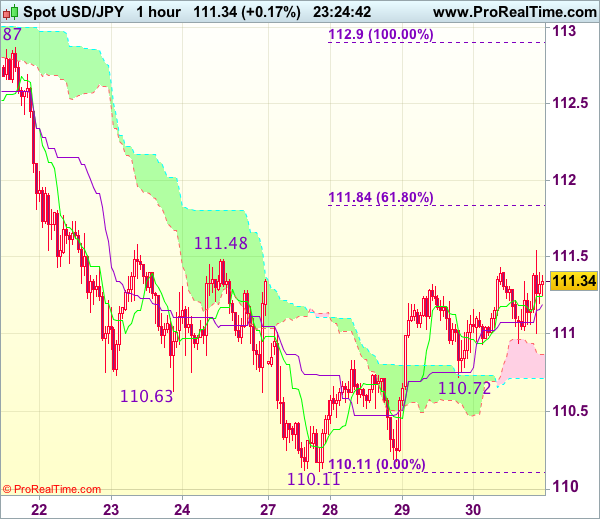
USD/JPY - 111.39
Most recent candlesticks pattern : N/A
Trend : Down
Tenkan-Sen level : 111.24
Kijun-Sen level : 111.19
Ichimoku cloud top : 110.87
Ichimoku cloud bottom : 110.72
New strategy :
Stand aside
Position : -
Target : -
Stop : -
As the greenback has risen again after finding support around the upper Kumo, suggesting the erratic rise from 110.11 low is still in progress and near term upside risk remains for this move to bring retracement of recent decline, hence gain to 111.80-85 (61.8% Fibonacci retracement of 112.90-110.11) cannot be ruled out, however, reckon upside would be limited to 112.00 and price should falter below previous support at 112.26, bring retreat later.
In view of this, would not chase this rise here and would be prudent to stand aside in the meantime. Below 110.90-95 would suggest an intra-day top is formed and bring further fall to 110.45-50, then towards this week’s low at 110.11, however, only break there would revive bearishness and extend recent decline to 109.95-00, then towards 109.70-75.
Trade Idea: EUR/GBP – Sell at 0.8620
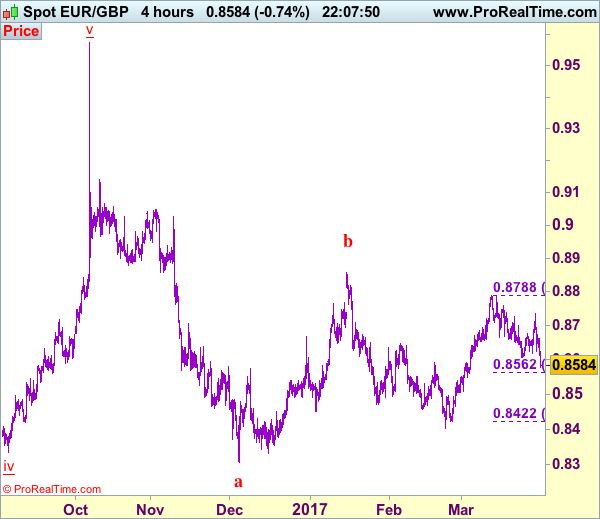
EUR/GBP - 0.8586
Recent wave: Major double three (A)-(B)-(C)-(X)-(A)-(B)-(C) is unfolding and 2nd (A) has possibly ended at 0.6936.
Trend: Near term down
New strategy :
Sell at 0.8620, Target: 0.8520, Stop: 0.8660
Position : -
Target : -
Stop : -
The single currency ran into renewed selling interest at 0.8735 and has dropped sharply, support at 0.8605 was penetrated, adding credence to our view that top has been formed at 0.8788 and downside bias is seen for the fall from there to bring retracement of early upmove, hence further weakness to 0.8560-65 (61.8% Fibonacci retracement of 0.8422-0.8788) would be seen, break there would extend fall to support at 0.8547 and possibly 0.8520 but reckon 0.8509 support would hold from here.
In view of this, we are looking to sell euro on recovery as 0.8620-25 should limit upside. Only above 0.8660-65 would defer and suggest low is possibly formed, risk rebound to 0.8680, then 0.8700 but price should falter below said resistance at 0.8735, bring further choppy trading later.
Our preferred count is that, after forming a major top at 0.9805 (wave V), (A)-(B)-(C) correction is unfolding with (A) leg ended at 0.8400 (A: 0.8637, B: 0.9491 and 5-waver C ended at 0.8400. Wave (B) has ended at 0.9413 and impulsive wave (C) has either ended at 0.8067 or may extend one more fall to 0.8000 before prospect of another rally. Current breach of indicated resistance at 0.9043 confirms our view that the (C) leg has ended and bring stronger rebound towards 0.9150/54, then towards 0.9240/50.
A Life Beyond Europe: What Does Article 50 Mean for Sterling?
As Theresa May dashed for the exit and the Brexit train picked up speed, anticipating how Sterling would react became little more than a fool's game. When Downing Street confirmed the triggering of Article 50 at the beginning of March, almost every trader had a bearish outlook. Global award-winning forex broker FXTM, reports that 95% of its clients were trading short on the GBPUSD in the run up to Wednesday, 29 March.
"Since the result of the EU Referendum last June, buying sentiment towards British Sterling has been predominantly negative," explains Jameel Ahmad, VP of Corporate Development and Market Research at FXTM. "The Pound saw some upsides the week before Article 50 was triggered, but the main catalyst behind this rebound was Dollar weakness, and the majority of traders maintained a negative view on the GBPUSD. The pair has been the subject of sell-on rally opportunities around the 1.25 region for some time."
Wednesday was no exception, and the Pound took a slump to 1.24 as May signed the letter that began formal negotiations. "My personal outlook on the Pound is negative," confirms Ahmad, downplaying the corrective bounce theory voiced by a number of his peers the week before the invoking of Article 50. "I am not willing to entertain the theory of a corrective bounce until the GBPUSD moves back above the 1.32 level on a weekly or monthly basis."
Much of the confusion over the future direction of the Pound is down to uncertainty. A full member state has never left the trading Bloc before, and no one knows what shape an unshackled UK might take. The provisions May negotiates for key sectors such as agriculture, energy, trade, and tourism, will have a huge impact on the long-term health of Sterling. Westminster has been careful to emphasize that the UK is unlikely to retain a shared customs union or free trade agreements -- both of which will impact trade deficits and currency values. The threat of a potential Scottish Independence Referendum, coupled with any apparent 'hard-Brexit' sentiment from European leaders, could reignite negative buying sentiment and send the currency tumbling as the Brexit negotiations progress.
Likewise, any positive developments over the next couple of years may well buoy the currency, even if only temporarily. With rising right-wing sentiment and Euroscepticism gripping the continent, the UK could secure a better deal than anyone thought possible. If the National Front win the French election in late April/early May, for instance, Britain will have at least one powerful ally at the negotiating table -- Marie Le Pen will be pushing for a better deal in the hopes of encouraging the French electorate to vote out as well.
While a Brexit deal is finalized, preventing a directionless meander between Sterling losses and gains will be high on the Westminster agenda for the next two years. May's careful courting of the media in recent weeks is no accident – her U-turn on Philip Hammond's National Insurance plan was widely seen as a move to curry favor with the (predominantly pro-Brexit) media. As an Independent UK takes shape, the headlines will have a huge impact on buying sentiment and short-term currency values. The British Prime Minister might not be able to control the usual gaggle of Front Benchers with a tendency to voice contradictory opinions, but she can ensure the broadsheets are singing the right tune. Ensuing Brexit negations will be the deciding factor in the level Sterling trades at, and positive reporting will go a long way towards bolstering the currency.
The Pound is not going to reach pre-July levels anytime soon. Uncertainty surrounding Brexit will limit any serious upside, and complications will likely expose the currency to another volley of sell-offs. With an unpredictable election in France looming, the Scottish First Minister pushing for Independence, and elections pending in Germany, the markets are likely to remain volatile for the foreseeable future.
Euro Remains in the Defensive on Soft Inflation Data
Headlines
European stock markets traded sideways today, ignoring disappointing eco data. US stock markets also opened nearly unchanged.
Sentiment towards the euro zone economy edged down, but stayed buoyant in March. The European Commission's monthly sentiment main index dipped to 107.9 points from 108.0 in February, remaining well above its long-term average of 100.
German consumer inflation slowed more sharply than expected in March. German HICP rose by 1.5 Y/Y after reaching a cycle high of 2.2 percent in February. Spanish inflation also tumbled from 3.0% Y/Y to 2.1%. Today's data of the EMU member states indicate a substantial easing of the preliminary EMU inflation to be released tomorrow.
The Czech Central bank kept its policy rate unchanged at 'technically zero'. The bank also maintained the cap on the koruna exchange rate. However, the bank indicated that the koruna cap may end at time after the hard pledge expires.
South African President Jacob Zuma's battles with his finance minister threaten a long-sought decline in the country's inflation rate, the governor of the country's central bank warned as the bank announced it would keep its interest rates on hold at 7%.
US eco data were mixed with a small upward revision to Q4 GDP from 2% Q/Qa to 2.1% Q/Qa, on the back of stronger than forecast personal consumption (3.5% Q/Qa). US weekly jobless claims were higher than expected at 258k, while a decline from 261k to 247k was expected.
More than one in two French voters believe struggling Socialist candidate Benoit Hamon should drop out of the presidential race in favour of a rival left-winger who has overtaken him in surveys of voting intentions, a poll showed.
Cleveland Fed Mester says additional interest-rate increases will be needed if economy continues to improve as expected. She would also be comfortable with changing the reinvestment policy to the shrink balance sheet, beginning later this year
Rates
Disappointing German CPI data support Bund
Global core bonds traded mixed with Bunds outperforming on the back of a bigger than expected drop in Spanish and German CPI readings. German inflation declined from 2.2% Y/Y to 1.5% Y/Y in February, suggesting that the ECB has more breathing room to hold on to its ultra-easy policy and fend off all external pressure to start normalizing its monetary policy in the near term. The Bund has an intraday upward bias, while the US Note future is trading more sideways. Bund gains remain contained though. US eco data printed mixed and had no impact on trading. Stock markets and Brent crude traded narrowly mixed in a dull session, also failing to guide rate markets.
At the time of writing, changes on the German yield curve range between +1.1 bp (2-yr) and -1.2 bps (30-yr). The US yield curve bear steepens with yields 0.4 bps (2-yr) to 1.8 bps (30-yr) higher. On intra-EMU bond markets, 10-yr yield spreads versus Germany widen up to 2 bps with Portugal outperforming (-6 bps).
The Italian debt agency successfully concluded this week's scheduled EMU bond supply by tapping on the run 5-yr BTP (€2.25B 1.2% Apr2022), 10-yr BTP (€2.5B 2.2% Jun2027), 50-yr BTP (€0.75B 2.8% Mar2067), off the run BTP (€1B 0.65% Nov2020) and a floating rate 7-yr CCTeu (€2.5B Feb2024). The amount sold was the maximum of the targeted €6.75-9B range and the auction bid cover was 1.49, which is strong for Italian norms.

Currencies
Euro remains in the defensive on soft inflation data
Yesterday's trends basically continued today in EUR/USD and USD/JPY. The euro remained in the defensive. Yesterday's market rumours of the ECB being unhappy with the recent hawkish market reaction, were supported by a sharp decline in the headline inflation of Germany and Spain. EUR/USD drifted a bit further south in the 1.07 big figure. At the same time, the dollar still shows no clear trend against the yen. USD/JPY hovers close to, but mostly slightly north of 111.
Overnight, Asian equities mostly showed moderate losses even as US indices held near record high levels. USD/JPY struggled to extend its rebound off the recent lows early in Asia, but ran into resistance very soon. The dollar remained well bid against a weak euro. EUR/USD traded in the 1.0750 area, near yesterday's correction low.
Yesterday's rumours of the ECB being 'unhappy' with the recent hawkish market reaction put the spotlights on EMU inflation (or the lack of it). Spanish inflation declined much more than expected (from 3.0% Y/Y to 2.1% Y/Y, 2.7% Y/Y expected). The first regional German CPI data were also much softer than expected (finally reported at 1.5% Y/Y). Last but not least, the confidence indicators of the EC also came out on the softer side of market expectations. European bond yields declined further. EUR/USD fell to the 1.0730/35 area. The interest rate differential between the US and Germany didn't widen much further, but kept well off the recent lows.
In the US, the Q1 GDP final GDP was revised slightly higher at 2.1% Qa/Qa. The core PCE deflator was also marginally higher than expected at 1.3%. At the same time, US jobless claims declined again less than expected (to 258 000). The dollar gained slightly ground after the data, but the move was negligible and didn't last long. EUR/USD trades currently in the 1.0740/50 area. USD/JPY is changing hands in the low 110 area.

Sterling resilience persists
There was little high profile news in the UK today. For now, the start of the 'official' Brexit procedure didn't cause any negative sentiment on the UK currency, on the contrary . Regarding the other majors, the euro was under pressure as the market adapted positions for a prolonged period of easy ECB policy. This euro softness is also filtering through in EUR/GBP. The pair is currently drifting below the 0.86 barrier. At the same time, sentiment on the dollar isn't that convincing (cf USD/JPY). Cable rebounded to the 1.25 area. So, global FX conditions maybe fell in place to trigger some by default GBP buying/short covering as the start of Brexit didn't bring any negative GBP-event risk yet.

Trade Idea: USD/CAD – Sell at 1.3340
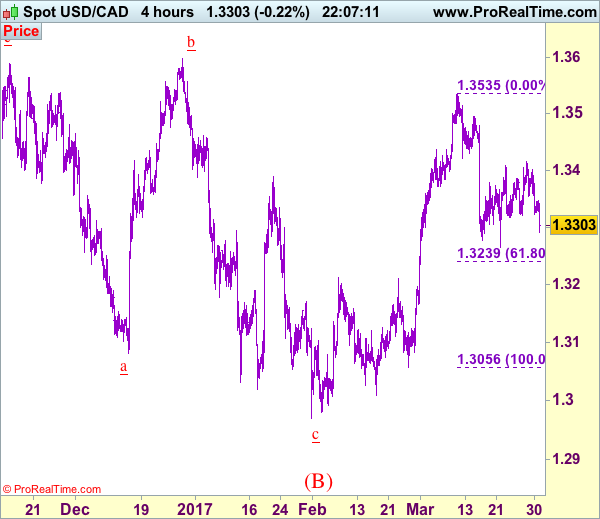
USD/CAD - 1.3303
Recent wave: Only wave v of c has ended at 0.9407 and wave C of major A-B-C correction is underway for headway to 1.4700
Trend: Near term up
New strategy :
Sell at 1.3340, Target: 1.3200, Stop: 1.3400
Position: -
Target: -
Stop:-
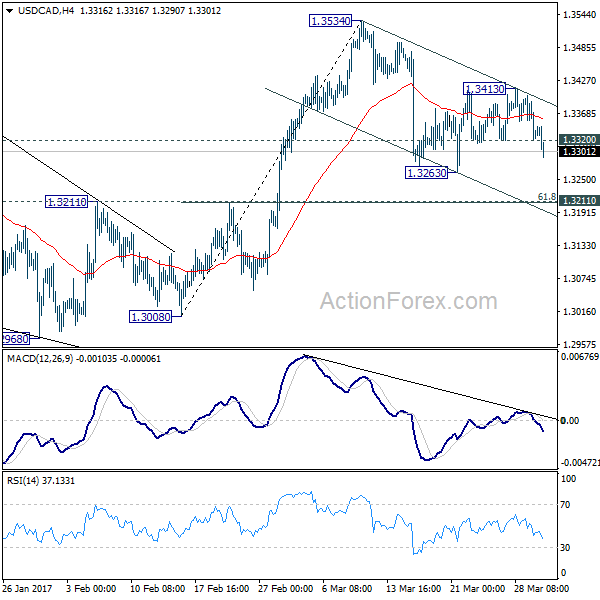
Current break of indicated support at 1.3326 signals the rebound from 1.3264 has ended and bearishness remains for test of this support, below there would add credence to our view that top has been made at 1.3535 earlier this month, bring further fall to 1.3235-40 (61.8% Fibonacci retracement of 1.3056-1.3535) and then 1.3200-10, however, oversold condition should limit downside and reckon 1.3170 would hold from here.
In view of this, we are looking to sell on recovery as 1.3340-50 should limit upside. Above 1.3400 would risk the stop resistance at 1.3415 but break there is needed to signal low is formed and shift risk back to upside for a stronger rebound to 1.3450 and possibly test of resistance at 1.3479, however, only break of 1.3495 resistance would indicate the pullback from 1.3535 has ended and bring retest of this level later.
To recap, wave B from 1.3066 is unfolding as an a-b-c and is sub-divided as a: 1.2192, b: 1.2716 and wave c is a 5-waver with i: 1.1983, ii: 1.2506, extended wave iii with minor iii at 1.0206, wave iv ended at 1.0781 and wave v as well as wave iii has ended at 0.9931, hence the subsequent choppy trading is the wave iv which is unfolding as (a)-(b)-(c) with (a) leg of iv ended at 1.0854, followed by (b) leg at 1.0108 and (c) leg as well as the wave iv ended at 1.0674. The wave v is sub-divided by minor wave (i): 0.9980, (ii): 1.0374, (iii): 0.9446, (iv): 0.9913 and (v) as well as v has possibly ended at 0.9407, therefore, consolidation with upside bias is seen for major correction, indicated target at 1.3700 and 1.4000 had been met and further gain to 1.4700 would be seen later.
EURUSD Hit Fresh 8-Day Low
The Euro fell further today, pressured by weaker-than-expected German inflation data and better-than-expected US GDP numbers that boosted the dollar.
The pair hit fresh 8-day low at 1.0719 so far and focusing strong support at 1.0700 (daily Kijun-sen/50% retracement of 1.0493/1.0905 upleg).
Studies on daily chart are still bullishly aligned and suggest that current correction should be ideally contained at 1.0700 zone.
On the other side, strong bearish sentiment is building up and sees risk of further easing, as the pair is on track for bearish weekly close, the first after four bullish weeks in a row.
Loss of 1.0700 handle would open a cluster of MA/Fibo supports which consist of 55; 30 and 100SMA and Fibo 61.8% of 1.0493/1.0905 rally that lies within 1.0672/26 zone.
Bounce from session low at 1.0719 is testing initial resistance at 1.0748 (broken Fibo 38.2% support) which guards session high at 1.0768 and upper pivot at 1.0783 (broken 10 SMA).
Only firm break above the latter would sideline existing downside threats and signal further recovery. Next upper trigger lies at 1.0812 (daily Tenkan-sen).
Res: 1.0768; 1.0783; 1.0812; 1.0825
Sup: 1.0719; 1.0700; 1.0672; 1.0650

Elliott Wave Analysis: Crude Oil Intraday View
We see crude oil ticking higher, now approaching 50.12 level of a former wave 4. But as things stand right now we see room for more upside in the future as leg from 47.05 looks impulsive. We are tracking wave three now which may find resistance at near-term levels, but bigger cycle suggests that energy may see rally even to 51.00. In the mean-time be aware of short-term retracements.
Crude OIL, 1H
U.S. Q4/16 GDP Growth Revised up to 2.1% in Third Estimate
Highlights:
- The upward revision to headline GDP was slightly stronger than expectations for a 2.0% reading
- Consumer spending growth was revised up to 3.5% from 3.0% in the second estimate (and 2.5% in the advance estimate). The build in inventories was also slightly larger with partial offset from moderately less net exports and non-residential business investment.
- Risks have increased that fiscal stimulus we've incorporated into our outlook later this year will not be as large as previously assumed. Nonetheless, we expect positive momentum in the economy will persist going forward at a pace that is strong enough to warrant further Fed interest rate hikes. Our forecast assumes 2 additional 25 basis point increases in the fed funds target range this year following the hike in March.
Our Take:
Although somewhat stronger than expected (and arguably with more encouraging details given the upgrade to consumer spending growth), changes in the third (and 'final') estimate of Q4 GDP growth were minor on balance and had little impact on our assessment of the underlying pace of growth in the economy which remained above-trend over the second half of last year. Looking ahead to Q1/17, growth in consumer spending appears to have slowed to a pace less than half of the average 3 1/2% increase over the last three quarters; however, continued strong improvement in labour markets and household incomes, low interest rates and surging consumer confidence all suggest that pause will be short-lived while tomorrow's monthly consumer spending report (which will provide the monthly detail behind the upward revision to quarterly consumer spending reported today) will provide more clarification on the extent to which upward revisions to Q4 spending are reflected in stronger momentum early in 2017 than has previously been reported. There also remains some downside risk to near-term growth from the often-volatile net trade and inventory components; however business fixed investment in Q1, encouragingly, looks on track to rise at its strongest pace in since Q3/14. On balance, data released to-date remains consistent with our forecast that GDP growth overall was little changed in Q1 at 2.0%.
USD/CAD Mid-Day Outlook
Daily Pivots: (S1) 1.3299; (P) 1.3349; (R1) 1.3378; More....
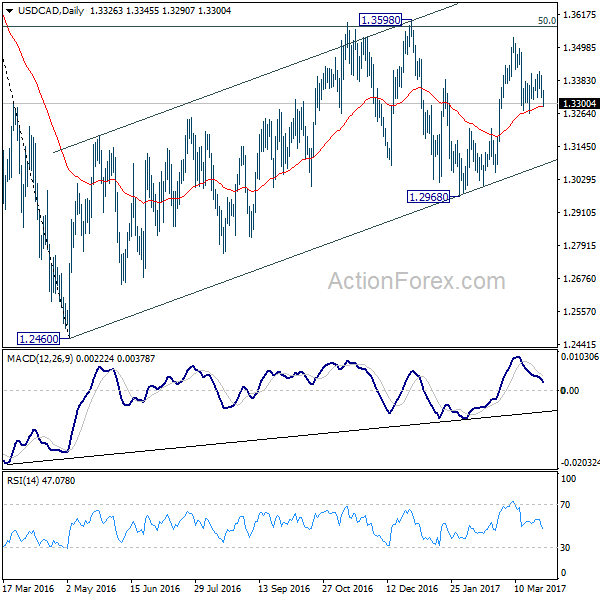
USD/CAD's break of 1.3220 minor support suggests that whole fall from 1.3534 is likely resuming. Intraday bias is turned back to the downside for 1.3263 and possibly below. Nonetheless, price actions from 1.3534 are viewed as a correction. Hence, we'd expect strong support from 1.3211 cluster level (61.8% retracement of 1.3008 to 1.3534 at 1.3209) to contain downside and bring rebound. On the upside, above 1.3413 will target a test on 1.3534 resistance first. Overall, rise from 1.2968 is expected to resume later to extend through the whole medium term rise from 1.2460 through 1.3598.
In the bigger picture, price actions from 1.4689 medium term top are seen as a correction pattern. The first leg has completed at 1.2460. The second leg is likely still in progress and could target 61.8% retracement of 1.4689 to 1.2460 at 1.3838. We'd look for reversal signal there to start the third leg. Break of 1.2968 wold at least bring at retest of 1.2460 low. However, sustained trading above 1.3838 would pave the way to retest 1.4689 high.
Trade Idea Update: USD/CHF – Buy at 0.9910
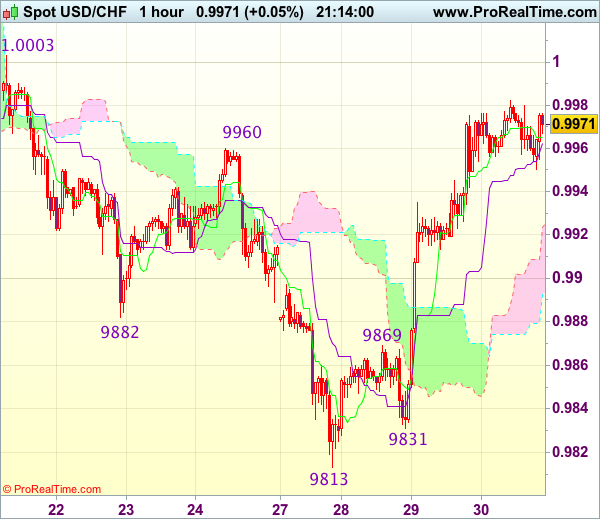
USD/CHF - 0.9954
Original strategy :
Buy at 0.9910, Target: 1.0010, Stop: 0.9875
Position : -
Target : -
Stop : -
New strategy :
Buy at 0.9910, Target: 1.0010, Stop: 0.9875
Position : -
Target : -
Stop : -
The greenback has continued trading with a firm undertone after this week’s rally from 0.9813, adding credence to our view that recent decline has ended at 0.9813, hence upside bias remains for this rise from 0.9813 to bring retracement of recent decline and further gain to resistance at 1.0003 would be seen but break there is needed to provide confirmation and retain bullishness for further rise to 1.0030 but previous support at 1.0060 should remain intact.
In view of this, would not chase this rise here and would be prudent to buy dollar on pullback as 0.9920-25 should limit downside. Below the upper Kumo (now at 0.9909) would suggest top is formed instead, bring weakness to the lower Kumo (now at 0.9879) but break of said support at 0.9831 is needed to revive bearishness for retest of 0.9813 first.