Sample Category Title
European Open Briefing
Global Markets:
- Asian stock markets: Nikkei up 0.60 %, Shanghai Composite and Hang Seng both rose 0.05 %, ASX 200 gained 0.10 %
- Commodities: Gold at $1240 (-0.35 %), Silver at $18.12 (-0.50 %), WTI Oil at $50.25 (-0.20 %), Brent Oil at $53.00 (-0.20 %)
- Rates: US 10-year yield at 2.42, UK 10-year yield at 1.12, German 10-year yield at 0.34
News & Data:
- Chinese Manufacturing PMI Mar: 51.8 (exp 51.6; prev 51.6)
- Chinese Non-Manufacturing PMI Mar: 55.1 (prev 54.2)
- Japanese Industrial Production (MoM) Feb P: 2.0% (exp 1.2%; prev -0.4%)
- Japanese Industrial Production (YoY) Feb P: 4.8% (exp 3.9%; prev 3.7%)
- Japanese Unemployment Rate Feb: 2.8% (exp 3.0%; prev 3.0%)
- Japanese Overall Household Spending (YoY) Feb: -3.8% (exp -1.7%; prev -1.2%)
- Japanese National CPI (YoY) Feb: 0.3% (exp 0.2%; prev 0.4%)
- Japanese National CPI Ex-Food, Energy (YoY) Feb: 0.1% (exp 0.1%; prev 0.2%)
- Australian Private Sector Credit (MoM) Feb: 0.3% (exp 0.5%; 0.2%)
- Australian Private Sector Credit (YoY) Feb: 5.0% (exp 5.3%; prev 5.4%)
- New Zealand ANZ Activity Outlook Mar: 38.8 (prev 37.2)
- New Zealand ANZ Business Confidence Mar: 11.3 (prev 16.6)
- New Zealand Building Consents (MoM) Feb: 14.0% (prev 0.8%)
- South Korean Industrial Production (MoM) Feb: -3.4% (exp -0.3%; prev 3.3%; rev prev 2.9%)
- South Korean Industrial Production (YoY) Feb: 6.6% (exp 8.0%; prev 1.7%; rev prev 1.4%)
- UK GfK Consumer Confidence Mar: -6 (exp -7; prev -6)
- PBoC Fixes USDCNY Reference Rate At 6.8993 (prev fix 6.8889; prev close 6.8886)
Markets Update:
The US Dollar appreciated after a stronger than expected US GDP number and hawkish talk from several FOMC members. EUR/USD fell below support at 1.07 and is likely to extend losses to 1.06 in the near-term. Meanwhile, USD/JPY rallied above 112 in Asia and reached 112.15 after the strong Chinese economic numbers were released. Offers are noted around 112.20. However, above that level, there is very little resistance until 112.80-85.
GBP/USD bounced yesterday, despite the broad Dollar strength. The pair briefly rallied above 1.25, and could test 1.26 resistance soon. Worries about Brexit are still present, but those are rather medium- to long-term. In the short-term, traders are more concerned with the UK economic numbers and what the Bank of England will do.
Flows in the commodity currencies remain very light. AUD/USD and NZD/USD have barely moved this week. Even USD/CAD is consolidating in a rather tight range, despite the increased volatility in Oil prices.
Upcoming Events:
- 07:00 GMT – German Retail Sales
- 07:45 GMT – French CPI
- 09:00 GMT – German Unemployment Rate
- 09:30 GMT – UK GDP
- 10:00 GMT – Euro Zone CPI
- 10:00 GMT – Italian CPI
- 13:30 GMT – US Core PCE Price Index
- 13:30 GMT – US Personal Income
- 13:30 GMT – US Personal Spending
- 13:30 GMT – Canadian GDP
- 15:00 GMT – US Michigan Consumer Sentiment
Market Morning Briefing
STOCKS
Dow (20728.49, +0.33%) rose a bit yesterday and could re-test 21200 resistance on the upside in the next week. Immediate upside could be limited just now.
Dax (12256.43, +0.44%) has moved up in line with our expectation, breaking above 12220. Immediate resistance is visible near 12300 which if holds could push the index down to 12100 in the early next week before it again picks up the upward momentum.
Nikkei (19204.70, +0.74%) is trading higher but overall remains stable. Trade within 19350-19000 over the next couple of sessions is possible.
Shanghai (3223.28, +0.41%) bounced back slightly from levels near 3200 led by a rise in the shipping and infrastructure stocks. Support near 3150 could be tested if 3200 breaks on the downside; else we could see the index move up towards 3250-3275 in the next week.
Nifty (9173.75, +0.33%) could be headed towards 9200-9280 as mentioned yesterday. Near term channel uptrend remains intact and the index looks bullish for the coming week.
COMMODITIES
A stronger Dollar (100.56) has affected all the metals but Crude keeps strong for the week.
Gold (1240.96) has been dragged down to the lower end of the near term range of 1240-60 by the Dollar strength and a break below 1240 may pull it down lower towards 1225-20 levels. The weakness may persist till the resistance 1260 is overcome.
With the Gold-Silver ratio (68.61) crashing in the last few days, Silver (18.06) has been less affected by a stronger Dollar and trades comfortably in the range of 17.82-18.35, which may continue for a couple of sessions more.
Copper (2.668) has been stuck in the range of 2.55-2.70 for 4th consecutive week running with no visible intent for a breakout. The horizontal trading may go on for another week.
Expectation of prolonging the production cut by a few OPEC countries like Kuwait keeps driving Brent (52.82) and WTI (50.13) higher. The target of 53.36 for Brent is close while WTI may test the near term resistance 50.80-51.10.
FOREX
With a few members of the Fed taking a more hawkish stance with talks of more than 3 rate hikes this year, Dollar has got a boost.
Dollar Index (100.53) has rallied just as expected and the targets of 100.70-101.00 may be achieved within the next 2-3 sessions with immediate support coming up at 99.90.
Euro (1.0680) has weakened much more than expected as it trades below 1.07 levels. If the support of 1.065 fails to hold now, then deeper levels of 1.0580, even 1.0500 may come into consideration in the near term.
A rise in Core Consumer prices for the second consecutive month and the lowest reading in the unemployment data in the last 22 years have driven Dollar-Yen (112.02) above the resistance of 111.50-60 as expected and now a break above the interim resistance of 112.15 may push it higher towards 112.80 and 113.40.
Pound (1.2486) is firming up the range of 1.2350-1.2600 in which it may trade horizontally for the next few sessions with no directional bias.
Aussie (0.7645) has been the quietest currency in the last couple of sessions and the current trendless state may prolong the sideways consolidation in the range of 0.7600-0.7750.
Dollar Rupee (64.92) enjoyed a pause day yesterday but the current price of 64.85 in the NDF market indicates no impact of global Dollar strength on the pair. Our target/support remains unchanged in 64.80-60 and resistance at 65.00 and 65.20.
INTEREST RATES
The US-UK 10yr (-1.30%) continues to fall and may test levels near -1.38% in the coming sessions. While the yield spread moves lower, Pound may either consolidate sideways or move lower to re-test 1.23-1.21 again in the medium term.
The German-Japan 10Yr (0.26%) has been falling from resistance near 0.40% and looks bearish in the near term, indicating a weaker Euro against Japanese Yen in the near term.
The US-Japan 10YR (2.35%) is holding above the immediate support and while that holds, it could move higher towards 2.4% taking up dollar-Yen and Nikkei with itself.
The 10Yr GOI (6.866%) could test levels near 6.80-6.78% before bouncing back to higher levels. This fall towards 6.78% could lead to some more Rupee strength in the near term.
EUR/CAD Pullback
Following this daily EUR/CAD support level that we featured on the blog back in February, longs were the obvious play and traders obliged.
But after a 750 pip rally, the pullback as the longs started to cover hit. Something you can then clearly see with a 350 pip straight line drop from the last swing high.
From a technical point of view however, nothing has actually changed. Price is still above the higher time frame support level and if you perceive this latest fall as healthy long covering then you expect the shorts to be absorbed and a new push higher.
Taking a look at the daily chart now, look I want to highlight where price has pulled back to now:
EUR/CAD Daily:
This is a nice little area of interest that has acted as short term support/resistance in the past and if you subscribe to the above opinion of this just being a healthy pullback then this is an area to watch how buyers react within.
Just keep in mind that you can see around 175 pips below the marked level, there is another one of these areas of interest. Wait and see how price reacts around them, but if you’re still long from the daily support level, then you have the pips and room to use either of these levels to manage your risk around if you add into your position.
Gold Slips Below $1250 on Strong GDP Report
Gold has posted losses in the Thursday session. In North American trade, gold is trading at $1245.17 per ounce. On the release front, US Final GDP posted a gain of 2.1%, edging above the estimate of 2.0%. Unemployment claims jumped to 258 thousand, well above the forecast of 244 thousand. On Friday, we'll get a look at consumer confidence levels, with the release of UoM Consumer Sentiment.
It's been a rough-and-tumble start for the Trump administration, which has been beset by controversy and crises since Trump assumed office in January. Trump has yet to provide any details of an economic policy, to the consternation of the markets. Last week, Trump's proposed healthcare bill was dead on arrival before even being voted on, a humiliating defeat for the president. This setback has made the markets even more jittery about Trump, and the inquiry into the Trump administration's links with Russia is gathering steam, which is another cause for concern for nervous investors. Trump has said he will now focus on tax reform, but the White House will need to improve coordination with Republican lawmakers to ensure that his next attempt to pass legislation is not a repeat of the healthcare debacle. Still, despite all of Trump's difficulties, he can at least point to a strong US economy, which shows no signs of slowing down. GDP in the first quarter was revised upwards to a respectable 2.1% and the labor market remains very strong. The markets may be looking for the Federal Reserve to be more aggressive, but the central bank is on course to raise rates twice more in 2017, a testament to an economy heading in the right direction.
West Texas Crude Hits 3-Week High as OPEC Looks to Extend Production Cuts
West Texas crude has moved higher for a third straight day, punching past the symbolic $50 level for the first time since March 9. In Thursday's North American session, WTI crude futures are trading at $50.38. Brent Crude futures have climbed to $52.98, as the Brent premium has narrowed to $2.60. On the release front, US Final GDP posted a gain of 2.1%, edging above the estimate of 2.0%. Unemployment claims jumped to 258 thousand, well above the forecast of 244 thousand. On Friday, we'll get a look at consumer confidence levels, with the release of UoM Consumer Sentiment.
Crude oil has strengthened this week, but prices are still down sharply in March. The markets remained concerned about a global oil glut, as increasing US production has offset OPEC production cuts. US Crude Inventories continue to show surpluses, most of which have been higher than the forecast. Although another surplus was recorded last week, the reading of 0.9 million was slightly smaller than the estimate of 1.2 million. Still, total US crude inventories have reached an all-time high of 534.0 million barrels, so oil prices may have trouble staying above the $50 level. OPEC has hinted that it may extend its production cut deal past June for another six months. So far, OPEC has come up empty-handed, as oil prices have slipped since the agreement took effect on January 1.
It's been a rough-and-tumble start for the Trump administration, which has been beset by controversy and crises since Trump assumed office in January. Trump has yet to provide any details of an economic policy, to the consternation of the markets. Last week, Trump's proposed healthcare bill was dead on arrival before even being voted on, a humiliating defeat for the president. This setback has made the markets even more jittery about Trump, and the inquiry into the Trump administration's links with Russia is gathering steam, which is another cause for concern for nervous investors. Trump has said he will now focus on tax reform, but the White House will need to improve coordination with Republican lawmakers to ensure that his next attempt to pass legislation is not a repeat of the healthcare debacle.
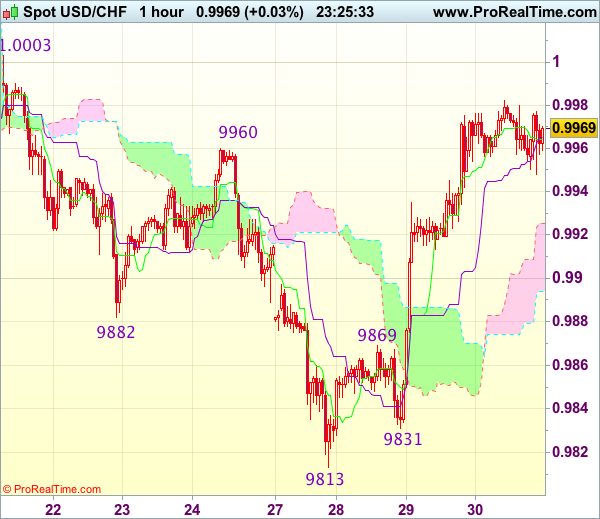
Trade Idea Wrap-up: USD/CHF – Buy at 0.9910
USD/CHF - 0.9966
Most recent candlesticks pattern : N/A
Trend : Near term up
Tenkan-Sen level : 0.9964
Kijun-Sen level : 0.9965
Ichimoku cloud top : 0.9925
Ichimoku cloud bottom : 0.9894
Original strategy :
Buy at 0.9910, Target: 1.0010, Stop: 0.9875
Position : -
Target : -
Stop : -
New strategy :
Buy at 0.9910, Target: 1.0010, Stop: 0.9875
Position : -
Target : -
Stop : -
The greenback has continued trading with a firm undertone after this week’s rally from 0.9813, adding credence to our view that recent decline has ended at 0.9813, hence upside bias remains for this rise from 0.9813 to bring retracement of recent decline and further gain to resistance at 1.0003 would be seen but break there is needed to provide confirmation and retain bullishness for further rise to 1.0030 but previous support at 1.0060 should remain intact.
In view of this, would not chase this rise here and would be prudent to buy dollar on pullback as 0.9920-25 should limit downside. Below the upper Kumo (now at 0.9909) would suggest top is formed instead, bring weakness to the lower Kumo (now at 0.9879) but break of said support at 0.9831 is needed to revive bearishness for retest of 0.9813 first.
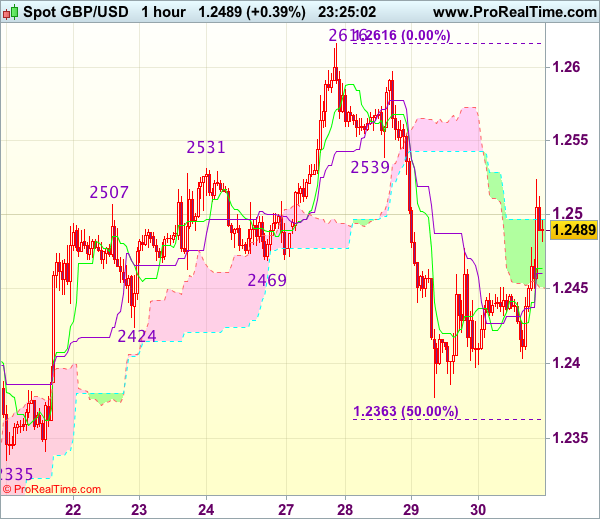
Trade Idea Wrap-up: GBP/USD – Stand aside
GBP/USD - 1.2485
Most recent candlesticks pattern : N/A
Trend : Near term up
Tenkan-Sen level : 1.2464
Kijun-Sen level : 1.2461
Ichimoku cloud top : 1.2497
Ichimoku cloud bottom : 1.2451
New strategy :
Stand aside
Position : -
Target : -
Stop : -
As cable has rebounded in NY morning, suggesting near term upside risk remains for the corrective bounce from 1.2377 (yesterday’s low) to extend gain to 1.2520-25, however, break of previous support at 1.2539 is needed to signal the fall from 1.2616 has ended, bring further rise to 1.2555-60 but reckon upside would be limited to 1.2595-00 and price should falter below resistance at 1.2616.
In view of this, would not chase this rise here and would be prudent to stand aside in the meantime. Below 1.2450-55 would suggest an intra-day top is possibly formed, bring weakness to 1.2425-30 but break of 1.2395-00 is needed to signal the rebound from 1.2377 has ended, brig retest of this level, then 1.2360-65 (50% Fibonacci retracement of 1.2109-1.2616), however, support at 1.2335 should limit downside and reckon 1.2300-05 (61.8% Fibonacci retracement) would hold.
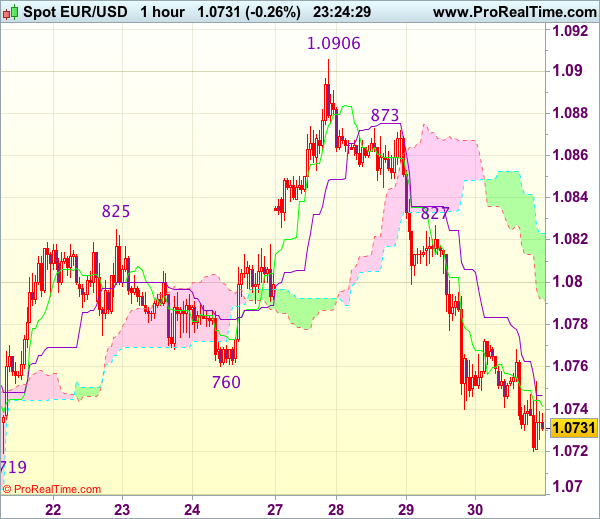
Trade Idea Wrap-up: EUR/USD – Sell at 1.0800
EUR/USD - 1.0727
Most recent candlesticks pattern : N/A
Trend : Near term up
Tenkan-Sen level : 1.0742
Kijun-Sen level : 1.0747
Ichimoku cloud top : 1.0823
Ichimoku cloud bottom : 1.0792
Original strategy :
Sell at 1.0820, Target: 1.0720, Stop: 1.0855
Position : -
Target : -
Stop : -
New strategy :
Sell at 1.0800, Target: 1.0700, Stop: 1.0835
Position : -
Target : -
Stop : -
As the single currency has remained under pressure after this week’s selloff from 1.0906 top, suggesting bearishness remains for further decline towards previous support at 1.0719, however, break there is needed to retain downside bias and signal recent rise has ended at 1.0960, then further weakness to 1.0695-00 and possibly 1.0670 would be seen but oversold condition would limit downside and reckon 1.0650 would hold from here, risk from there is seen for a rebound to take place later.
In view of this, would not chase this fall here and would be prudent to sell dollar on recovery as 1.0827 resistance should limit upside and bring another decline. Above 1.0845-50 would abort and signal the fall from 1.0906 has ended instead, bring test of 1.0873 resistance first.