Sample Category Title
Canada 2017 Federal Budget: Stay the Course Budget – Expected and Delivered
Overview
Today's Heading into Budget 2017 expectations were for a stay-the-course budget with little in the way of new initiatives. In the event, this is largely what the government delivered with a few more details announced around their spending plans and a couple of modest initiatives aimed at spurring innovation in the economy. This 'restraint' largely reflects their stretched fiscal position. Following substantial spending initiatives announced in last year's budget and the ensuing fall statement, the fiscal path is now one of deficits as far as the eye can see. Earlier talk of balancing the budget has been long forgotten and had been replaced by a goal of reducing the debt-to-GDP ratio which is a much less stringent goal. Unfortunately this trend of a weakening fiscal resolve continued as today's budget dropped the debt-to-GDP target altogether. Over the next 6 years the debt-to-GDP ratio is expected to move sideways, ending at 30.9% of GDP and an additional $141 billion in federal debt.
This unchecked spending had prompted concerns within the federal government of revenue shortfalls seemingly missing the point that it is of their own doing. Thankfully no major tax increases were announced in today's budget. However, this good fortune could be temporary as any disappointing surprises in the economic outlook could derail the government's fiscal plan necessitating higher taxes to fill a deepening fiscal hole.
Fiscal Balance Projections
The deficit profile indicated in Budget 2017 is little changed from what was indicated in the 2016 fall statement. The deficit is marginally lower in fiscal 2016/17 at $23.0B relative to $25.1B indicated last fall. The smaller deficit reflects both lower program spending and public debt charges and higher revenues. Beyond fiscal 2016/2017, the deficits are generally higher. The fiscal 2017/18 deficit rises to $28.5B and compares to $27.8B in the fall statement. The deficit then steadily trends lower through the medium term dropping to $18.8B by fiscal 2021/22. However, the profile is consistently above the profile indicated in the fall. Cumulatively the deficit is higher by $13.3B over the next six fiscal years. This higher profile could be attributed to the reintroduction of a $3.0B 'adjustment for risk' over the five fiscal years from 2017/18 to 2021/22. The budget did indicate increased infrastructure spending though this has largely been financed by reallocating funds that had previously been allocated for infrastructure in Budget 2016 but not spent. The federal government is still of the view that this spending will contribute to a sizeable 0.4 percentage point lift to Canadian growth in fiscal 2016/17. Budget 2016 had talked about a ½ per-centage point lift over each of the next two fiscal years. Budget 2017 did not opt for any major tax changes. There was no change to the capital gains tax that had been widely speculated upon as a tax rate that could be raised. The prospect of potential tax cuts in the U.S. possi-bly stayed the federal government's hand as it opted not to unduly hamper the ability of the Canadian economy to attract and retain workers.
Initiatives
Increased infrastructure spending was most evident in spending for community building which saw spending boosted $20.6B over the next six years. This included various housing initiatives that will see increased spending of $5.3B. The lion's share of this spend-ing is for expanding and/or improving the housing stock. (This total also included a welcome, albeit small $40 million over five years, increase in funding to Statistics Canada to establish a Housing Statistics Framework that will better identify factors driving housing market dynamics and thus facilitate designing the appropriate policy response.) Another major initiative was increased spending of $8.3B over the medium term for enhancing skills development of Canadian workers. The other major area of increased spending of $8.2B was largely focussed on improving health care for Canadians. Within these spending areas the federal government stressed it was trying to address various gender imbalances by allocating, over the next 11 years, $7B towards "early learning and child care and over $11.2B towards a National Housing Strategy."
Fiscal Savings
A lion's share of these new initiatives were largely financed by reallocating funds that had been previously been budgeted but not spent. Over the next six years this represented a freeing up of a cumulative $27.1B. Another $4.7B in savings was projected to be sourced by increasing tax fairness via measures such as closing tax loopholes and better policing of tax evasion (although the public transit tax credit will also be eliminated). Budget 2017 did not propose any major tax changes.
Fiscal Overview
The downward trend in the deficit from the projected peak in fiscal 2017/18 of $28.5B to $18.8b in fiscal 2021/22 is the result of revenues rising 4.0% per-year while program expenses increase by a lesser 2.6%. To some extent spending over these four years is restrained by front end loading a sizeable 7.4% surge in 2016/17 program spending. The rise in revenues over the forecast period is facilitated by nominal GDP growth projected to almost double over the period 2017 through 2021 to 4.3% from the 2.3% achieved in 2016. The rise in this growth rate in large part reflects the recovery oil prices over the forecast. RBC's near-term nominal GDP growth outlook assumes an even stronger 4.8% over the next two years. Stronger nominal GDP growth would imply an even faster pace of revenue growth. This issue left unanswered in Budget 2017 is whether any fiscal savings will be used to pay down the debt more quickly as opposed to providing scope to raise expenditures further.
Financing Requirements
Financial requirements are set to rise to C$38.7bn in FY17/18 from a downwardly revised C$21.0bn in FY16/17, with the latter largely due to a smaller deficit than in the FES and a higher gain in the non-budgetary category "Pensions and other accounts" than previously projected. In terms of GoC bond issuance, we should see a record C$142bn in issuance (~C$7bn more than in FY16/17), though with very few changes to the program and continued emphasis on short- and medium-term bond (83% in maturities 5-years and under). Looking ahead, the Government is projecting C$167.4bn in financial requirements from FY17/18 through FY21/22. This, along with rising bond maturities, will prompt a decision from the DoF/BoC on whether to further increase short-term bond issuance or term out somewhat (or a combination of the two).
Canada 2017 Federal Budget – Back to Business as Usual
Highlights
- The government expects to run a deficit of $28.5 billion (about 1.3% of GDP) in the coming fiscal year, roughly in line with 2016 budget projections.
- Deficits continue over the forecast horizon, declining somewhat in size. The result is a level of federal debt expected to settle around 31% of GDP by fiscal 2021.
- Digging into the details revealed a largely business as usual budget, focused on continuing to implement the sizeable promises made in Budget 2016. Only $4.4 billion in net new spending is planned over a five year horizon.
- Notable by their absence were any major changes to the tax system. Small tweaks were made around the edges, but the capital gains inclusion rate was left untouched, as were other major tax rates.
- While some might have been hoping for significant changes in policy, the cautious approach shown today appears warranted. Big spending measures from last year still need to be implemented, while global and domestic economic uncertainty remains elevated.
Last year's budget was a big bang on tax and spend initiatives. This year, not so much. The government announced a net $4.4 billion in new initiatives over a five year period. For comparison, this is roughly one-fifth the amount announced last year, spread over a longer timeframe. Hot-button issues, such as changes to the capital gains tax and the potential sale of airports, were not acted upon. This budget was more about trimming the edges on labour market and tax inefficiencies. By applying conservative assumptions on economic growth, the government shows a debt-to-GDP ratio that holds steady, edging down only modestly from 31.5% to 30.9% by 2021/22. This is a market-neutral budget, with nothing of note to rattle financial markets.
Just a bit more borrowing
The near term outlook for the federal deficit has improved (Chart 1), with a budgetary balance of -$23 billion forecast for the current fiscal year. Relative to what was presented in last year's 5-year plan, slightly wider deficits are projected in Budget 2017, resulting in a modest $6.4 billion in net additional borrowing over the 2015/16 to 2020/21 period.
Underpinning these projections are more conservative assumptions on the future pace of economic growth. This stems from the use of a somewhat outdated survey (from December 2016; Table 1), which doesn't capture the significant improvement in the near-term economic outlook, and thus likely overstates the near-term deficit outlook. Conversely, the December survey does appear to better reflect the medium-term growth headwinds facing Canada, presenting a lower long-term growth profile than that used in Budget 2016.
Even this slower profile does not fully reflect the longerterm headwinds facing Canada. TD Economics remains of the view that growth is likely to trend closer to 1.4% in coming years, creating a potential fiscal headwind. Perhaps reflecting this, the government has reintroduced a 'risk adjustment', adding $3 billion per year to the projected deficit from fiscal 2017/18 onwards. This, in combination with the government's growth outlook, suggests that near-term deficits may come in smaller than what has been indicated today.
Persistent deficits
A largely unchanged deficit outlook means that there remains nothing but red ink on the horizon. The size of the deficits are fairly small in the grand scheme of things, and the federal debt-to-GDP ratio is set to stabilize through time, settling at around 31% of GDP by fiscal 2021-22 (Table 2). Despite this, gone from today's budget are explicit references to a target level of the debt ratio. While the best fiscal anchor could be debated (we would suggest a modestly declining debt-to-GDP ratio as a reasonable target), having a fiscal anchor, whatever it may be, provides reassurances to markets that some form of fiscal restraint is in place. A return to an explicit anchor would thus be a welcome development.
Spending what was planned
Today's budget is largely focused on implementing existing promises. The government made significant spending commitments in key areas such as housing, but the bulk of the funds allocated are back-end-loaded. The rubber hits the road over the five year fiscal horizon, where only $5.2 billion in net new spending was introduced in today's budget, as the impact of newly announced measures were offset by shifting funds from other areas. For instance, the government announced $6.6 billion in planned spending to support skills and innovation. But, once the reshuffling of pre-existing commitments is taken into account, the net impact on the deficit is expected to be $2.9 billion. In some areas, the government has actually reduced its planned spending (on net) over the near-term horizon. These include what the government calls "Communities Built for Change", such as infrastructure spending, early learning and childcare initiatives, and indigenous communities.
When it comes to existing spending commitments, the government provided an indication of progress to date. Most major areas are reported to be largely on track (in terms of Budget 2016 commitments), with the exception of infrastructure spending, where only 50% to 75% of projects are reported to be on track. From an economic growth perspective, even this statistic may be somewhat misleading, as it tracks cash disbursements, not shovels in the ground. Indeed, data from Infrastructure Canada indicates that only a small fraction of projects approved since the time of last year's budget have actually begun construction. Thus TD Economics remains of the view that the majority of the growth impact from existing spending commitments is yet to come, and will extend into 2018 given delays already observed.
Nothing comprehensive, but some tax tweaks in the offing
The federal government had been planning a comprehensive tax expenditure review, but it was not to be found in today's budget. Nor were changes to the inclusion rate for capital gains, or the treatment of stock option compensation. Still, many tweaks around the edges were brought into play. Key among these:
- Elimination of the public transit tax credit
- The tax credit for oil and gas exploration is being tweaked to gradually decline over time, rather than deducted immediately
- The alcohol tax will be nudged up immediately, and continue to increase in line with the pace of consumer inflation.
- The definition of a taxi service is to be changed such that ridesharing services such as Uber are taxed in the same way as traditional taxi services.
- Last year's increase in CRA vigilance will be met with a further budget increase aimed at cracking down on tax evasion.
The cautious approach to the tax system shown today is likely warranted in light of the significant uncertainty emanating from south of the border. Discussions and negotiations are underway that could result in significant reductions in U.S. corporate tax burdens, impacting Canada's current competitive advantage. At the same time, it would have been unusual to see significant changes around capital gains or stock options as part of a budget focused on innovation. Ultimately though, while caution was today's watchword, this is not the end of the story. It would hardly be surprising to see the tax system revisited once there is more certainty around Canada's relative competitiveness on this front.
Innovation a focus
As was communicated heading into the budget, a significant portion of the document was devoted to Canadian innovation. Measures included funds aimed at supporting innovation "superclusters", the creation of a "Strategic Innovation Fund" that consolidates and expands a number of existing funds and initiatives, and spending to support Clean- Tech and AgTech development. A focus was also placed on support for skills training. A welcome development is a change to the EI qualification system, allowing EI recipients to pursue education without losing their EI payments.
Potential market reaction
Ahead of the budget, rumours were swirling around potential tax changes - particularly the treatment of capital gains. In the event, no major changes were in the offing, with the changes that were put in place generally consisting of minor tweaks. As a result, it is unlikely that today's budget will have any meaningful market impact.
The theme of minor tweaks extends to the debt management strategy. Reflecting the modest spending commitments, gross bond issuance is expected to reach $142 billion in fiscal 2017-18, an increase of $7 billion from the year prior. The focus is likely to remain again on shorter-term debt (2-, 3-, and 5-year bonds), and no changes to the target maturity pattern or benchmark sizes are planned. There is no explicit plan, but the government again indicated a willingness to issue ultra-long maturity bonds on a 'tactical' basis.
Bottom Line
Ultimately, what the government delivered felt more like a fiscal update than a budget. Little was on offer in terms of new spending, while at the same time much of the concern around significant tax changes proved misplaced. This lack of excitement may not be a bad thing. The economic landscape remains shrouded by uncertainty, presenting a strong case for today's wait and see approach.
Still The SPI200 Top Holds
It's exactly one month ago we looked at this SPI200 double top:
SPI200 Daily:
Daily resistance that you can see has held for now, printing a pretty obvious double top in the process.
I'll let you zoom out a little further yourself to see the previous price action at this level back in 2015, but price is most definitely also pushing into a larger zone of interest in any case.
Fast forward into the present and you can see we're back up to the level for the 3rd time recently.
Still the level holds!
SPI200 Daily:
It has been a couple of days since the 3rd touch and with the latest bout of global turmoil we are waking up to here in Asia, stocks could well come under further pressure.
When technical levels hold, fundamental events or releases always compound the move.
Preparing For The Trump Tantrum
Preparing for the Trump Tantrum
US equities recovered moderately after the sharp decline yesterday; investors were in buy the dip mode during a rare US equities market pull back. Despite the amount of ink spilt over the health care vote, fundamentally the US economic landscape looks bright, and investors were quick to snap up bargains. However, news of the deplorable terrorist attack in London held the upward momentum in check. US Congress will vote on the AHCA tonight, and with Republicans still approximated to be lacking the need votes, the Trump administration’s backroom negotiation skills will be put to the test whipping up the required tally to secure the 216 votes to pass. However, 12 hours is a decade in political time, and things can change in a heartbeat IN other markets, JPY has been the biggest beneficiary of the haven rally while Industrial commodities had another weak session led by declines in both Copper and Iron Ore
Handy Tool from the New York Times to monitor the House vote on Obamacare Replacement
Australian Dollar
The Aussie dollar has opened firmer at .7675 this morning after plummeting to .7640 overnight as investors were more than willing to buy the long-awaited dip in US stocks, supporting risk appetite. On the surface, it would appear that the Aussie dollar has been doing little more than been echoing broader risk appetite.But the Aussie was also the beneficiary of the weaker US housing data as, despite two rate hikes since December, the market still views the Fed as dovish and the weaker than expected housing data supported this bias.
On the Iron ore front, prices were dealt another blow when Chinese press reported 16 Beijing Banks had raised their mortgage rates.
Japanese Yen
USDJPY teased with 111.00 level on Haven flow. With the weak US housing data, along with a sagging USD, it took little more than a feather duster sweep to take out support. This triggering stops on the way to 110.80 before the pair regained some composure and for risk appetite to re-emerge.
The USDJPY has opened bid in APAC with convictions apparently tied to the emerging news out of the Whitehouse that the Team Trump is considering some concession to the AHCA that would appeal to the House Freedom Caucus.
Worth keeping an eye on the headlines as so far only USDJPY desks have taken the bait, but the tail is for broader risk appeal
New Zealand Dollar
RBNZ released its policy rate (the OCR) will remain at 1.75%, as was widely expected by the market. IN typical knee-jerk fashion, and one can never be sure why the Kiwi sold off 20 pips before pulling back. After glossing over the accompanying statement, there is nothing to suggest a change in the Bank’s neutral bias. Inflation is still expected a return to the midpoint of the Bank’s target range over the medium term, but the release was far from a game changer and failed to surprise the market one way or the other.
EURO
The market continues to consolidate at the top of the recent ranges as dealer remains on edge ahead of Thursday healthcare vote. With little on the economic calendar, traders remain glued to the shifting tides of the health care negotiations and how that parlays into risk appetite.
China
US healthcare headlines are hogging the headline overshadowing the biggest l storyline. The seven-day repo fixing rates in China have spiked higher but small lenders are reported to have missed payments in the interbank market early in the week, and shadow banks are having difficulty in receiving funding promoting the Pboc temporary liquidity injections
The increase in Repo rates can be explained away as the Pboc attempting to control financial asset bubbles and perhaps influence the Yuan However if there are ongoing issues with shadow banks missing payments red flags will go up indicating something deeper rooted is amiss. I suspect this will present considerable regional headwinds if steamrolls.
(RBNZ) Official Cash Rate Unchanged at 1.75 percent
The Reserve Bank today left the Official Cash Rate (OCR) unchanged at 1.75 percent.
Macroeconomic indicators in advanced economies have been positive over the past two months. However, major challenges remain with on-going surplus capacity in the global economy and extensive geo-political uncertainty.
Global headline inflation has increased, partly due to a rise in commodity prices, although oil prices have fallen more recently. Core inflation has been low and stable. Monetary policy is expected to remain stimulatory, but less so going forward, particularly in the US.
The trade-weighted exchange rate has fallen 4 percent since February, partly in response to weaker dairy prices and reduced interest rate differentials. This is an encouraging move, but further depreciation is needed to achieve more balanced growth.
Quarterly GDP was weaker than expected in the December quarter, but some of this is considered to be due to temporary factors. The growth outlook remains positive, supported by on-going accommodative monetary policy, strong population growth, and high levels of household spending and construction activity. Dairy prices have been volatile in recent auctions and uncertainty remains around future outcomes.
House price inflation has moderated, and in part reflects loan-to-value ratio restrictions and tighter lending conditions. It is uncertain whether this moderation will be sustained given the continued imbalance between supply and demand.
Headline inflation has returned to the target band as past declines in oil prices dropped out of the annual calculation. Headline CPI will be variable over the next 12 months due to one-off effects from recent food and import price movements, but is expected to return to the midpoint of the target band over the medium term. Longer-term inflation expectations remain well-anchored at around 2 percent.
Monetary policy will remain accommodative for a considerable period. Numerous uncertainties remain, particularly in respect of the international outlook, and policy may need to adjust accordingly.
Existing Home Sales Decline Modestly in February
Existing homes sales fell 3.7 percent in February to a 5.48-million unit pace. Home sales are now more in line with pending sales, which had fallen in recent months. Inventories rose slightly but remain unusually lean.
Home Sales Are Still Off to a Strong Start
Existing home sales slipped 3.7 percent in February but are still off to a strong start to the year. The decline was somewhat expected following January's surprisingly strong 3.3 percent increase but February's report did come in slightly below the consensus estimate and our own lower call. Sales have averaged a 5.56-million unit pace over the past three months and remain above their year ago levels nationally and at all four regional levels.
We were expecting sales to come in below consensus, largely due to recent declines in pending home sales, which are contracts for the purchase of an existing home. Pending sales do a reasonably good job of anticipating the future direction of existing home sales but tend to overstate the magnitude of swings, particularly when you get a big down month like we did in January, when pending home sales tumbled 2.8 percent. Most of the drop in pending sales was in the West, which tumbled 9.8 percent, and the Midwest, which fell 5.0 percent. Both areas saw the return of more typical winter weather following milder weather in January. We do not expect existing home sales to precisely follow pending sales lower, just as they did not precisely follow them higher when pending sales spiked early last year.
Lean Inventories Make This a Sellers' Market
February's dip in home sales allowed inventories to rebound somewhat. For-sale inventories rose 4.2 percent to 1.75 million homes. But even with the gain, the number of homes available for sale remains 6.4 percent lower than it was one year ago, continuing a string of year-to-year drops that stretches back 21 months. Relative to sales, there is now a 3.8-month supply of homes available for sale. A balanced market would have around a 5.5-month supply.
With overall inventories as low as they are, sellers are selling their homes very quickly. The typical home sold in February was on the market for just 45 days, which compares to 59 days one year ago. Moreover, 42 percent of the homes sold in February were on the market for one month or less. The hottest markets remain mostly in the West, including San Francisco, Seattle and Denver, where strong job growth in the tech sector and limited new construction has kept inventories incredibly lean.
By region, sales tumbled 13.8 percent in Northeast, fell 7.0 percent in the Midwest and declined 3.1 percent in the West. The South, which is by far the largest region for existing home sales, saw sales rise 1.3 percent, likely reflecting strong demand in Florida, Texas, Georgia and the Carolinas.
The median price of an existing home rose 7.7 percent over the past year. Prices are up the most in the West and South, where they are 9.6 percent higher than one year ago. By contrast, the median price of a home is up 6.1 percent over the past year in the Midwest and 4.1 percent in the Northeast.
Elliott Wave Analysis: EURAUD Looking For More Upside
EURAUD just broke to a new high ideally now in fifth wave up trying to push prices towards 1.4150/60 area for an extended red wave 3).
EURAUD, 1H
What’s Next for the Dollar, Gold & Stocks?
Two rate hikes since last year have weakened the dollar. Why is that, and what's ahead for dollar, currencies & gold? And while we are at it, we'll chime in on what may be in store for the stock market...
Stocks...
The chart above shows the S&P 500, the price of gold and the U.S. dollar index since the beginning of 2016. The year 2016 started with a rout in the equity markets which was soon forgotten, allowing the multi-year bull market to continue. After last November's election we have had the onset of what some refer to as the Trump rally. Volatility in the stock market has come down to what may be historic lows. Of late, many trading days appear to start on a down note, although late day rallies (possibly due to retail money flowing into index funds) are quite common.
Where do stocks go from here? Of late, we have heard outspoken money manager Jeff Gundlach suggests that bear markets only happen if the economy turns down; and that his indicators suggest that there's no recession in sight. We agree that bear markets are more commonly associated with recessions, but with due respect to Mr. Gundlach, the October 1987 crash is a notable exception. The 1987 crash was an environment that suffered mostly from valuations that had gotten too high; an environment where nothing could possibly go wrong: the concept of "portfolio insurance" was en vogue at the time. Without going into detail of how portfolio insurance worked, let it be said that it relied on market liquidity. The market took a serious nosedive when the linkage between the S&P futures markets and their underlying stocks broke down.
I mention these as I see many parallels to 1987, including what I would call an outsized reliance on market liquidity ensuring that this bull market continues its rise without being disrupted by a flash crash or some a type of crash awaiting to get a label. Mind you, it's extraordinarily difficult to get the timing right on a crash; that doesn't mean one shouldn't prepare for the risk.
Bonds...
If I don't like stocks, what about bonds. While short-term rates have been moving higher, longer-term rates have been trading in a narrow trading range for quite some time, frustrating both bulls and bears. Bonds are often said to perform well when stock prices plunge, but don't count on it: first, even the historic correlation is not stable. But more importantly, when we talk with investors, many of them have been reaching for yield. We see sophisticated investors, including institutional investors, provide direct lending services to a variety of groups. What they all have in common is that yields are higher than what you would get in a traditional bond investment. While the pitches for those investments are compelling, it doesn't change the fact that high yield investments, in our analysis, tend to be more correlated with risk assets, i.e. with equities, especially in an equity bear market. Differently said: don't call yourself diversified if your portfolio consists of stocks and high yielding junk bonds. I gather that readers investing in such bonds think it doesn't affect them; let me try to caution them that some master-limited partnership investments in the oil sector didn't work out so well, either.
Gold...
I have argued for some time that the main competitor to the price of gold is cash that pays a high real rate of return. That is, if investors get compensated for holding cash, they may not have the need for a brick that has no income and costs a bit to hold.
After the election, we believe the price of gold came down as the market priced in higher real interest rates in anticipation of lower regulations. We indicated that this euphoria will cede to realism, meaning that regulations might not be cut quite as much. We also suggested that any fiscal stimulus on the backdrop of low employment may be inflationary. That is, expectations of higher real rates might be replaced with expectations of higher nominal rates; net, bonds might not change all that much, but the price of gold may well rise in that environment.
Add the Fed to the picture, having raised rates twice now since the election. We have argued that the Fed is and continues to be 'behind the curve,' i.e. is raising rates more slowly than inflationary pressures are building. We believe the Fed is petrified that they might have to go down back to QE when the next recession comes and, as a result, has been very slow in raising rates. Indeed, we believe the Fed will only raise rates if the market delivers a rate hike on a silver platter, i.e. the markets are "behaving" (no taper tantrum). As such, let me make this prediction: if the S&P 500 is up 20% from current levels this October, odds are we will get more rate hikes than are currently priced in; conversely, if the S&P 500 is down 20% from current levels this October, odds are we will get fewer rate hikes than are currently priced in. If you are rolling your eyes that this isn't too ingenious, I would like to remind readers that this isn't supposed to be the yard stick the Fed should be using. We believe the Fed is a hostage of the market. Paraphrasing a former Fed official who shall remain unnamed, he indicated to me that the Fed wouldn't care how the S&P reacts to an FOMC decision, unless, they created a bubble.
The Dollar...
What about the greenback? The dollar index (DXY) was up four years in a row. Year-to-date, however, the index is down despite the recent rate hikes. It shows that everything is relative to what is priced in already. A key reason we believe the dollar may have seen its peak is because of the Fed's unwillingness to get 'ahead of the curve'. Not with Janet Yellen, at least. Her term as Chair is running out next January; we wouldn't be surprised if she is replaced with Kevin Warsh. He was a Fed governor during the financial crisis; he has since published a variety of OpEds, criticizing the Fed. He has also been on one of President Trump's economic round tables. If he indeed succeeds Yellen (there are other names being mentioned; we just happen to think that at this stage, he best fits the profile of what Trump may be looking for), he has indicated that the reason why Fed officials are appointed for many years is so they don't have to worry how markets react to policy decisions. That's a stoic attitude, but reality (called "deteriorating financial conditions") may well change his mind should he become Fed Chair and try to raise rates more aggressively.
Aside from real interest rates, when it comes to the dollar, it is worth paying attention to trade policy. So-called experts had predicted a 20% surge in the dollar based on the "border adjustment tax" in the GOP House tax plan. Except that surge hasn't happened. Maybe the plan is dead. Maybe the plan's market impact will be different. Our take is: if you introduce barriers to trade, we believe currencies of countries with current account deficits tend to suffer. The greenback qualifies, and the recent decline coincides with more protectionist talk coming from the Trump administration.
The Sterling...
Talking about the greenback, there's always another currency at the other side of the trade. The sterling is one of those currencies that has suffered as trade barriers have been raised (a "Brexit" is akin to increasing trade barriers); the Brits also have a current account deficit. And we think those trade barriers will become ever more apparent as the odds of the UK and the EU coming to a prudent trade agreement appear rather dim. We come to that assessment because of the EU's institutional setup requiring unanimity for new trade deals on the one hand, but a hard deadline on the other hand to leave the EU once Article 50 (the 'exit' article) is triggered.
What gets us really negative about the sterling, though, is their fiscal situation. Sure, there may well be a short squeeze at some point because others don't like the currency but medium to long-term, we believe the Brits may well go down what we call the "Italian road." That is, we believe they'll finance substantial deficits with monetary policy that's too loose, leading to a currency that will cascade lower over time. That's because we don't see how the Brits can finance their budgets. When the Brits had their austerity budgets, their finances had moved from what we would call horrible to bad. Now they may well drift back to horrible as government spending increases to cushion the blow from Brexit.
The Euro...
What about the currency investors love to hate? Let me remind readers that everything is relative to what is being priced in. The euro has done well year to date because, we believe investors are increasingly realizing that the lows in rates may have been reached. The dollar started to surge at the first talk of tapering, even as the first actual rate hike was far, far, off. Similarly, the euro may well start appreciating well before rates will actually go up again in the Eurozone.
Recently, European Central Bank (ECB) head Draghi gave an upbeat presentation at a press conference, suggesting (and I'm putting words into his mouth here) we shouldn't be overly worried about the various upcoming risk events (Dutch election at the time; the French election, etc.), as there isn't much as we can do about them anyway; and if something bad were to happen, well, he'll do whatever it takes. Then the Dutch rejected populism. Then the rumor came up that the ECB may hike rates before ending the purchases of securities; this rumor was given credence as the Austrian ECB member of the governing counsel suggested that there are many different rates and, yes, some could be raised before the bond purchases are done.
Separately, we believe the euro has increasingly become a so-called funding currency. Amongst others because rates are so low, speculators are borrowing in euros to buy higher yielding assets. If we have a risk off event, e.g. a sharper decline in stocks, those speculators might have to reduce their bets and, as part of that, buy back the euro. Short covering may not lead to sustainable rallies in the euro, but it's a piece of the puzzle worth watching.
EM currencies...
Emerging market (EM) currencies tend to be proxies for risk assets, i.e. they tend to do just fine when times are good, but in the case of severe selloffs, our analysis shows they also tend to suffer. We don't think they are as vulnerable as they have been at other times when investors have been chasing yield (remember, in EM markets, higher yielding bonds tend to be available), but any investors exposed to them should keep those risks in mind in the context of an overall portfolio allocation.
Make your portfolio great again...
Before you contemplate how to rebalance your portfolio, think about how institutional investors might be rebalancing their portfolio. U.S. markets have been outperforming, the dollar has been rising. As such, we would think institutional investors might shift assets overseas to rebalance their portfolios, thereby favoring international equities and putting downward pressure on the dollar.
As you might have gathered, I believe most investors are over-exposed to US equities. Equities have performed so well that it's difficult to get anyone to listen to this concern. And that's exactly the type of environment that is a fertile ground for bubbles.
Existing Home Sales Pull Back from 10-Year High in February
After rising to the highest level since 2007 in January, existing home sales fell by 3.7% m/m to 5.48 million (annualized) in February. The headline print was slightly weaker than market expectations which called for a 2.5% drop to 5.55 million.
The decline was concentrated in the single family segment where transactions fell by 3.0% to 4.89 million. Sales in the smaller condo/co-op segment retreated by a sharper 9.2% to 590 thousand.
On a regional basis, sales activity declined across most regions, pulling back in the Northeast (-13.8%), Midwest (-7.0%) and West (-3.1%), while a modest gain was recorded in the South (1.3%). Despite the pull back, activity remained higher than year-ago levels across the board.
The inventory of homes available for sale, while increasing 4.2% to 1.75 million on the month, remained 6.4% below year-ago level. The low supply of homes is pressuring up home prices, with the median home price accelerating to 7.7% y/y in February from 6.4% in the prior month.
First time homebuyers accounted for 32% of sales - down 1 percentage point from last month but up 3pp from year-ago.
Key Implications
While the pullback in activity is disappointing, it was not a surprise. The post-election rise in interest rates pulled forward some contract-signing and was bound to eventually weigh on sales activity as the initial rush dissipated. Demand for homes in February was also tempered by robust home price growth and very-low inventory levels - the latter being at a multiyear low, having fallen for nearly two years.
Sales activity is likely to remain relatively flat over the near-term, as the aforementioned factors continue to weigh on the housing market - a narrative corroborated by falling pending home sales data.
Still, the story is brighter over the longer-run as increasingly solid fundamentals - highlighted by robust job gains and rising wage growth which are both pulling more workers from the sidelines - should continue to buoy demand. Additional supply from rising new home building as well that of existing homes - as current owners increasingly believe it is a good time to sell a home to cash in on past price gains - will also help boost activity and alleviate some of the price pressures on existing home prices over the medium term.
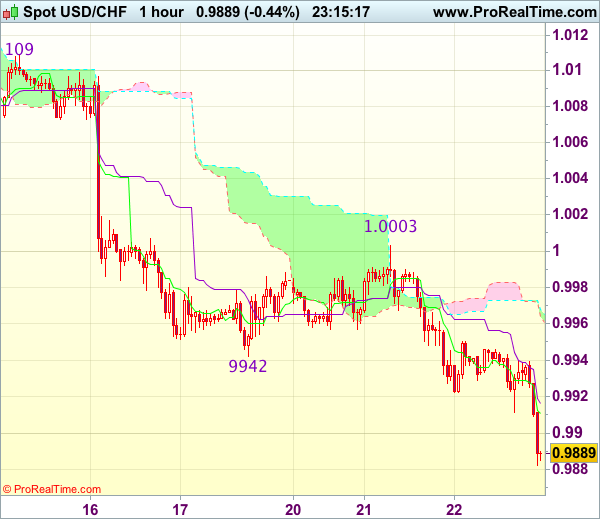
Trade Idea Wrap-up: USD/CHF – Sell at 1.0000
USD/CHF - 0.9897
Most recent candlesticks pattern : N/A
Trend : Near term down
Tenkan-Sen level : 0.9911
Kijun-Sen level : 0.9916
Ichimoku cloud top : 0.9973
Ichimoku cloud bottom : 0.9972
Original strategy :
Sell at 1.0000, Target: 0.9900, Stop: 1.0035
Position : -
Target : -
Stop : -
New strategy :
Sell at 1.0000, Target: 0.9900, Stop: 1.0035
Position : -
Target : -
Stop : -
Yesterday’s selloff after meeting renewed selling interest at 1.0003 adds credence to our view that recent decline from 1.0171 is still in progress and may extend weakness to 0.9875-80, however, loss of downward momentum should prevent sharp fall below 0.9850 and reckon 0.9825-30 would hold from here, risk from there has increased for a rebound later.
In view of this, would not chase this fall here and would be prudent to sell dollar on recovery as 1.0000-05 should limit upside and bring another decline. Only above previous support at 1.0060 (now resistance) would abort and signal low is formed instead, risk rebound to 1.0090-95 first.