Sample Category Title
USD/CAD: Loonie Extends Its Gains In The Asian Session
For the 24 hours to 23:00 GMT, the USD declined 0.16% against the CAD and closed at 1.3331.
In the Asian session, at GMT0400, the pair is trading at 1.3321, with the USD trading 0.08% lower against the USD from yesterday’s close.
The pair is expected to find support at 1.3290, and a fall through could take it to the next support level of 1.3259. The pair is expected to find its first resistance at 1.3380, and a rise through could take it to the next resistance level of 1.3439.
Amid a lack of economic releases in Canada today, trading trends in the CAD are expected to be determined by global macroeconomic events.
The currency pair is trading below its 20 Hr and 50 Hr moving averages.

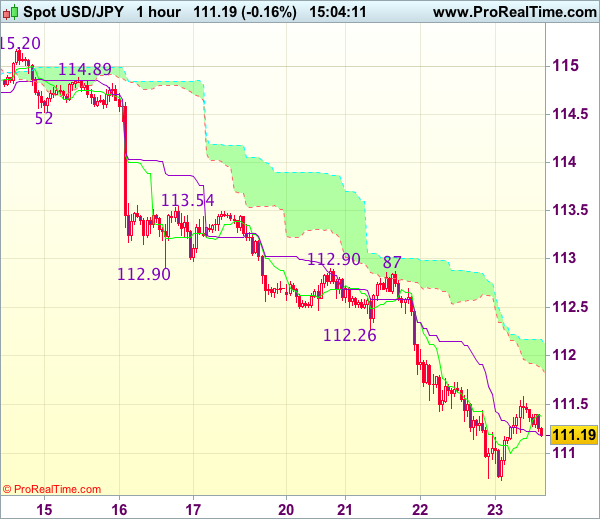
Trade Idea : USD/JPY – Sell at 112.00
USD/JPY - 111.15
Most recent candlesticks pattern : N/A
Trend : Near term down
Tenkan-Sen level : 111.36
Kijun-Sen level : 111.19
Ichimoku cloud top : 112.17
Ichimoku cloud bottom : 111.88
Original strategy :
Sell at 112.00, Target: 110.80, Stop: 112.35
Position : -
Target : -
Stop : -
New strategy :
Sell at 112.00, Target: 110.80, Stop: 112.35
Position : -
Target : -
Stop : -
As the greenback recovered after falling to 110.73, suggesting consolidation above this level would be seen and corrective bounce to 111.55-60 is likely, however, still reckon upside would be limited to 112.00-10 and bring another decline later, a break of said support at 110.73 would signal recent decline is still in progress and may extend further fall to 110.50 but near term oversold condition should prevent sharp fall below 110.20-25 and reckon 110.00 would hold from here.
In view of this, would not chase this fall here and would be prudent to sell cable on recovery as 112.00 should limit upside. Only above indicated previous support at 112.26 would abort and signal low is formed instead, bring a stronger rebound to 112,59 but resistance at 112,87-90 should cap upside.
Asian Market Update: RBNZ Holds Rates As Expected And Maintains Neutral Policy Stance
RBNZ holds rates as expected and maintains neutral policy stance
Asia Mid-Session Market Update: RBNZ holds rates as expected and maintains neutral policy stance; US GOP lawmakers continue to negotiate healthcare bill ahead of Thursday vote
US Session Highlights
(EU) ECB's Villeroy: Recovery in inflation did not yet warrant a change in current accommodative policy
(US) MBA MORTGAGE APPLICATIONS W/E MAR 17TH: -2.7% V 3.1% PRIOR
(US) JAN FHFA HOUSE PRICE INDEX M/M: 0.0% V 0.4%E
(US) FEB EXISTING HOME SALES: 5.48M V 5.55ME
(US) SEC votes unanimously to approve rules to shorten standard securities settlement time to two days from three days
(US) DOE CRUDE: +5.0M V +2ME; GASOLINE: -2.8M V -2ME; DISTILLATE: -1.9M V -1.5ME
(UK) Metropolitan Polices Dep Commissioner: London attack "inspired by international Islamist terrorism" results in 5 deaths and 40 injured - press
US markets on close: Dow flat, S&P500 +0.2%, Nasdaq +0.5%
Best Sector in S&P500: Technology
Worst Sector in S&P500: Telecom
Biggest gainers: MAR +3.4%, VTR +2.8%, FMC +2.7%, ILMN +2.6%, UAL +2.6%
Biggest losers: FTR -10.6%, NKE -7.1%, TDG -4.4%, MNK -3.4%, LB -2.7%
At the close: VIX 12.8 (+0.3 pts); Treasuries: 2-yr 1.26% (flat), 10-yr 2.40% (-4bps), 30-yr 3.01% (-4bps)
US movers afterhours
HTGM: Obtains CE Mark for its HTG EdgeSeq ALKPlus Assay EU; +69.6% afterhours
FIVE: Reports Q4 $0.90 v $0.89e, R$388.1M v $387Me; Guides Q1 $0.12-0.14 (GAAP) v $0.14e, R$228-232M v $229Me, SSS flat to +2%; +8.2% afterhours
PVH: Reports Q4 $1.23 v $1.21e, R$2.11B v $2.09Be; Increases share buyback by $750M extended to Jun 2020 (10.4% of market cap); Guides Q1 $1.58-1.60 v $1.57e; +7.2% afterhours
BEBE: Confirms exploring strategic alternatives; +6.5% afterhours
MLHR: Reports Q3 $0.37 v $0.33e, R$524.9M v $531Me (2 est); +5.1% afterhours
CPB: Announces $1.5B share repurchase program (9% of market cap); +1.6% afterhours
RARE: Phase 2 UX007 Glucose Transporter Type-1 Deficiency Syndrome Seizure Study: Overall seizures not significantly reduced; decrease in absence seizures observed; -6.6% afterhours
Politics
(US) FBI said to have information that associates of Pres Trump communicated with Russian operatives during elections and may have released information damaging to Clinton campaign - CNN
(US) Trump administration reportedly considering making last minute changes to House healthcare bill to appease Freedom Caucus - Axios
Asia Key economic data:
(NZ) NEW ZEALAND CENTRAL BANK (RBNZ) LEAVES OFFICIAL CASH RATE (OCR) UNCHANGED AT 1.75%; AS EXPECTED
(HK) Macau Feb Visitor Arrivals -13.2% m/m, -5.6% y/y to 2.50M
Asia Session Notable Observations, Speakers and Press
Asian equities have come off overnight lows as the selling in US stocks subsided, however the focus for sentiment remains primarily on the fate of the US healthcare legislation in the House vote on Thursday evening. Despite reports of limited progress made in swaying the members of a more conservative Freedom Focus during US hours, the administration claims it will proceed with the vote. In late US hours on Wednesday, press reports suggest that the White House is considering last-minute concessions to the right wing of the party, namely reducing some of the "essential benefit" requirements of Obamacare, though it is unclear whether that would dissuade some of the more moderate lawmakers from supporting the bill.
In FX, USD majors traded rangebound as selling in the greenback subsided during US hours. USD/JPY rose nearly 80pips from US session lows to 111.50, while EUR/USD spent much of the day in 1.0780-0820 range. GBP/USD was volatile in early US hours amid reports of a terror attack in London that claimed the lives of 5 people, falling to low 1.2420s before returning toward 1.25 handle. NZD/USD hit session high just shy of 0.7070 in the wake of RBNZ policy statement that expressed more concern over housing inflation while reiterating that exchange rate should depreciate more to achieve balanced growth. RBNZ's tempered view of progress in housing as attributed to macroprudential measures risks a rush to tighten late this year, and indeed the OIS swaps market saw Q1 2018 odds of a hike inch up 4pts to near 50%. However, RBNZ also expressed awareness of "surplus capacity in the global economy and extensive geo-political uncertainty", giving markets little reason to anticipate a shift from policy status quo.
China
(CN) China plans to hold a meeting of BRICS economy and trade ministers in July - press
(CN) China Commerce Ministry (MOFCOM): Working with Saudi Arabia to push ahead energy cooperation - press
(CN) Some China coal-fired plants urge coal price cut - Chinese press
Australia/New Zealand
(AU) Australia PM Turnbull: China and Australia are reaping the benefits of free trade agreement - press
(NZ) Rabobank: New Zealand pessimism about rural economy has fallen to a 3-year low - press
Korea
(KR) US govt reportedly readying cases that link North Korea to cybertheft at the NY Fed - press
Asian Equity Indices/Futures (00:00ET)
Nikkei flat, Hang Seng +0.4%, Shanghai Composite +0.3%, ASX200 +0.3%, Kospi +0.2%
Equity Futures: S&P500 +0.2%; Nasdaq +0.1%; Dax +0.2%; FTSE100 +0.1%
FX ranges/Commodities/Fixed Income (00:00ET)
EUR 1.0780-1.0800; JPY 111.10-111.60; AUD 0.7650-0.7680; NZD 0.7025-0.7050
Apr Gold -0.3% at $1,246/oz; May Crude Oil +0.7% at $48.39/brl; May Copper flat at $2.64/lb
(CN) PBOC SETS YUAN MID POINT AT 6.8856 V 6.8889 PRIOR; 2nd straight firmer setting
(CN) PBOC to inject combined CNY30B v CNY90B prior in 7,14, and 28-day reverse repos
Asia equities/Notables/movers by sector
Consumer discretionary: 2331.HK Li Ning Co -3.3% (annual result); 288.HK WH Group +8.6% (annual result)
Financials: 416.HK Bank of Jinzhou -0.3% (annual result); 998.HK China CITIC Bank -0.4% (annual result); 2318.HK Ping An Insurance +2.3%, 1113.HK Cheung Kong Property Holdings +1.8%, 1.HK CK Hutchison Holdings +0.6% (annual result)
Industrials: 631.HK Sany Heavy Equipment International Holdings -1.2%, 175.HK Geely Automobile Holdings -2.0% (FY16 result); FBU.NZ Fletcher Building Limited -2.3% (new CEO); 5631.JP Japan Steel Works -2.4% (cuts guidance)
Technology: 700.HK Tencent Holdings -1.0% (Q4 result); 763.HK ZTE Corp +2.3% (settlement); 1169.HK Haier Electronics Group +12.3% (annual result); ISD.AU iSentia Group -2.0% (CFO resigns)
Materials: 743.HK Asia Cement China Holdings -0.8% (annual result)
Energy: 1898.HK China Coal Energy -2.0%; 2208.HK Xinjiang Goldwind Science & Technology +0.8% (annual result)
Healthcare: SIP.AU Sigma Pharmaceuticals +2.3% (FY17 result)
Utilities: AST.AU AusNet Services -0.9% (Citi cuts rating)
USDJPY Elliott Wave View: Mature Cycle
Short term Elliott Wave view in USDJPY suggests that rally to 115.48 on 3/10 ended Intermediate wave (X). Decline from there is unfolding as a zigzag Elliott wave structure in which the first leg Minor wave A is subdivided in 5 impulsive waves. Down from 3/10 high, Minute wave ((i)) ended at 114.46, Minute wave ((ii)) ended at 115.195, Minute wave ((iii)) ended at 110.71 and Minute wave ((iv)) is proposed complete at 111.59. Cycle from 3/10 high is mature and Minor wave A has enough extension to be called complete, but a marginal low towards 100 – 110.5 area can’t be ruled out to complete Minor wave A. Afterwards, pair should bounce in Minor wave B in 3, 7, or 11 swing to correct cycle from 3/10 high before the decline resumes. We do not like buying the proposed bounce in Minor wave B and expect sellers to appear when Minor wave B bounce is over in 3, 7, or 11 swing later for another extension lower.
USDJPY 1 Hour Chart
Oil Looks Set To Stage A Mild Comeback
Key Points:
- Double bottom structure seems to be forming.
- Ascending trend line should now come into play.
- US Inventories build has likely delayed the rally.
Oil prices look to have finally found a bottom, potentially even two of them, which could see buying pressure mount in the coming sessions. Additionally, a number of other technical instruments are signalling that a reversal is on the way which comes as little surprise given the presence of the ascending trend line.
First and foremost, as mentioned above, there seems to be a double bottom forming up on the daily chart which indicates selling pressure may be running thin. To some extent, this will a result of oil moving into oversold territory as is made clear by the stochastic oscillator. However, the impending MACD signal line crossover is also suggestive of a near-term change in momentum.
Aside from these near-term technical readings, the long-term trend line provides what is probably the strongest argument for a reversal. As is shown above, the commodity is drawing fairly close to the ascending line which will certainly have the bears worried. Indeed, their inability to push substantially below this level is evident in the long shadows of the two candles that form the troughs of the depicted double bottom structure.
Although, given the shift in the EMA bias to bearish, gains could be fairly muted for oil which might mean we instead see it drift lazily higher rather than reversing sharply as forecasted. The main counter argument to this would be the mere fact that the commodity is now below the $50 handle, a handle that has only recently been priced in as the medium to long-term average. However, the neckline of the double bottom is also relatively shallow which makes it a fairly achievable zone to break through, meaning, sparking a rally typical of the double bottom pattern will be relatively easy.
Once an upswing has taken hold, we expect gains to extend to, at most, the 51.55 handle. This price is somewhat shy of what would generally be forecasted for a chart pattern such as this, however, there is some reason to doubt the overall strength of the rally. Firstly, the 100 day moving average is likely to be a source of dynamic resistance which will begin to cap upsides around the 50.70 mark. This being said, the real challenge will be in overcoming the 50.0% Fibonacci level around the 51.55 level as it also coincides with a number of historical reversal points.
Ultimately, yesterday’s 4.95M build in US Crude Oil Inventories could delay the forecasted uptrend for a few sessions. Although, the fact that such a build barely managed to push the commodity lower could also be taken as a sign that it is ready to surge higher when fundamentals stop weighing it down. However, also stay on the lookout for any developments from OPEC as the cartel is likely to have something in the wings to re-float oil prices going forward which would suit this technical forecast just fine.
European Open Briefing
Global Markets:
- Asian stock markets: Nikkei up 0.10 %, Shanghai Composite gained 0.30 %, Hang Seng and ASX 200 both rose 0.35 %
- Commodities: Gold at $1246 (-0.30 %), Silver at $17.55 (-0.20 %), WTI Oil at $48.40 (+0.75 %), Brent Oil at $51.00 (+0.70 %)
- Rates: US 10 year yield at 2.41, UK 10 year yield at 1.18, German 10 year yield at 0.41
News & Data:
- RBNZ Interest Rate Remains Unchanged At 1.75%, As Expected
- PBoC Fixes USDCNY Reference Rate At 6.8856 (Prev 6.8889)
- Asia stocks rise, but gains for dollar, oil capped by jitters – RTRS
- Slide in U.S. infrastructure stocks sign of 'Trump trade' weakness – RTRS
- Dollar limps up from four-month low vs. yen, Trump's healthcare bill in focus – RTRS
Markets Update:
Stock markets have calmed down following the sharp sell-off on Tuesday. Most of the major Asian indices are up on the day, but investors remain cautious overall.
Meanwhile, the US Dollar remains under pressure. EUR/USD failed to sustain momentum above 1.08, but is still bid. Resistance is seen in the area between 1.0820 and 1.0830. Should the pair break above it, it will likely extend the rally further beyond 1.09.
GBP/USD declined yesterday on the news that there has been a terrorist attack in London. However, it recovered later and rose back to 1.25. Overall, the short-term outlook is positive from a technical perspective. After 1.25, the next strong resistance level lies at 1.2580.
USD/JPY is looking a bit oversold on the hourly charts, and could see a bounce in the next few sessions. Nevertheless, the outlook remains negative and there will be good selling interest on any larger rally. Strong resistance is noted in the area between 112.00 and 112.25.
Upcoming Events:
- 09:00 GMT – ECB Economic Bulletin
- 09:30 GMT – UK Retail Sales
- 12:30 GMT – US Initial Jobless Claims
- 11:00 GMT – Fed Chair Yellen speaks
- 14:00 GMT – US New Home Sales
- 21:45 GMT – New Zealand Trade Balance
RBNZ Maintained Neutral Bias, Likely On Hold Throughout 2017
As widely anticipated, RBNZ left the OCR unchanged at 1.75% and maintained the neutral bias in the monetary policy stance. Domestic economic developments remained upbeat with rising inflation and positive growth outlook. Policymakers attributed weaker-than-expected 4Q17 GDP to temporary factors. The central bank acknowledged the recent depreciation in trade-weighted exchange rate. Yet, it reiterated that a weaker kiwi would be needed for more balanced growth. RBNZ warned that geopolitical uncertainty remained the biggest challenge in the global economic development. We expect RBNZ would stand on the sideline throughout the year.
RBNZ acknowledged that headline inflation had 'returned to the target band as past declines in oil prices dropped out of the annual calculation'. It expected the headline reading would be variable over the next 12 months due to 'one-off effects from recent food and import price movements, but is expected to return to the midpoint of the target band over the medium term'. The central bank maintained the longer-term inflation expectations at 'around +2%'. Policymakers also noted moderation in house price, thanks to 'loan-to-value ratio restrictions and tighter lending conditions'. What is uncertain is 'whether this moderation will be sustained given the continued imbalance between supply and demand'.
New Zealand's GDP expanded +2.7% y/y and +0.7% q/q, in 4Q16, compared with consensus of +3.2% and +0.7%, respectively. Yet, RBNZ noted that 'some of this is considered to be due to temporary factors'. It remained confident that 'the growth outlook remains positive, supported by on-going accommodative monetary policy, strong population growth, and high levels of household spending and construction activity'. RBNZ also remained positive over the global economic outlook. Yet, it cautioned that the major challenges would be 'on-going surplus capacity' and 'extensive geopolitical uncertainty'.
On exchange rate, policymakers welcomed the -4% decline in the trade-weighted New Zealand dollar index since February. They believed the depreciation was partly driven by 'weaker dairy prices and reduced interest rate differentials'. Nonetheless, they emphasized that 'further depreciation is needed to achieve more balanced growth'.
The monetary decision had been widely anticipated. Following three rate cuts in 2016, the central bank would likely leave the policy rate unchanged throughout 2017. Bloomberg estimates suggest that the market is pricing in about 38% chance of a +25 bps rate hike by the end of this year. The chance of such an increase in 2018 has been fully priced in.
Daily Technical Outlook And Review
A note on lower timeframe confirming price action...
Waiting for lower timeframe confirmation is our main tool to confirm strength within higher timeframe zones, and has really been the key to our trading success. It takes a little time to understand the subtle nuances, however, as each trade is never the same, but once you master the rhythm so to speak, you will be saved from countless unnecessary losing trades. The following is a list of what we look for:
- A break/retest of supply or demand dependent on which way you're trading.
- A trendline break/retest.
- Buying/selling tails ... essentially we look for a cluster of very obvious spikes off of lower timeframe support and resistance levels within the higher timeframe zone.
- Candlestick patterns. We tend to only stick with pin bars and engulfing bars as these have proven to be the most effective.
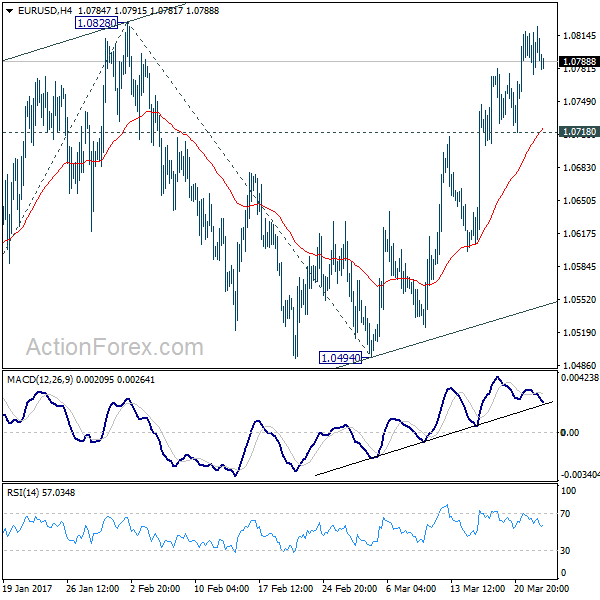
EUR/USD
During the course of yesterday's sessions, the H4 candles remained sandwiched between a supply at 1.0828-1.0814 and a support area drawn from 1.0797-1.0780. Seeing as price concluded the day within the walls of this support area, there's a possibility that the bulls may attempt to lift the pair north today. While this may be true, we believe the bears could have the upper hand here for two reasons:
The spike seen below the support area likely activated a truckload of sell stops (black arrow), and thus potentially may have weakened bids here.
Higher-timeframe structure shows that the major recently crossed paths with a weekly resistance barrier coming in at 1.0819 that stretches as far back as mid-2015. Adding to this, the closest higher-timeframe support structure does not come into view until we reach the daily support area formed at 1.0714-1.0683.
Our suggestions: In view of the above points, we believe that a reasonably strong bearish bias is present. Nevertheless, before our desk can become sellers, a H4 close will need to be seen beyond the current H4 support area. This – coupled with a strong retest to the underside of this zone would, in our humble opinion, be enough to justify a sell, targeting the H4 demand at 1.0705-1.0723 (positioned around the top edge of the aforementioned daily support area).
Data points to consider: US jobless claims at 12.30pm, Fed Chair Janet Yellen speaks at 12.45pm, US new home sales at 2pm, FOMC member Kashkari speaks at 4.30pm, FOMC member Kaplan speaks at 11pm GMT.
Levels to watch/live orders:
- Buys: Flat (stop loss: N/A).
- Sells: Watch for price to engulf 1.0797-1.0780 and then look to trade any retest seen thereafter (stop loss: dependent on the rejection candle, as we'd look to place it beyond the rejection candle's wick).
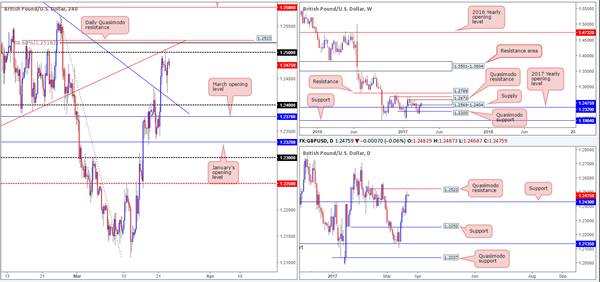
GBP/USD:
For those who read Wednesday's report you may recall our team highlighting the H4 sell zone seen at 1.2523/1.25. The reasons for selecting this area were as follows:
- The 1.25 handle.
- A H4 trendline resistance taken from the low 1.2346.
- An 88.6% H4 retracement seen at 1.2518.
- A daily Quasimodo resistance level coming in at 1.2523.
- All of the above structures are located within weekly supply positioned at 1.2569-1.2404.
Well done to any of our readers who took advantage of this move yesterday.
Moving forward, we can see that daily support was brought into play yesterday at 1.2430. The rebound from here is considered strong, in our book. As a result, this could force daily price to challenge the daily Quasimodo resistance at 1.2523 sometime today, which as we already know is housed within the aforementioned weekly supply.
Our suggestions: With offers now likely weakened around the 1.25 boundary from yesterday's move, our focus turns to the daily Quasimodo resistance seen just above it at 1.2523. Merging closely with the H4 trendline resistance taken from the low 1.2346, an 88.6% H4 retracement seen at 1.2518 and not forgetting where this daily line is positioned on the weekly timeframe (see above), we'll be (dependent on the time of day) looking to short from here with stops placed above the weekly supply at 1.2571.
Data points to consider: MPC member Broadbent speaks at 9.15am, UK retail sales at 9.30am. US jobless claims at 12.30pm, Fed Chair Janet Yellen speaks at 12.45pm, US new home sales at 2pm, FOMC member Kashkari speaks at 4.30pm, FOMC member Kaplan speaks at 11pm GMT.
Levels to watch/live orders:
- Buys: Flat (stop loss: N/A).
- Sells: 1.2523 region (stop loss: 1.2571).
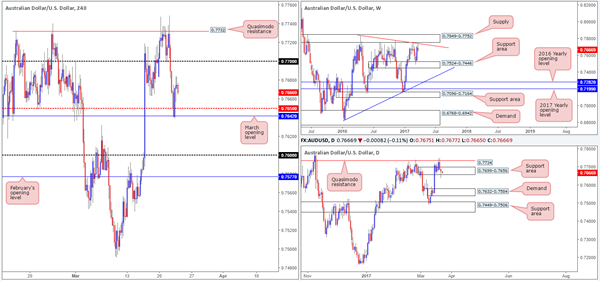
AUD/USD
Amid yesterday's trading, the commodity-linked currency pair ran into a strong floor of bids after momentarily surpassing the H4 mid-way support at 0.7650 and tapping March's opening level at 0.7642. In addition to this, over on the daily chart, price pierced through the lower edge of a support area drawn at 0.7699-0.7656, and ended the day forming a daily buying tail. Having said this though, one also has to take in to account that weekly action is currently selling off from a weekly trendline resistance taken from the high 0.7835.
Our suggestions: Despite the daily buying tail, upside still looks weak, in our view. However, at the same time, selling into a daily support area is just too risky for our liking, no matter what the weekly timeframe suggests!
Before our team can consider shorts, a H4 close is required beyond March's opening level mentioned above at 0.7642. Not only will this likely clear bids from within the current daily support area, it seems to also open up some space on the H4 chart down to the 0.76 handle. Therefore, a H4 close below 0.7642, followed up with a strong retest to this line as resistance would be ideal grounds to sell this market!
Data points to consider: US jobless claims at 12.30pm, Fed Chair Janet Yellen speaks at 12.45pm, US new home sales at 2pm, FOMC member Kashkari speaks at 4.30pm, FOMC member Kaplan speaks at 11pm GMT.
Levels to watch/live orders:
- Buys: Flat (stop loss: N/A).
- Sells: Watch for price to engulf 0.7642 and then look to trade any retest seen thereafter (stop loss: dependent on the rejection candle, as we'd look to place it beyond the rejection candle's wick).
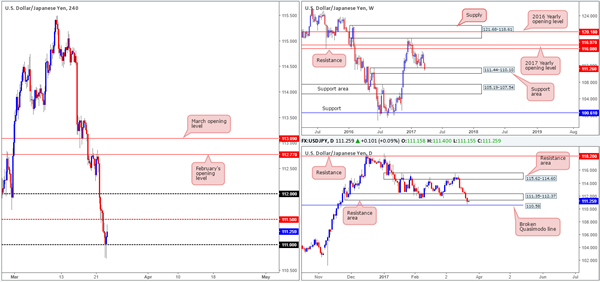
USD/JPY
Beginning with a look at the weekly chart this morning, the buyers and sellers remain battling for position around the weekly support area at 111.44-110.10. Down on the daily chart, nevertheless, we can see that the sellers printed a seventh consecutive bearish candle yesterday, which happened to engulf the daily demand base at 111.35-112.37. Leaving the nearby daily broken Quasimodo line at 110.58 unchallenged, price is now seen retesting the underside of the recently broken daily demand as resistance.
Jumping across to the H4 chart, the 111 handle held firm despite two back-to-back whipsaws. However, we do not consider this a buy signal, for two reasons:
- Daily price could respect the underside of 111.35-112.37 as resistance.
- Daily price may want to dive lower to connect with the aforementioned daily broken Quasimodo line.
- Our suggestions: While 111 could remain intact today, we would prefer to wait for price to touch gloves with the daily broken Quasimodo line at 110.58 before looking to go long. That way, traders have the option of placing their stops beyond the weekly support area!
Data points to consider: US jobless claims at 12.30pm, Fed Chair Janet Yellen speaks at 12.45pm, US new home sales at 2pm, FOMC member Kashkari speaks at 4.30pm, FOMC member Kaplan speaks at 11pm GMT.
Levels to watch/live orders:
- Buys: 110.58 region (stop loss: ideally beyond the current weekly support area at 110.08ish).
- Sells: Flat (stop loss: N/A).
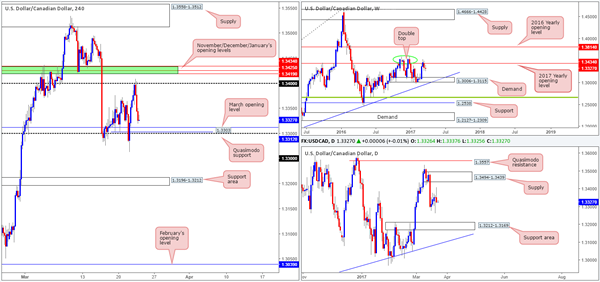
USD/CAD
With oil prices gaining strength yesterday, the USD/CAD hit the brakes and reversed from the 1.34 handle going into the early hours of the US segment. The day ended with price closing just ahead of March's opening level at 1.3312. Considering that this monthly level converges with a H4 Quasimodo support at 1.3303 and the 1.33 handle, would we deem this a stable enough zone to trade long from today? Well, weekly action is currently trading below the 2017 yearly opening level at 1.3434, and shows room to drop lower from here. Daily action on the other hand, offers very little in terms of direction given that the unit is seen meandering mid-range between a supply coming in at 1.3494-1.3439 and a support area at 1.3212-1.3169.
Our suggestions: While a bounce is highly likely to be seen from the H4 1.33/1.3312 neighborhood, we would strongly advise waiting for a lower-timeframe confirming signal to take shape before pressing the buy button (see the top of this report), due to the lack of higher-timeframe confluence.
Data points to consider: US jobless claims at 12.30pm, Fed Chair Janet Yellen speaks at 12.45pm, US new home sales at 2pm, FOMC member Kashkari speaks at 4.30pm, FOMC member Kaplan speaks at 11pm GMT.
Levels to watch/live orders:
- Buys: 1.33/1.3312 ([waiting for a lower-timeframe buy signal to form is advised before pulling the trigger] stop loss: dependent on where one confirms this area).
- Sells: Flat (stop loss: N/A).
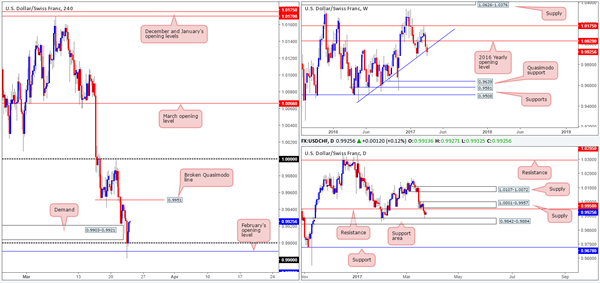
USD/CHF
In recent sessions, the Swissy punched its way through the H4 demand at 0.9903-0.9921 and the 0.99 handle, leaving price free to tag February's opening level at 0.9890 as the US opened their doors for business. With the help of the daily support area seen at 0.9842-0.9884, bids held firm from 0.9890 and rallied strongly into the closing bell. Although H4 upside looks relatively clear up to the broken Quasimodo line at 0.9951, which happens to merge nicely with a daily resistance level at 0.9950 and a nearby daily supply at 1.0001-0.9957, we're a tad concerned by the recent break of the weekly trendline support etched from the low 0.9443.
Our suggestions: Without knowing whether or not the break of the weekly trendline is genuine or just a deep fakeout, this market is a tricky beast to trade at the moment.
In addition to the above, even if one were to take a long in this market, there's little wiggle room seen for price to move before we connect with the 0.9950 region! Therefore, in the absence of clearer price action, we'll remain flat for the time being and reassess structure going into tomorrow's open.
Data points to consider: US jobless claims at 12.30pm, Fed Chair Janet Yellen speaks at 12.45pm, US new home sales at 2pm, FOMC member Kashkari speaks at 4.30pm, FOMC member Kaplan speaks at 11pm. CHF Gov. board member Maechler speaks at 5pm GMT.
Levels to watch/live orders:
- Buys: Flat (stop loss: N/A).
- Sells: Flat (stop loss: N/A).
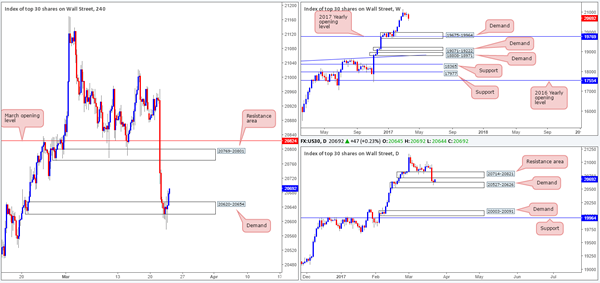
DOW 30
Following the DOW's rather impressive downside move on Tuesday, the index managed to hold ground, albeit after multiple whipsaws, around the H4 demand base drawn from 20620-20654. To our way of seeing things, the next upside target is located close by around the underside of the daily resistance area at 20714, followed closely by the H4 resistance area at 20769-20801. Therefore, entering long at current prices is not something that interests us. Selling, however, is also not something we'd be comfortable taking part in due to the current support structure in play, and the fact that the US equity market is still in a strong position according to the weekly chart!
Our suggestions: Quite simply, we would recommend placing this market on the backburner today and revisiting it at tomorrow's open. Hopefully, we'll see some development by then.
Data points to consider: US jobless claims at 12.30pm, Fed Chair Janet Yellen speaks at 12.45pm, US new home sales at 2pm, FOMC member Kashkari speaks at 4.30pm, FOMC member Kaplan speaks at 11pm GMT.
Levels to watch/live orders:
- Buys: Flat (stop loss: N/A).
- Sells: Flat (stop loss: N/A).
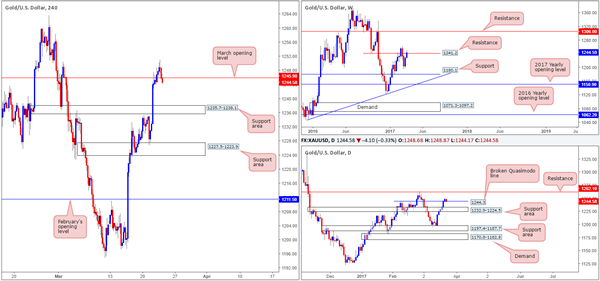
GOLD
Kicking this morning's report off with a quick peek at the weekly chart, we can see that the buyers and sellers continue to battle for position around the resistance line pegged at 1241.2. The story on the daily chart, nonetheless, shows that price recently engulfed the Quasimodo resistance level at 1244.3, and is, at the time of writing, now seen retesting it as support. In the event that this boundary holds ground, the next area of interest can be seen around a daily resistance line at 1262.1.
Moving across to the H4 chart, structure shows that price briefly broke above the March 1st high at 1250.5 yesterday, and retreated into the close. With the H4 candles now seen trading back below March's opening level at 1245.9, there is space seen for this unit to test the support area at 1235.7-1238.1.
Our suggestions: However, taking a trade short on the basis of the break below March's opening level is not something we'd label high probability. Weekly action remains undecided around the 1241.2 neighborhood, and daily price is, as we mentioned above, seen testing 1244.3 as support. With that, our team's position will remain flat going into today's segment.

Levels to watch/live orders:
- Buys: Flat (stop loss: N/A).
- Sells: Flat (stop loss: N/A).
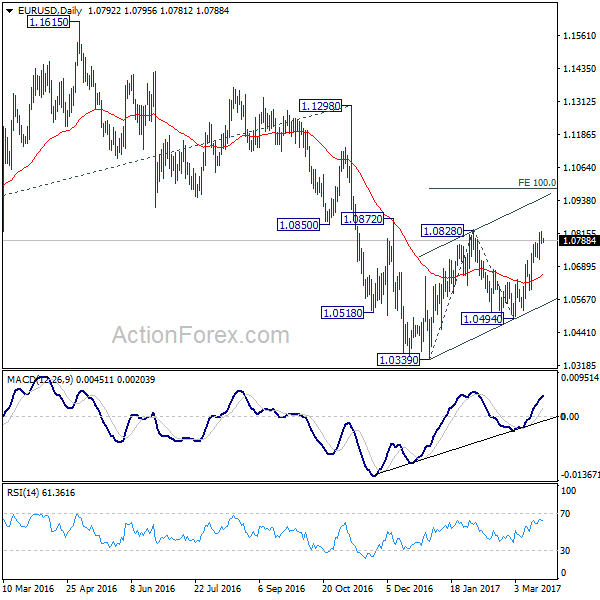
EUR/USD Daily Outlook
Daily Pivots: (S1) 1.0774; (P) 1.0799 (R1) 1.0823; More.....
EUR/USD lost some upside momentum again with 4 hour MACD crossed below signal line. But further rally is still expected with 1.0718 minor support intact. Break of 1.0828 resistance will target 100% projection of 1.0339 to 1.0828 from 1.0494 at 1.0983. However, as rise from 1.0339 is seen as a corrective move. We'd expect upside to be limited by 1.0983 to complete the correction. On the downside, break of 1.0718 minor support will turn bias to the downside for 1.0494 support first.
In the bigger picture, as long as 1.1298 key resistance holds, whole down trend from 1.6039 (2008 high) is still expected to resume later. Break of 1.0339 low will send EUR/USD through parity to 61.8% projection of 1.3993 to 1.0461 from 1.1298 at 0.9115.
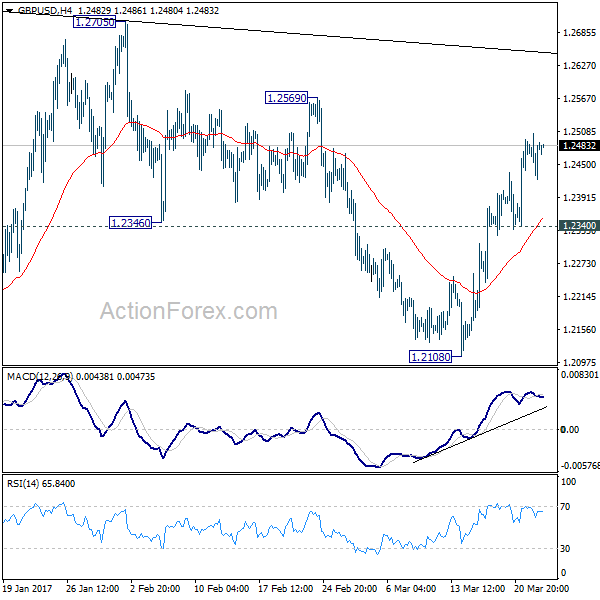
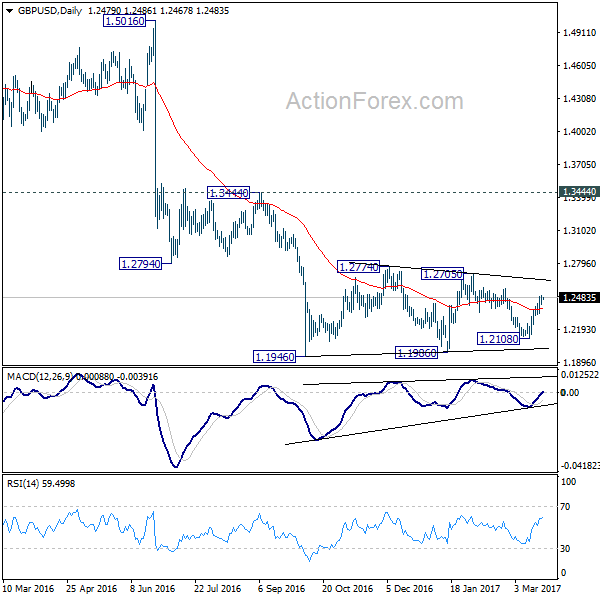
GBP/USD Daily Outlook
Daily Pivots: (S1) 1.2434; (P) 1.2470; (R1) 1.2517; More...
GBP/USD's rise from 1.2108 is still in progress. Intraday bias remains on the upside for 1.2569 resistance first. Break there will target 1.2705/74 resistance zone. But still, price actions from 1.1946 are seen as a consolidation pattern. Hence, we'd expect strong resistance from 1.2705/2774 to limit upside and bring down trend resumption. On the downside, break of 1.2340 support will turn bias back to the downside for 1.2108 support. Though, sustained break of 1.2774 will extend the rise towards 1.3444 key resistance level.
In the bigger picture, fall from 1.7190 is seen as part of the down trend from 2.1161. There is no sign of medium term bottoming yet. Sustained trading below 61.8% projection of 2.1161 to 1.3503 from 1.7190 at 1.2457 will target 100% projection at 0.9532. Overall, break of 1.3444 resistance is needed to confirm medium term bottoming. Otherwise, outlook will remain bearish.