Sample Category Title
Daily Technical Outlook And Review
A note on lower timeframe confirming price action...
Waiting for lower timeframe confirmation is our main tool to confirm strength within higher timeframe zones, and has really been the key to our trading success. It takes a little time to understand the subtle nuances, however, as each trade is never the same, but once you master the rhythm so to speak, you will be saved from countless unnecessary losing trades. The following is a list of what we look for:
- A break/retest of supply or demand dependent on which way you're trading.
- A trendline break/retest.
- Buying/selling tails ... essentially we look for a cluster of very obvious spikes off of lower timeframe support and resistance levels within the higher timeframe zone.
- Candlestick patterns. We tend to only stick with pin bars and engulfing bars as these have proven to be the most effective.
EUR/USD
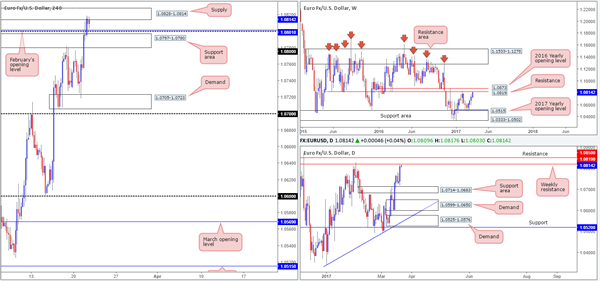
Beginning with a peek at the weekly chart this morning, it's clear to see that weekly price recently bumped heads with a weekly resistance line that stretches as far back as mid-2015. From this angle, we see very little standing in the way of price selling off from here. The closest higher-timeframe support structure can actually be seen down on the daily chart at 1.0714-1.0683: a daily support area.
Looking over to the H4 candles we can see that price launched itself north yesterday, breaching and eventually closing above the H4 supply at 1.0797-1.0780 (now an acting support area), the 1.08 handle and February's opening base line at 1.0801. With H4 price now capped between the above said H4 barriers and a nearby H4 supply zone pegged at 1.0828-1.0814, where does one go from here?
Our suggestions: In view of the unit's close proximity to the aforementioned weekly resistance level, a break to the downside is more likely, in our opinion. With that being the case, our team has noted that should H4 price close beyond the current H4 support area today, we will begin hunting for shorts on any retest seen at this area, targeting the H4 demand drawn from 1.0705-1.0723.
Data points to consider: There's little scheduled news on the docket today.
Levels to watch/live orders:
- Buys: Flat (stop loss: N/A).
- Sells: Watch for price to engulf 1.0797-1.0780 and then look to trade any retest seen thereafter (stop loss: dependent on the rejection candle, as ideally we'd look to place it beyond the rejection candle's wick).
GBP/USD
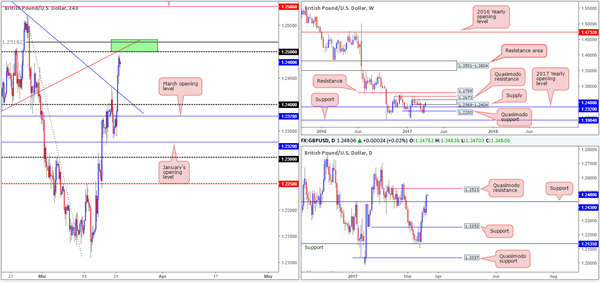
The GBP made considerable ground against its US counterpart on Tuesday, following upbeat UK inflation figures. The move broke through both a H4 trendline resistance extended from the high 1.2706 and a daily resistance logged in at 1.2430 (now acting support).
Thanks to this recent advance, there's a rather attractive H4 sell zone seen just ahead (painted in green) at 1.2523/1.25. Supporting a bounce from this area is as follows:
- The 1.25 handle.
- A H4 trendline resistance taken from the low 1.2346.
- An 88.6% H4 retracement seen at 1.2518.
- A daily Quasimodo resistance level coming in at 1.2523.
- All of the above structures are located within weekly supply positioned at 1.2569-1.2404.
Our suggestions: Dependent on the time of day, a short from this area could be something to consider. Aggressive stops are seen at 1.2525, while conservative stops can be placed above the weekly supply at 1.2571. Ultimately, we'd look to ride this train down to at least the daily support hurdle mentioned above at 1.2430.
Data points to consider: There's little scheduled news on the docket today.
Levels to watch/live orders:
- Buys: Flat (stop loss: N/A).
- Sells: 1.2523/1.25 (stop loss: 1.2571 [conservative]).
AUD/USD
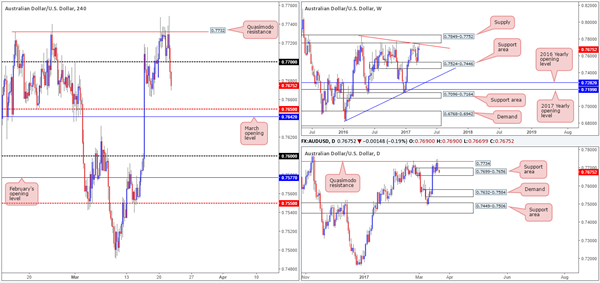
Having failed to sustain gains beyond the H4 Quasimodo resistance level at 0.7732 yesterday, the pair entered into something of a free-fall. The 0.77 handle was wiped off the chart, with price now looking set to challenge the 16th March lows at 0.7663, followed closely by the H4 mid-way support hurdle at 0.7650 and March's opening base line at 0.7642. Whilst this selloff is indeed backed by a weekly trendline resistance taken from the high 0.7835, it may be worth noting that the daily candles are currently trading within a daily support area marked at 0.7699-0.7656.
Our suggestions: Although downside momentum appears incredibly strong right now, selling into a daily support area is just too risky for our liking. Before our team can consider shorts, a H4 close is required beyond March's opening level at 0.7642. Not only will this likely clear our bids from within the current daily support area, it seems to also open up some space on the H4 chart down to the 0.76 handle. A H4 close below 0.7642, followed up with a strong retest would, in our view, be ideal grounds to sell this market!
Data points to consider: RBA Assistant Gov. Debelle speaks at 1.40am GMT.
Levels to watch/live orders:
- Buys: Flat (stop loss: N/A).
- Sells: Watch for price to engulf 0.7642 and then look to trade any retest seen thereafter (stop loss: dependent on the rejection candle, as ideally we'd look to place it beyond the rejection candle's wick).
USD/JPY
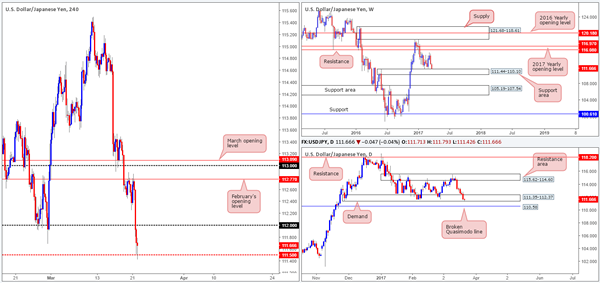
With US equity prices falling sharply yesterday, this, as you can see, revived demand for the safe-have yen! H4 price staged a rather aggressive selloff from the underside of February's opening line at 112.77, consequently breaching the 112 handle and slam dunking itself into the H4 mid-way support barrier at 111.50 at the close. Whilst 111.50 is a support in and of itself, we would not consider it stable enough to justify a long. But, knowing that this number is placed within the walls of a daily support area at 111.35-112.37 along with weekly price skimming the top edge of a weekly support area at 111.44-110.10, the 111.50 level becomes a worthy contender as far as supports go.
Our suggestions: Should 115.50 produce a reasonably sized H4 bullish rotation candle today, a buy from here is high probability. Should the above come to fruition, we'd be looking for price to engulf 112 and head back up to retest February's opening level. This, in our estimation, is a solid take-profit target.
Data points to consider: There's little scheduled news on the docket today.
Levels to watch/live orders:
- Buys: 115.50 region ([waiting for a reasonably sized H4 bull candle to form is advised before pulling the trigger] stop loss: ideally beyond the confirming candle).
- Sells: Flat (stop loss: N/A).
USD/CAD
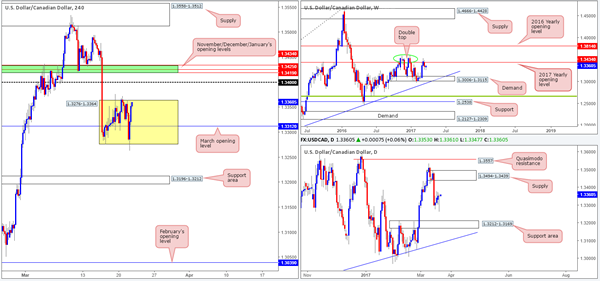
The USD/CAD staged an impressive comeback going into the US session yesterday on the back of declining oil prices. As we write, the pair is seen trading within touching distance of 1.3364 (the top edge of the current H4 range). A violation of this boundary could send the unit up to the 1.34 handle, or quite possibly the 1.3434/1.3419 area (November, December and January's opening levels).
Right now, there is very little higher-timeframe structure in play so it's difficult to judge direction. However, in the event that a break to the upside is seen, our team would be very interested in the 1.3434/1.3419 zone. The reason for this is simple. Psychological handles are prone to fakeouts, and with this H4 area lurking just above 1.34, we feel it'd be a fantastic barrier to help facilitate a fakeout.
Our suggestions: Look to short 1.3434/1.3419. For those concerned that a fakeout through this area may also take place, we would strongly recommend waiting for a lower-timeframe sell signal to form (see the top of this report).
Data points to consider: Crude oil inventories at 2.30pm, Canadian Gov. Council member Schembri speaks at 7.45pm GMT.
Levels to watch/live orders:
- Buys: Flat (stop loss: N/A).
- Sells: 1.3434/1.3419 ([waiting for a lower-timeframe sell signal to form is advised before pulling the trigger] stop loss: dependent on where one confirms this area).
USD/CHF
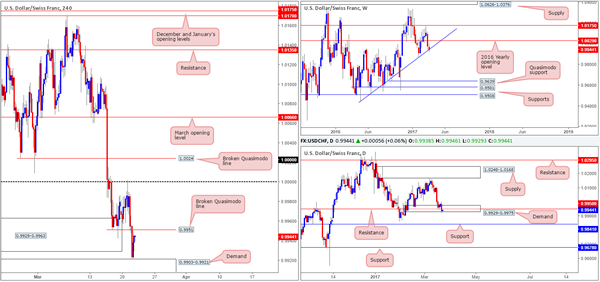
In view of weekly action now touching gloves with a weekly ascending trendline extended from the low 0.9443, shorting this market (medium term) may be a problem! Down on the daily chart, price closed below daily support at 0.9950 (now acting resistance), but failed to close below the daily demand in which it's housed in at 0.9929-0.9975. Looking over to the H4 candles, we can see that the Swissy punched beyond the H4 demand at 0.9929-0.9963 and missed the next H4 demand seen just below it at 0.9903-0.9921 by a cat's whisker.
Our suggestions: Given the above points, and taking into account that H4 price is capped between the H4 demand base at 0.9903-0.9921 and a H4 broken Quasimodo line at 0.9951, this market is a difficult piece to read at the moment.
In order to go long, we would prefer to see a daily close back above the daily resistance at 0.9950. As for shorts, we would not even attempt to go down this trail given the weekly trendline currently in play! Therefore, we feel it is best to remain on the sidelines today.
Data points to consider: There's little scheduled news on the docket today.
Levels to watch/live orders:
- Buys: Flat (stop loss: N/A).
- Sells: Flat (stop loss: N/A).
DOW 30
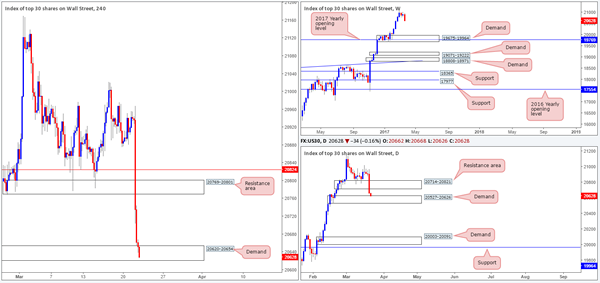
US stocks fell sharply going into the early hours of US trading yesterday. The index dropped 250 points on the day (open/close) and took out multiple tech supports along the way! As you can see, the H4 candles ended the session shaking hands with the H4 demand at 20620-20654, which happens to be positioned around the top edge of a daily demand base coming in at 20527-20626.
With the bulls yet to make an appearance, and the weekly chart indicating that this market has the potential to selloff all the way back down to the weekly demand area pegged at 19675-19964, we have no intention of buying this market just yet!
Our suggestions: To prove buyer intent within the current H4 demand, we would need to see a reasonably sized H4 bullish rotation candle form from here. This would, in our opinion, be enough evidence to justify a buy trade, targeting the underside of the daily resistance area at 20714, followed closely by the H4 resistance area at 20769-20801.
Data points to consider: There's little scheduled news on the docket today.
Levels to watch/live orders:
- Buys: 20620-20654 ([waiting for a reasonably sized H4 bull candle to form is advised before pulling the trigger] stop loss: ideally beyond the confirming candle).
- Sells: Flat (stop loss: N/A).
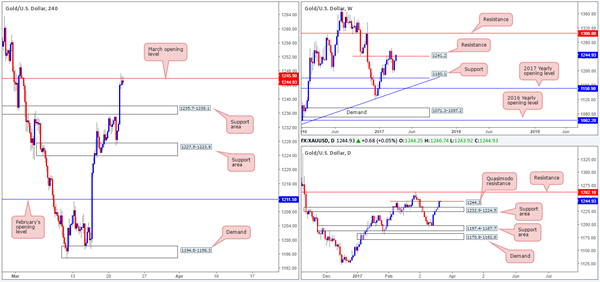
GOLD
Across the board we saw the US dollar take a hit. This, as you can see, lifted the price of gold higher, breaking through a H4 resistance area at 1235.7-1238.1 (now a support zone) and tagging March's opening level at 1245.9 by the day's end.
While 1245.9 is holding ground, there has not been much bearish intent registered from here as of yet. However, considering that weekly resistance at 1241.2 and the daily Quasimodo resistance at 1244.3 are both in play right now, we do expect to see a H4 bearish rotation candle present itself from 1245.9 today.
Our suggestions: Should this be the case, we would look to sell the close of the H4 bearish candle and target the H4 support area mentioned above at 1235.7-1238.1.
Levels to watch/live orders:
- Buys: Flat (stop loss: N/A).
- Sells: 1245.9 region ([waiting for a reasonably sized H4 bear candle to form is advised before pulling the trigger] stop loss: ideally beyond the confirming candle).
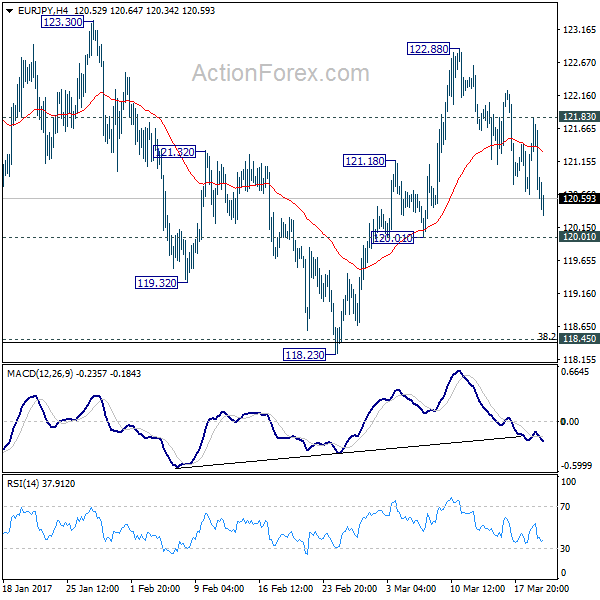
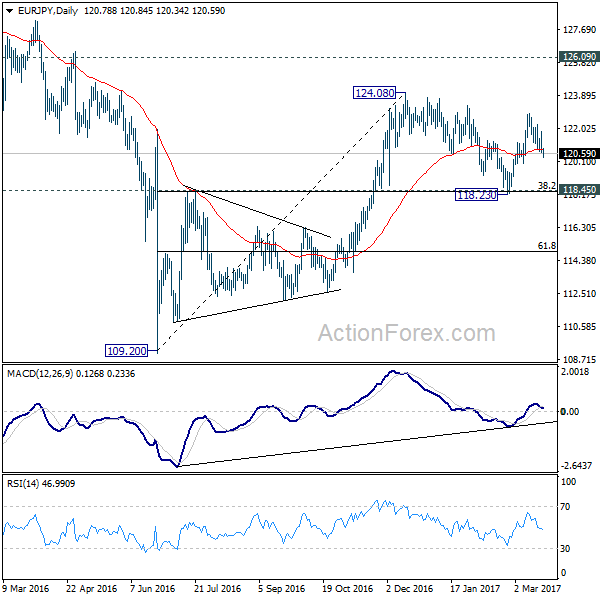
EUR/JPY Daily Outlook
Daily Pivots: (S1) 120.30; (P) 121.06; (R1) 121.52; More...
EUR/JPY's fall from 122.88 resumed by breaking 120.65 and reaches as low as 120.43 so far. Intraday bias is back on the downside for 120.01 support. Overall, price actions from 124.08 are seen as a consolidation pattern. Strong support is expected from 118.45 (38.2% retracement of 109.20 to 124.08 at 118.39) to contain downside and bring rebound. Above 121.83 minor resistance will turn bias to the upside for 122.88 and then 124.08.
In the bigger picture, we're holding on to the view that medium term rise from 109.20 is still in progress. Focus is on 126.09 key resistance level. Sustained break will confirm completion of the whole decline from 149.76. And rise from 109.20 is of the same degree as the fall from 149.76. In such case, further rally would be seen to 104.04 resistance and possibly above before topping. Meanwhile, rejection from 126.09, or firm break of 118.45 cluster support, will likely extend the fall from 149.76 through 109.20 low.
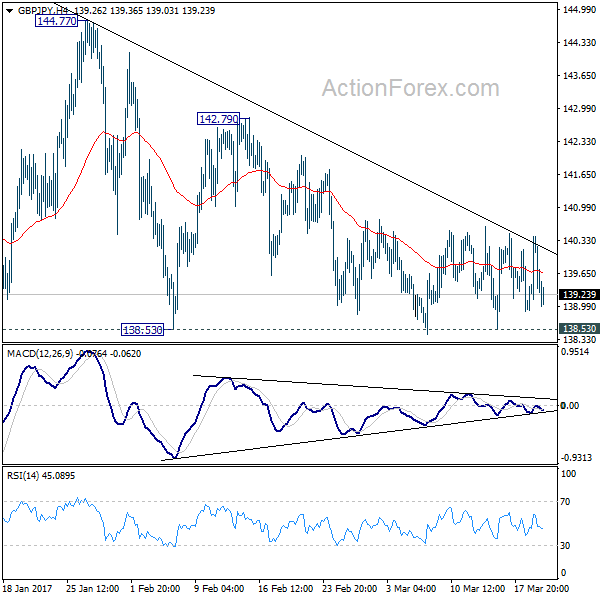
GBP/JPY Daily Outlook
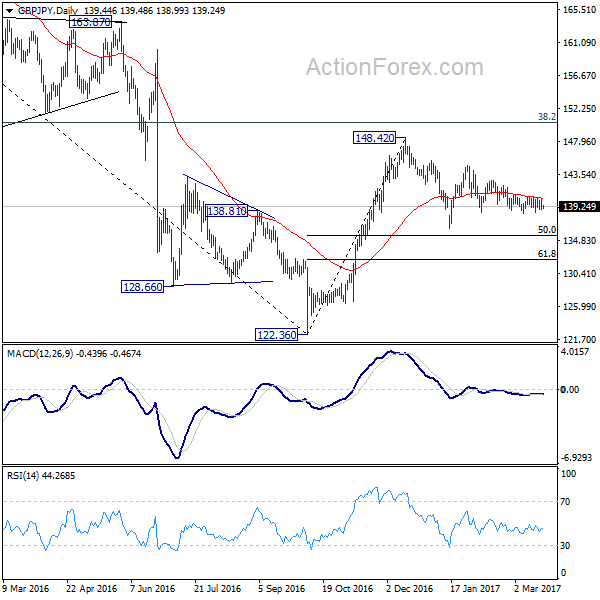
Daily Pivots: (S1) 138.74; (P) 139.57; (R1) 140.24; More...
GBP/JPY is still staying in tight range above 138.53 support and intraday bias stays neutral. Price actions from 148.42 are forming a consolidation pattern. And there is no clear sign of completion yet. On the downside, break of 138.53 support would trigger bring deeper fall to 136.44 support and possibly below. We'd expect strong support from 50% retracement of 122.36 to 148.42 at 135.39 to contain downside and bring rebound. On the upside, break of 142.79 resistance will turn bias to the upside and send GBP/JPY through 144.77 resistance.
In the bigger picture, price actions from 122.36 medium term bottom are still seen as a corrective pattern. Main focus is on 38.2% retracement of 195.86 to 122.36 at 150.42. Rejection from there will turn the cross into medium term sideway pattern. Or, sustained break of 50% retracement of 122.36 to 148.42 at 135.39 will turn outlook bearish for a test on 122.36 low. Though, sustained break of 150.42 will extend the rebound towards 61.8% retracement of 195.86 to 122.36 at 167.78.
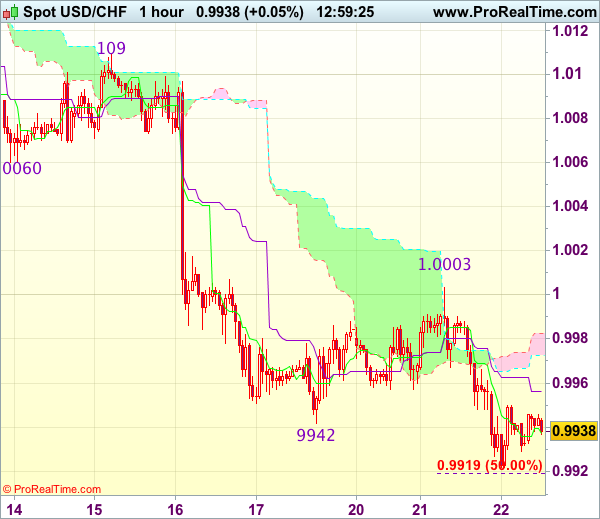
Trade Idea : USD/CHF – Sell at 1.0000
USD/CHF - 0.9940
Most recent candlesticks pattern : N/A
Trend : Near term down
Tenkan-Sen level : 0.9938
Kijun-Sen level : 0.9956
Ichimoku cloud top : 0.9983
Ichimoku cloud bottom : 0.9973
Original strategy :
Sell at 1.0000, Target: 0.9900, Stop: 1.0035
Position : -
Target : -
Stop : -
New strategy :
Sell at 1.0000, Target: 0.9900, Stop: 1.0035
Position : -
Target : -
Stop : -
Yesterday’s selloff after meeting renewed selling interest at 1.0003 adds credence to our view that recent decline from 1.0171 is still in progress and may extend weakness to 0.9915-20 (50% projection of 1.0109-0.9942 measuring from 1.0003), then 0.9900 (61.8% projection), however, loss of downward momentum should prevent sharp fall below 0.9870-75 and reckon 0.9850 would hold from here, risk from there has increased for a rebound later.
In view of this, would not chase this fall here and would be prudent to sell dollar on recovery as 1.0000-05 should limit upside and bring another decline. Only above previous support at 1.0060 (now resistance) would abort and signal low is formed instead, risk rebound to 1.0090-95 first.
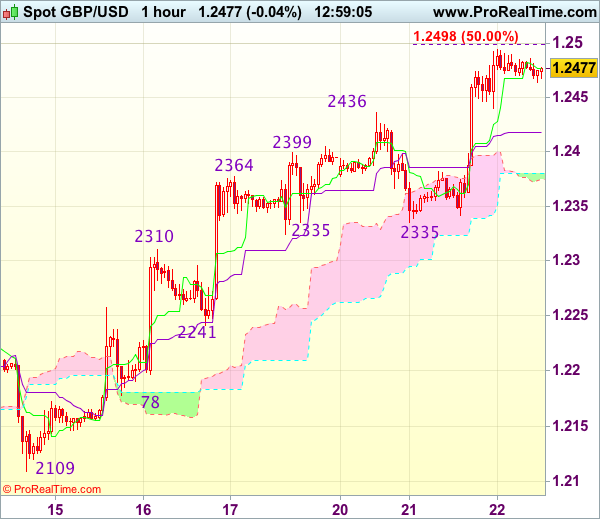
Trade Idea : GBP/USD – Buy at 1.2400
GBP/USD - 1.2475
Most recent candlesticks pattern : N/A
Trend : Near term up
Tenkan-Sen level : 1.2477
Kijun-Sen level : 1.2418
Ichimoku cloud top : 1.2380
Ichimoku cloud bottom : 1.2374
Original strategy :
Buy at 1.2400, Target: 1.2500, Stop: 1.2365
Position : -
Target : -
Stop : -
New strategy :
Buy at 1.2400, Target: 1.2500, Stop: 1.2365
Position : -
Target : -
Stop : -
As cable has continued trading with a firm undertone after yesterday’s rally above previous resistance at 1.2436, adding credence to our bullish view that the rise from 1.2109 has resumed and bullishness remains for further gain to 1.2500 (approx. 50% projection of 1.2109-1.2436 measuring from 1.2335), however, near term overbought condition should prevent sharp move beyond 1.2540-50 and price should falter below previous chart resistance at 1.2570, risk from there has increased for a retreat to take place later.
In view of this, would not chase this move from here and we are looking to buy cable on pullback as 1.2400-10 should limit downside. Below 1.2380-85 would defer and risk correction to 1.2350 but support at 1.2335 should remain intact.
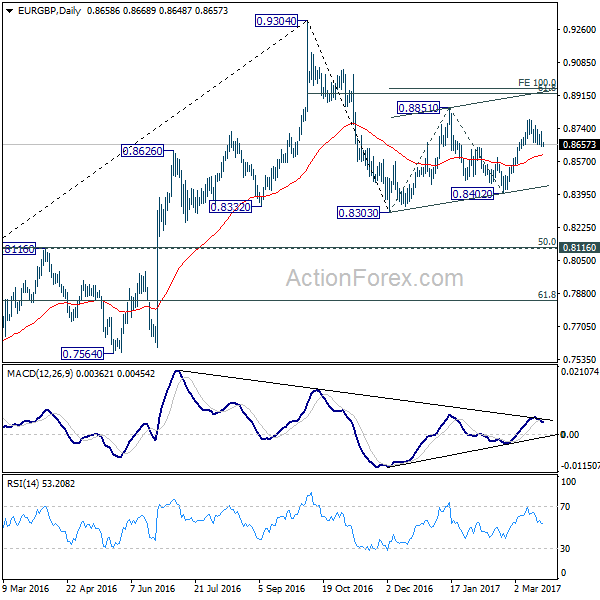
EUR/GBP Daily Outlook
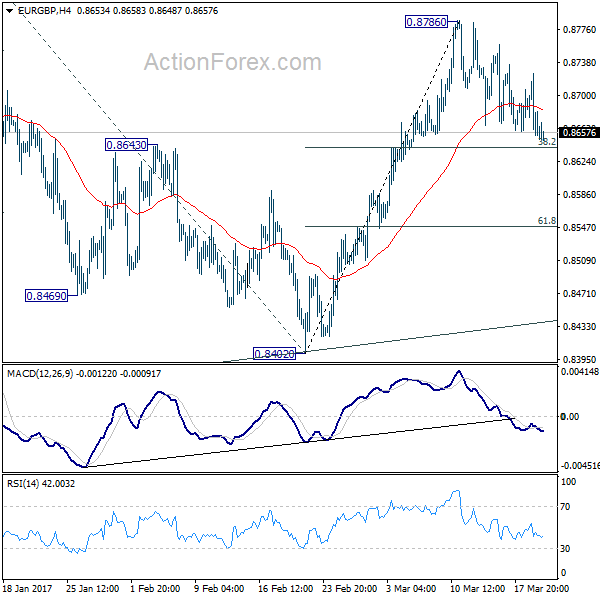
Daily Pivots: (S1) 0.8631; (P) 0.8679; (R1) 0.8708; More...
EUR/GBP's correction from 0.8786 is still in progress and intraday bias remains neutral. In case of another fall, we'd expect support from 38.2% retracement of 0.8402 to 0.8786 at 0.8639 to contain downside. Break of 0.8786 will target 0.8851 resistance and above. Price actions from 0.8303 are seen as the second leg of the corrective pattern from 0.9304. Hence, we'd expect strong resistance from 100% projection of 0.8303 to 0.8851 from 0.8402 at 0.8950 to limit upside. On the downside, sustained trading below 0.8693 will bring deeper fall to 61.8% retracement 0.8549 and below.
In the bigger picture, price actions from 0.9304 are viewed as a medium term corrective pattern. Deeper fall cannot be ruled out yet. But we'd expect strong support from 0.8116 cluster support (50% retracement of 0.6935 to 0.9304 at 0.8120) to contain downside. Overall, the corrective pattern would take some time to complete before long term up trend resumes at a later stage. Break of 0.9304 will pave the way to 0.9799 (2008 high).
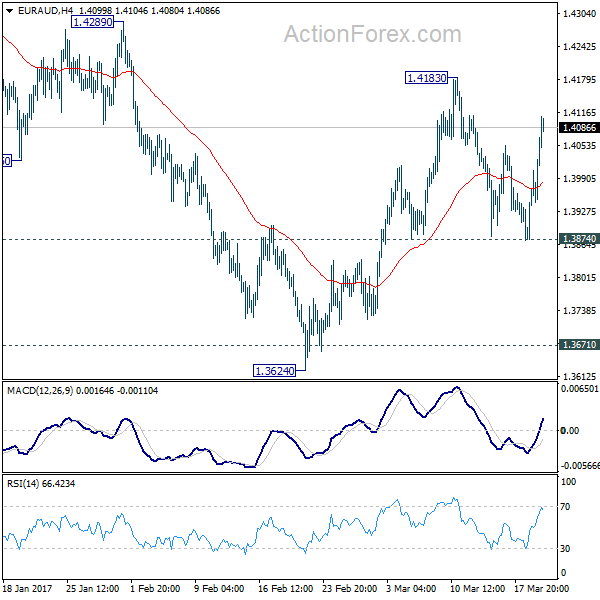
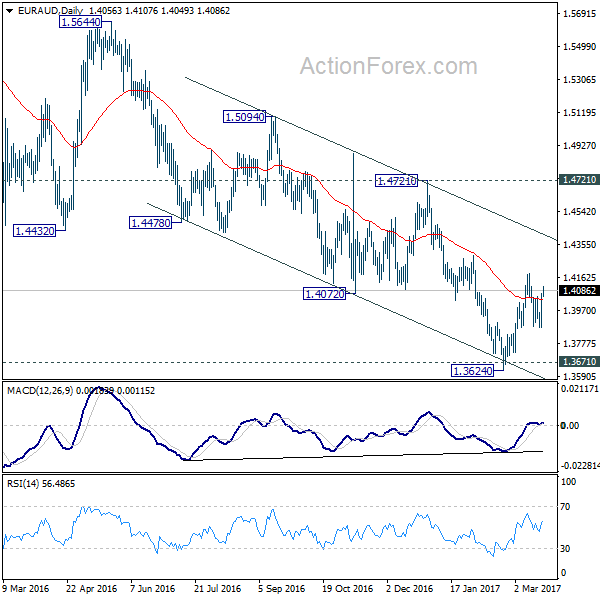
EUR/AUD Daily Outlook
Daily Pivots: (S1) 1.3929; (P) 1.3999; (R1) 1.4123; More...
Intraday bias in EUR/AUD remains neutral for the moment. With 1.3874 minor support intact, we're still favoring the case of trend reversal after defending key support level at 1.3671. This is supported by bullish convergence condition in daily MACD. On the upside, above 1.4183 will turn bias to the upside for 1.4289 resistance next. Break will affirm our view and target next key resistance level at 1.4721. However, break of 1.3874 minor support will invalidate our view and turn bias back to the downside for retesting 1.3624 low.
In the bigger picture, price actions from 1.6587 medium term top are viewed as a corrective pattern. We'd expect strong support from 1.3671 key level to contain downside and bring rebound. Up trend from 1.1602 should not be finished and will resume later. Break of 1.4721 resistance will indicate completion of such correction and turn outlook bullish for retesting 1.6587 high. However, sustained break of 1.3671 will invalidate our bullish view and would turn focus back to 1.1602 long term bottom.
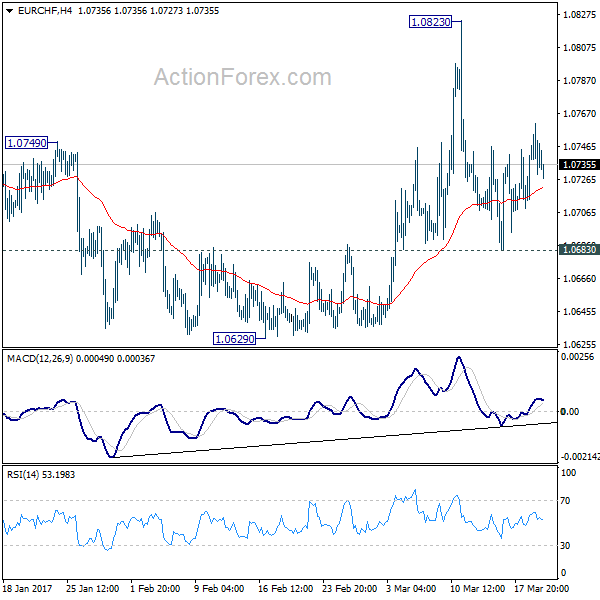
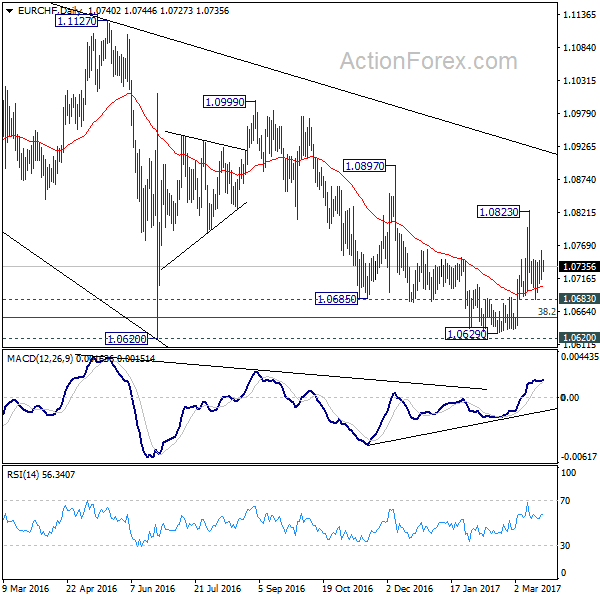
EUR/CHF Daily Outlook
Daily Pivots: (S1) 1.0718; (P) 1.0740; (R1) 1.0764; More...
Intraday bias in EUR/CHF remains neutral at this point. On the upside, break of 1.0823 resistance will re-affirm the case of trend reversal. And intraday bias will be turned back tot he upside for 1.0897 resistance for confirmation. However, break of 1.0683 minor support will turn bias to the downside for 1.0620 key support level again.
In the bigger picture, the decline from 1.1198 is seen as a corrective move. Decisive break of 1.0897 resistance should confirm that it's completed. And in that case, larger up trend is resuming for another high above 1.1198. Meanwhile, sustained trading below 38.2% retracement of 0.9771 to 1.1198 at 1.0653 will target 50% retracement at 1.0485.
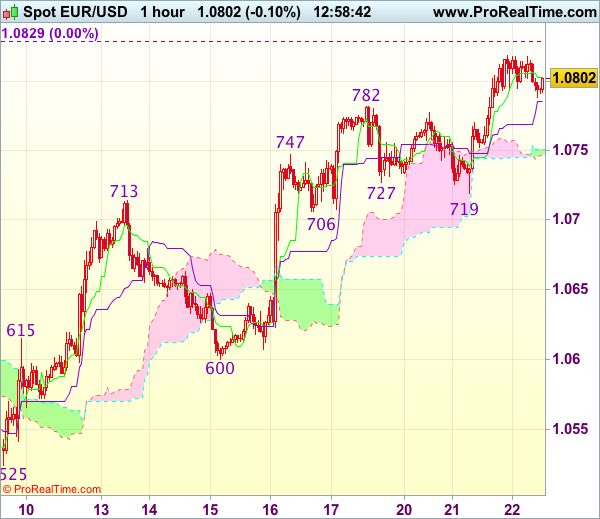
Trade Idea : EUR/USD – Buy at 1.0725
EUR/USD - 1.0799
Most recent candlesticks pattern : N/A
Trend : Near term up
Tenkan-Sen level : 1.0803
Kijun-Sen level : 1.0786
Ichimoku cloud top : 1.0751
Ichimoku cloud bottom : 1.0746
Original strategy :
Buy at 1.0725, Target: 1.0840, Stop: 1.0690
Position : -
Target : -
Stop : -
New strategy :
Buy at 1.0725, Target: 1.0840, Stop: 1.0690
Position : -
Target : -
Stop : -
As the single currency has maintained a firm bias after surging again yesterday, suggesting recent erratic upmove from 1.0493 low is still in progress and may extend further gain to previous chart resistance at 1.0829, however, loss of near term upward momentum should prevent sharp move beyond 1.0850-60 and price should falter well below 1.0890-00, risk from there has increased for a retreat to take place later.
In view of this, would not chase this rise here and we are looking to buy euro on subsequent pullback as 1.0706 support should limit downside and bring another rise later. Below 1.0675-80 would defer and suggest top is possibly formed, risk weakness to 1.0640 (previous resistance now support) but still reckon indicated support at 1.0600 would remain intact.
Trade Idea : USD/JPY – Stand aside
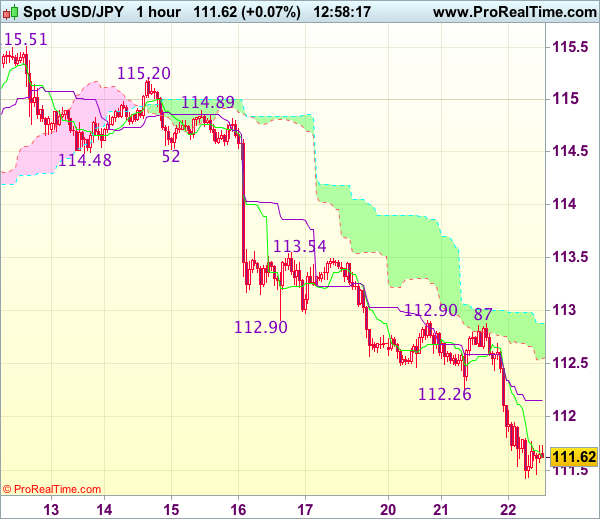
USD/JPY - 111.68
Most recent candlesticks pattern : N/A
Trend : Near term down
Tenkan-Sen level : 111.62
Kijun-Sen level : 112.15
Ichimoku cloud top : 112.88
Ichimoku cloud bottom : 112.54
New strategy :
Stand aside
Position : -
Target : -
Stop : -
Although the greenback has remained under pressure after yesterday’s selloff and near term downside risk remains for recent decline from 115.51 to extend further weakness to 111.40 (50% projection of 115.20-112.26 measuring from 112.87), however, near term oversold condition should prevent sharp fall below 111.00-05 (61.8% projection) would hold, bring rebound later.
In view of this, would not chase this fall here and would be prudent to stand aside in the meantime. Above the Kijun-Sen (now at 112.15) would bring test of previous support at 112.26 but break there is needed to signal low is formed, then a stronger rebound to 112.65-70 would follow, however, only break of resistance at 112.87-90 would provide confirmation.