Sample Category Title
USDJPY Elliott Wave View: Near Bounce
Short term Elliott Wave view in USDJPY suggests that rally to 115.48 on 3/10 ended Intermediate wave (X). Decline from there is unfolding as a zigzag Elliott wave structure in which the first leg Minor wave A is subdivided in 5 impulsive waves. Down from 3/10 high, Minute wave ((i)) ended at 114.46, Minute wave ((ii)) ended at 115.195, Minute wave ((iii)) ended at 112.88 and Minute wave ((iv)) ended at 113.56. Cycle from 3/10 high is mature and Minor wave A has enough extension to be called complete, but more downside towards 110.088 – 111.12 area can’t be ruled out to complete Minor wave A. Afterwards, pair should bounce in Minor wave B in 3, 7, or 11 swing to correct cycle from 3/10 high before the decline resumes. We do not like buying the proposed bounce in Minor wave B and expect sellers to appear when Minor wave B bounce is done in 3, 7, or 11 swing later for another extension lower.
USDJPY 1 Hour Chart
Foreign Exchange Market Commentary
EUR/USD
Dollar's bearish run extended to fresh 1-month lows against its European rivals, which rallied on positive news coming from the region. The common currency got a boost from the outcome of the first French presidential debate, as Emmanuel Macron was the most convincing. Still Marine Le Pen leads vote intention polls, with 28%, followed by Macron, who gained some points and now has 24%. The far-left right losing the Dutch election, and now suffering a modest defeat in France brought some relief to EUR's bulls, who rushed to push the pair higher in a weakening-dollar environment. Despite the American currency remained under pressure during Wall Street's trading hours, with stocks plunging and Treasuries soaring, the EUR/USD pair was unable to advance beyond 1.0820, a major Fibonacci resistance, paring gains at 1.0818 and settling for the day not far below this last.
The macroeconomic calendar remained scarce, situation that will repeat this Wednesday, being the most remarkable release US existing home sales. In the meantime, and from a technical point of view, the EUR/USD pair maintains the bullish stance hovering a few pips below the 50% retracement of the post-US election decline at the mentioned 1.0820 level. In the 4 hours chart, the 20 SMA heads sharply higher below the current level, currently at 1.0765, whilst technical indicators have lost their bullish strength and turned flat near overbought readings, but far from indicating an upcoming downward move. A break above 1.0828, February high, could see the pair extending up to December monthly high, en route to 1.0930, the 61.8% retracement of the mentioned slide.
Support levels: 1.0765 1.0730 1.0700
Resistance levels: 1.0830 1.0870 1.0910
USD/JPY
The USD/JPY pair fell below the 112.00 level for the first time since early February, trading as low as 111.68 before bouncing some 20 pips. The pair has spent most of the first half of the day consolidating within its Monday's range, but broke south after Wall Street's opening, as stocks plunged to fresh 4-week lows, whilst Treasury yields followed suit. US government bonds surged as the dollar came under pressure, leading to a sharp retracement in yields. The 10-year note yield sunk to 2.42% from previous 2.47%, while the 30-year benchmark is down to 3.04% from 3.09% previously. Japan will release its February trade balance figures and the Minutes of the latest BOJ's meeting during the upcoming Asian session, which may lead to further gains in the yen. From a technical point of view, the bearish potential remains strong, albeit the pair has a major support around 111.65, from where it bounced several times during the past two months. Nevertheless, and in the 4 hours chart, the price is well below its 100 and 200 SMAs that anyway remain flat, while technical indicators remain within negative territory, with the RSI now consolidating around 28, somehow reflecting easing selling interest. At the same time, the pair is unable to recover above 112.00, the 38.2% retracement of late 2016 rally, now the immediate resistance.
Support levels: 111.65 111.20 110.70
Resistance levels: 112.00 112.50 112.90
GBP/USD
The GBP/USD pair trades at its highest since late February, having extended its intraday advance up to 1.2493 and ending the day some 10 pips below this last. The Pound soared after the release of UK inflation data, as consumer prices rose far beyond expected. Yearly CPI hit 2.3% in February from 1.8% in January, while monthly basis, inflation surged by 0.7& from a previous decline of 0.5%. Core yearly inflation jumped to 2.3%. Producer prices rose less than expected, but remained high in the same month, while the Retail Price Index jumped to 3.2% YoY. The readings came less than a week after the BOE shifted to a hawkish stance, with Christine Forbes voting for a rate hike and with the rest of the MPC not far below her, ending up fueling speculation that the BOE will have to raise rates rather sooner than later. The 4 hours chart shows that technical indicators have lost upward momentum, turning flat in overbought territory, although given that the price holds near its daily high, chances of a downward corrective move are limited. In the same chart, the 20 SMA heads sharply higher some 100 pips below the current level, reflecting the strength of the intraday advance. The pair has settled above 1.2425 the 38.2% retracement of the January rally and the critical support, as the bullish stance will likely persists as long as the price remains above it.
Support levels: 1.2345 1.2300 1.2260
Resistance levels: 1.2425 1.2470 1.2510
GOLD
Spot gold jumped to a fresh 3-week high of $1,247.54 a troy ounce, to settle at 1,244.60 by the end of the US session, as the dollar index plunged to its 99.42, its lowest since February 2nd, while the American currency weakened against most of its major counterparts. Further fueling the advance during US trading hours was Wall Street's slump, with the DJIA down over 200 points. Gold's daily chart presents a bullish stance, as the price held above its 20 SMA on an early slide, while technical indicators maintain upward slopes within positive territory, and particularly the RSI indicator anticipates some further gains, heading north around 63. Still the rallied stalled right below a bearish 200 DMA, currently the immediate resistance at 1,249.25. Above it, the bright metal has scope to retest February high of 1,263.79. Technical readings in the 4 hours chart support an upward continuation as the 20 SMA has extended its advance above the 100 and 200 SMAs, whilst technical indicators continue heading north, easing partially after reaching overbought readings.
Support levels: 1,236.80 1,230.10 1,223.15
Resistance levels: 1,249.25 1,255.60 1,263.80
WTI CRUDE
Crude oil prices resumed their declines after a failed attempt to regain the 50.00 threshold, with West Texas Intermediate futures settling at $48.29 a barrel. The commodity has been undermined by oversupply concerns for over two weeks already, whilst this latest decline can be attributed to diminishing hopes that the OPEC will extend its output cut, as half-way into it is proving useless. Ahead of the release of US stockpiles data, the daily chart for the black gold shows that selling interest once again contained the advance around the 200 DMA, while technical indicators have resumed their declines within bearish territory, maintaining the risk towards the downside. In the 4 hours chart, the 20 SMA gains bearish momentum above the current level, whilst technical indicators have decelerated their bearish strength within negative territory, but support further declines anyway, as the RSI indicator heads south around 36.
Support levels: 48.00 47.30 46.65
Resistance levels: 49.20 49.75 50.50
DJIA
Wall Street had its worst day since last October, with the Dow Jones Industrial Average plummeting 237 points or 1.14%, to end the day at 20,668.01, its lowest in a month. The Nasdaq Composite set an all-time high after the opening, but closed the day 107 points lower at 1.2%, while the S&P shed 29 points to 2,344.02. The decline was led financial and industrial equities, disappointed by absence of news on Trump's promised policies. The decline was exacerbated by Fed's Kashkari comments, who suggested that the Central Bank could rise rates just by 0.75% more to reach its comfort neutral level. Within the Dow, only Coca Cola that added 0.76% and Chevron, up 0.35% closed in the green. Goldman Sachs led decliners, shedding 3.77% and followed by Caterpillar that closed 3.11% lower. From a technical point of view, the daily chart presents a strong bearish stance now, with the benchmark settling near its daily low, and breaking well below its 20 DMA, whilst technical indicators have entered bearish territory with sharp downward slopes. In the 4 hours chart the benchmark settled below its 200 SMA the immediate resistance at 20,686, while technical indicators turned flat within oversold levels, reflecting the sudden decrease in volume after the close rather than suggesting the index won't fall further.
Support levels: 20,654 20,610 20,574
Resistance levels: 20,686 20,732 20,783
FTSE 100
The FTSE 100 closed the day at 7,378.34, down 51 points or 0.69%, weighed by a strong Pound that soared after the release of UK inflation data which rose much more than expected. Mining related equities were the worst performers, although Fresnillo led gainers, up by 1.64%, followed by industrial BNZL that added 1.28%. Fresnillo advanced, despite Goldman Sachs reaffirmed its sell rating on the company, underpinned by gold's rally. Glencore was the worst performer, down 4.24%, followed by Rio Tinto that shed 4.12% and BHP Billiton that closed down 3.97%. The benchmark fell further in after-hours trading, tracking Wall Street's decline, heading into Asian opening at 7,348, is lowest for the week. Technically, the daily chart shows that the index is pressuring its 20 DMA, while technical indicators have turned sharply lower with the Momentum crossing its mid-line and the RSI indicator currently at 52. In the 4 hours chart, technical indicators head sharply lower, now approaching oversold readings, whilst the benchmark broke below a now flat 20 SMA. The immediate support comes at 7,331, past week low, with a break below it opening doors for a steeper slide towards 7,262, March 9th daily low.
Support levels: 7,331 7,294 6,262
Resistance levels: 7,367 7,400 7,439
DAX
The German DAX fell 90 points or 0.75%, to end the day at 11,962.13. European equities fell after a solid start to the day triggered by the French presidential debate, weighed by the negative tone of their American counterparts. Within the DAX, only 3 components closed higher, with Deutsche Bank up 3.45%, Commerzbank adding 0.35% and Bayerische Motoren Werke gaining 0.30%. The decline was led by Fresenius Medical Care which lost 3.51%, followed by Deutsche Lufthansa that shed 3.38%. The decline continued after the London's close, with the DAX now trading some 50 points below its close, and poised to extend its slide, given that in the daily chart, the benchmark broke below its 20 DMA for the first time since early February, whilst technical indicators head sharply lower, having entered negative territory. In the shorter term, and according to the 4 hours chart, the benchmark slide extended below the 20 and 100 SMAs, whilst technical indicators pared their decline near oversold territory, but continue favoring a downward extension.
Support levels: 11,895 11,857 11,811
Resistance levels: 11,947 11,987 12,039
NZD/USD Candlesticks and Ichimoku Analysis
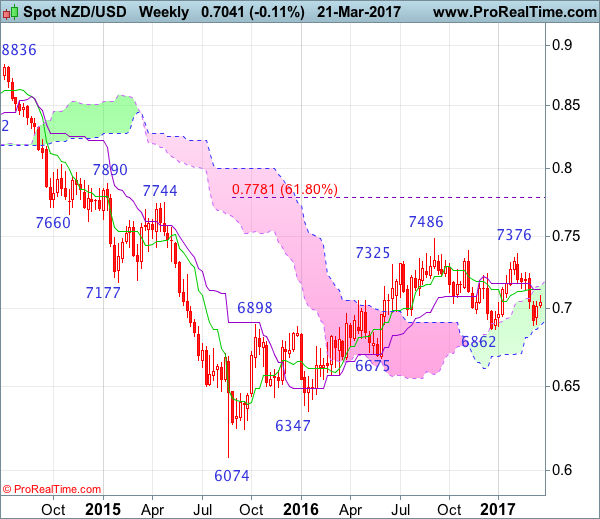
Weekly
• Last Candlesticks pattern: Shooting star
• Time of formation: 5 Sep 2016
• Trend bias: Down
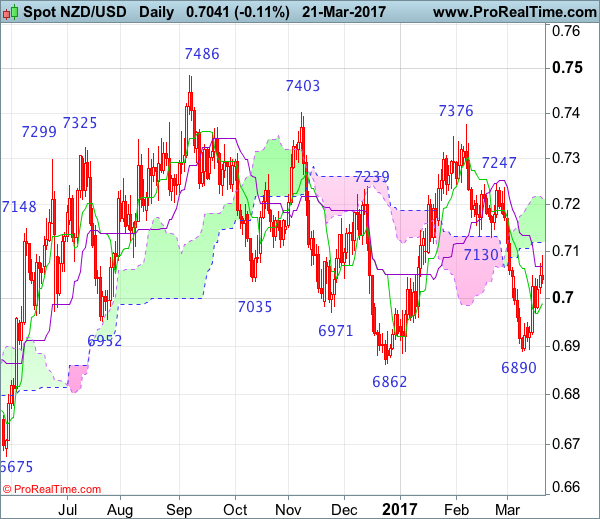
Daily
• Last Candlesticks pattern: Hammer
• Time of formation: 14 Mar 2017
• Trend bias: Near term up
NZD/USD – 0.7030
Although kiwi fell sharply to as low as 0.6890 earlier this month, as the pair found good support there and has staged a strong rebound since, suggesting low has been formed there and consolidation with mild upside bias is seen for the rebound from 0.6890 to bring at least a retracement of recent decline from 0.7376, hence further gain to the lower Kumo (now at 0.7119) is likely, however, break of previous support at 0.7130 is needed to retain bullishness and encourage for further subsequent rise to 0.7185-90 but resistance at 0.7247 should remain intact.
On the downside, whilst pullback to 0.7030-40 is likely, reckon downside would be limited to the Tenkan-Sen (now at 0.6990) and bring another rise later. Below support at 0.6968 would defer and risk weakness to 0.6920-30 but still reckon said support at 0.6890 would hold from here. Only a break below 0.6890 would revive bearishness and extend the fall from 0.7376 top to 0.6862, then towards 0.6775-80 (50% Fibonacci retracement of 0.6074-0.7486) but price should stay well above previous chart support at 0.6675.
Recommendation: Turn long at 0.6980 for 0.7180 with stop below 0.6880
On the weekly chart, as kiwi found good support at 0.6890 and staged a rebound from there, suggesting the fall from 0.7376 has possibly ended there and consolidation with mild upside bias is seen for test of the Kijun-Sen (now at 0.7133), a weekly close above there would add credence to this view and encourage for further gain towards resistance at 0.7247. Having said that, as broad outlook remains consolidative, reckon upside would be limited to 0.7300-10 and price should falter below said resistance at 0.7376, bring retreat later.
On the downside, expect pullback to be limited to 0.7000-10 and bring another rebound. Only below said support at 0.6890 would abort and bring test of previous support at 0.6862, however, a breach of latter level is needed to retain bearishness and extend the erratic decline from 0.7486 top to 0.6780 (50% Fibonacci retracement of 0.6074-0.7486) and later towards previous chart support at 0.6675 which is likely to hold from here.
AUD/USD Candlesticks and Ichimoku Analysis
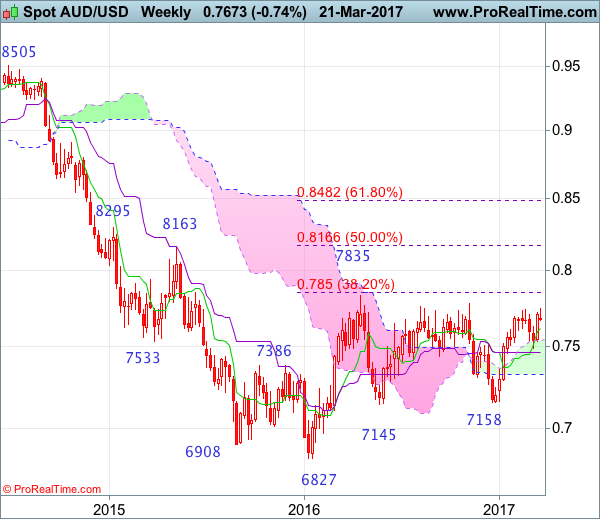
Weekly
• Last Candlesticks pattern: Morning star
• Time of formation: 2 Jan 2017
• Trend bias: Sideways
Daily
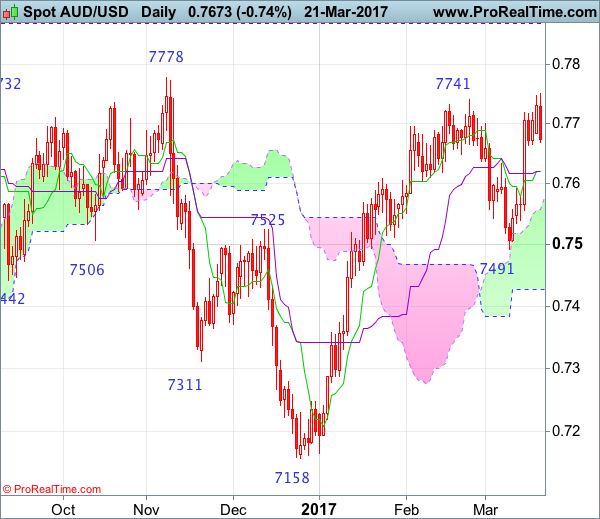
• Last Candlesticks pattern: Long white candlestick
• Time of formation: 15 Mar 2017
• Trend bias: Up
Last week’s rally has reinforced our bullishness and formed a long white candlestick on the daily chart, our long position entered at 0.7515 reached our indicated upside target at 0.7715 and upside bias remains for further gain to previous chart resistance at 0.7778, however, break there is needed to retain bullishness and confirm early erratic upmove from 0.6827 (2016 low) has resumed for retest of 0.7835 (2016 high) first but near term overbought condition should prevent sharp move beyond 0.7900-10 and price should falter well below psychological resistance at 0.8000.
On the downside, whilst pullback to 0.7700 cannot be ruled out, reckon downside would be limited to 0.7640-50 and the Kijun-Sen (now at 0.7620) should hold, bring another rise later. A daily close below the Kijun-Sen would defer and suggest top is possibly formed, bring correction towards the upper Kumo (now at 0.7558) and then 0.7540, however, price should stay well above support at 0.7491, bring another upmove later.
Recommendation: Long entered at 0.7515 met target at 0.7715 with 200 points profit and would buy again at 0.7600 for 0.7800 with stop below 0.7500.
On the weekly chart, aussie did find renewed buying interest at 0.7491 and has rallied in line with our bullish expectations, the breach of indicated resistance at 0.7741 adds credence to our view that the rebound from 0.7158 is still in progress for retest of resistance at 0.7778, however, as broad outlook remains consolidative, reckon upside would be limited and price should falter below 2016 high at 0.7835. Looking ahead, only above this level would suggest an upside break of recent established broad range has occurred, bring further subsequent rise to 0.7900 and later towards psychological level at 0.8000.
On the downside, although pullback to 0.7680-85 cannot be ruled out, reckon downside would bw limited to 0.7640-50 and bring another rise. A weekly close below the Tenkan-Sen (now at 0.7621) would defer and risk correction to 0.7570-75 but support at 0.7491 should remain intact, bring another rise later. Only a drop below 0.7491 would abort and signal the rise from 0.7158 has ended instead, risk further fall to the Kijun-Sen (now at 0.7468) and possibly 0.7400.
Spring in the Market
The change of the seasons on Tuesday brought a sea change in markets as volatility shot higher and risk aversion ramped up. The pound was the top performer while the New Zealand dollar lagged. Central bank speakers highlight Asia-Pacific trading.
The S&P 500 posted its worst day since Oct 1 on Tuesday in a 29-point fall. In FX, that meant selling on the yen crosses. USD/JPY briefly broke the bottom of the Feb/March range and whether it truly breaks will be the theme of the day ahead.
There wasn't a single catalyst for the change in mood but one worry is the lack of progress on Trump's promises on fiscal stimulus, tax cuts and deregulation. The first test is the repeal and replacement of Obamacare, which is the one thing that virtually every Republican agreed on in theory. Yet the first bill to replace it is facing a close vote in the House this week and will be defeated in the Senate.
That's something the market has known for days but the inability of Republicans to agree and implement what should be an easier part of their agenda is sparking questions about the rest of it.
Another worry is oil. For the past two days OPEC and Russia have floated some oil-positive stories. Both led to short-lived pops in crude that were erased in the following half-hour. Now, crude is re-testing the March low and API inventories showed another big build.
Another technical level to watch is the January high of 1.0829 in the euro. We've emphasized repeatedly how the US dollar struggled with good news like non-farm payrolls and the pricing in (and delivery) of a rate hike. Now the tide has turned and small doses of USD-negative news are having a big effect. That's a signal about an overcrowded trade that's thinning out.
Ultimately, central banks will write the next chapter but it's beginning to look like the good news is priced in for USD and others now have an opportunity. The BOJ's Funo and RBA's Debelle speak at 0130 GMT and 0140 GMT, respectively, and any hints at all about less-dovish policy will be met by JPY and/or AUD buying. Just after Debelle speaks, the Fed's Rosengren is in Bali to deliver remarks. We'll be curious to see if hawkish talk can stem the USD selling.
Aussie Dollar Prepares For A Shift In Bias
Key Points:
- Long-term trend line capping upsides.
- Divergence becoming apparent.
- Currently in overbought territory.
Despite a rather spectacular recovery last week, the Aussie Dollar could be on the cusp or resuming its recent downtrend. If such a reversal does occur, losses could be fairly substantial and might extend back to the 0.76 handle and beyond. However, given just how bullish the pair has been over the past few months, we might need to take closer look at just why the technical bias seems to be shifting.
Firstly, even at a glance it seems to be fairly obvious that the AUD is battling against a long-term descending trend line and a historical zone of resistance. Even by itself, this trend line hints that upsides are likely to be severely capped and this could prove to be the end of the post-FOMC rally. Only adding to the resistance is the pair’s overbought status on the stochastic oscillator which, whilst not shown, is still highly influential.
Aside from these more obvious signals, there is another technical argument that is highly suggestive of a decline moving forward. Namely, both the MACD and RSI oscillator are in agreement that a regular divergence is becoming apparent on both the daily, H4, and H1 charts. Typically, such a divergence indicates that underlying bearishness is about to come to a head and the bulls are totally exhausted. When combined with the overbought readings and the trend line, further bullishness now seems like a fairly remote prospect.
As a result of this shift in bias, we now expect to see the pair begin to retrace to around the 0.7609 mark before the return of any bullish sentiment. At this price, both the 50.0% Fibonacci level and the 100 day moving average will be providing some stiff support which could prove difficult to break through. Due to this impasse, we should then see the bulls mount a solid recovery which could inspire another rally in the medium-term, testing the trend line at around the 0.77 handle.
Ultimately, we may have to wait for the fundamentals bias to mirror the technical bias before any serious downsides are realised. Specifically, we might need to rely on either stronger US data or some particularly hawkish remarks from Yellen. However, the predisposition of the pair to take a dive is worth keeping in mind as it could see greater losses occur than would normally be expected. In short, it’s no longer just volatility on the rise but also downside risk for the AUD.
Trump Trade On The Ropes
The Trump Trade on the Ropes
The markets were looking rather positive for risk when I clocked out yesterday, as election fears in France subside after a steady performance from Macron. It all went downhill rapidly in the NY session as there are concerns about whether Trump and Ryan have enough votes to pass their new healthcare bill (repealing Obamacare) through Congress on Thursday, which brings into question their ability to pass tax and spending reforms further down the line. Apparently, investors are extrapolating much from this major setback as the market sours on the Trumpflation trade. It appears his lack of skilled political operators will hurt the enactment of his key initiatives. Needless to say, this also brings into question, whether in the Whitehouse, Foggy Bottom or overseas, if Trump’s administration has the politicians at his side to build key political relationships, negotiate huge deals both at home and abroad and more importantly, the backroom movers and shakers, to defuse problems before they become a crisis. But one thing we know for sure now is that there are no rubber stamps for Trump agenda.
The sharp stink of risk off has the S&P500 down 1.2%, US Treasuries rallying, while both crude oil and the US dollar have stumbled. All of which is pointing to a stern near term test for Trumpflation.
Today will be all about healthcare headlines and global equities fallout, which should provide a decent barometer for investor sentiment.
Australian Dollar
After US equities put on their weakest showing of the year, eyes now turn to a likely contagion effect on global equities which could weigh on the AUD/USD today. The markets are very fidgety about this political setback for the Trump administration, which will be the primary driver in today’s session and possibly beyond. No asset class was spared investors wrath with WTI -1.3% and Industrial Metals lower, led by Copper. The Aussie dollar’s resilience will certainly be tested as the Trump re-inflationary narrative comes under scrutiny.
Overnight GBP, EUR and JPY were the best performers, and while the Trump Dump played a part in each, all had a uniquely local story.
British Pound
UK consumer price inflation hurdled the Bank of England’s target of 2% for the first time since 2013, and the pound exploded higher. The rise to 2.3% YY in the CPI was well above expectations, which will undoubtedly pressure the MPC into considering a rate hike. However, the dust is far from settled on the Brexit campaign, and the BOE will likely opt for a uniform policy, as fear of the unknown may be a stronger motivator than the fear of the known (read inflation).
Euro
The EUR and Cross EUR has turned bid in the aftermath to the French elections debate, as the markets jump to conclusion and prices in a Le Pen defeat. But the significance of this shift is that it now provides the market with a singularity of focus on a possible ECB policy pivot. I suspect the EUR momentum was only capped by skittishness over potential global equity market fall about the implementation of Trump’s agenda as part of the bullish Euro storyline, which includes surging demand for EU assets as political risk abates. But clearing the political airwaves has indeed put the euro pointing higher, as dealers are now setting their sights on the lofty 1.1000 target. Keep an eye on the yearly high of 1.0829 as this could be a near-term tipping point for anyone holding short EUR positions. While we should expect heavy selling ahead, the momentum is clearly higher for the EUR.
Japanese Yen
USDJPY is more or less a tale of two sessions. After moving to 112.75 on post-French debate risk euphoria, the USDJPY fell prey to slumping US equity prices and risk aversion on the back of the Trump Obamacare debacle. With little top tier news on the agenda, traders worked themselves into a froth as the US political developments devolve.
Keep in mind that during this recent wave of risk aversion, the Moritomo scandal is simmering on the back burner and that with repatriation flows from Japanese corporations expected at fiscal year-end, we could see and acceleration on USDJPY, selling on a break of the 111 level. It’s going to be a nervy day on the dollar-yen desk as we open up just on top of significant support at 111.50-30. Let’s see who is first to blink.
BOJ released the January meeting minutes and stated the economy continued moderate recovery trend is encouraging but contained little forward guidance
Predictably Nikkei 225 has opened -1.6 % after the shoddy performance in US markets
Sharp CPI sends Pound to 4-Week High
GBP/USD has posted considerable gains on Tuesday, as the pair trades slightly below the 1.25 line in North American trade. On the release front, British CPI jumped to 2.3%, above the estimate of 2.1%. British Public Sector Net Borrowing posted a deficit of GBP 1.1 billion, much lower than the forecast of GBP 2.9 billion. In the US, Current Account posted a deficit of $112 billion, well below the estimate of $129 billion. FOMC member William Dudley spoke at an event in New York City, but did not discuss monetary policy.
Inflation in the UK continues to climb, led by CPI. The key consumer indicator rose 2.3% in February, beating the forecast of 2.1%. This is a significant reading, as it surpassed the BoE's inflation target of 2.0% for the first time in three years. Just one year ago, British CPI was sputtering at 0.3%. The British pound has plummeted 17% since the Brexit vote in June, and a weak pound has led to higher inflation levels.
British Prime Minister Theresa May has been saying for months that she wanted to trigger Article 50, the mechanism for triggering Brexit, at the end of March. May has stuck to her deadline, as the government announced on Monday that it would formally launch Brexit talks on March 29. The announcement comes after the government passed its Brexit bill last week. Relations between the EU and Britain have soured since the Brexit vote in June, and negotiations promise to be arduous and possibly acrimonious between the parties. The pound has dipped lower on the Brexit announcement.
With the Fed's quarter-rate point behind us, what's next for Janet Yellen & Co.? The CME Group has priced a rate hike in May at just 6%, while a June move is priced at 54%. With a dearth of key fundamentals in the US this week, the markets are left to monitoring comments from FOMC members who will be speaking this week, including Fed Chair Janet Yellen on Thursday. On Monday, Chicago Fed President Charles Evans said he expects the Fed to raise rates two more times this year. This echoes the Fed's projection in its rate statement. Although three rate hikes in 2017 would be no small feat, market players want four hikes, and have reacted with disappointment to the Fed's more cautious approach. This has sent the US dollar lower, and the pound is up 2.4% since the Fed announcement last week.
Trade Idea Wrap-up: USD/CHF – Sell at 1.0000
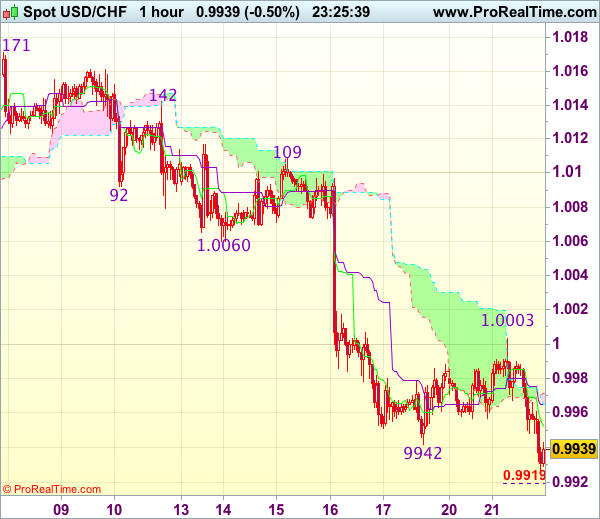
USD/CHF - 0.9940
Most recent candlesticks pattern : N/A
Trend : Near term down
Tenkan-Sen level : 0.9952
Kijun-Sen level : 0.9965
Ichimoku cloud top : 0.9971
Ichimoku cloud bottom : 0.9965
Original strategy :
Sell at 1.0000, Target: 0.9900, Stop: 1.0035
Position : -
Target : -
Stop : -
New strategy :
Sell at 1.0000, Target: 0.9900, Stop: 1.0035
Position : -
Target : -
Stop : -
As the greenback has remained under pressure, suggesting recent decline from 1.0171 is still in progress and may extend weakness to 0.9915-20 (50% projection of 1.0109-0.9942 measuring from 1.0003), however, loss of downward momentum should prevent sharp fall below 0.9900 (61.% projection) and reckon 0.9870-75 would hold from here, risk from there has increased for a rebound later.
In view of this, would not chase this fall here and would be prudent to sell dollar on recovery as 1.0000-05 should limit upside and bring another decline. Only above previous support at 1.0060 (now resistance) would abort and signal low is formed instead, risk rebound to 1.0090-95 first.
Trade Idea Wrap-up: GBP/USD – Buy at 1.2400
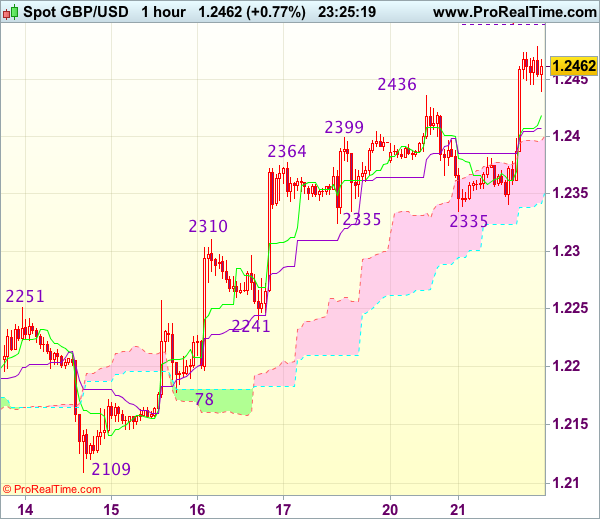
GBP/USD - 1.2465
Most recent candlesticks pattern : N/A
Trend : Near term up
Tenkan-Sen level : 1.2419
Kijun-Sen level : 1.2407
Ichimoku cloud top : 1.2397
Ichimoku cloud bottom : 1.2342
Original strategy :
Buy at 1.2400, Target: 1.2500, Stop: 1.2365
Position : -
Target : -
Stop : -
New strategy :
Buy at 1.2400, Target: 1.2500, Stop: 1.2365
Position : -
Target : -
Stop : -
As cable has surged again in London morning and broke above previous resistance at 1.2436, confirming the rise from 1.2109 has resumed and bullishness remains for further gain to previous resistance at 1.2479, then 1.2500, however, near term overbought condition should prevent sharp move beyond 1.2540-50 and price should falter below previous chart resistance at 1.2570, risk from there has increased for a retreat to take place later.
In view of this, would not chase this move from here and we are looking to buy cable on pullback as 1.2400-10 should limit downside. Below 1.2380-85 would defer and risk correction to 1.2350 but support at 1.2335 should remain intact.