
Sample Category Title
Daily Technical Analysis
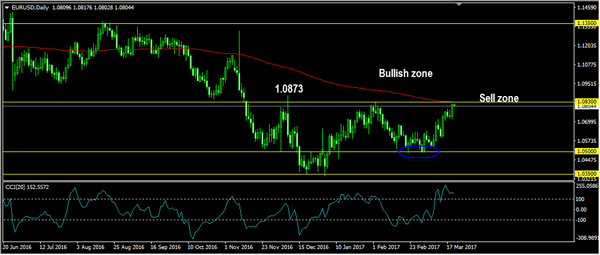
EURUSD
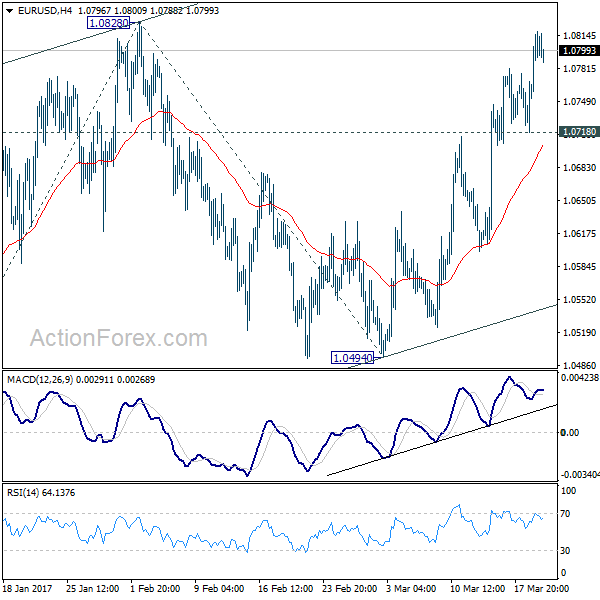
The EURUSD had a bullish momentum yesterday topped at 1.0819. The bias is bullish in nearest term testing 1.0830 – 1.0873 area which is a good place to sell with a tight stop loss. Immediate support is seen around 1.0760. A clear break below that area could lead price to neutral zone in nearest term testing 1.0700 region. On the upside, a clear break and daily close above 1.0873 would expose 1.0950 – 1.1000 area and activate my bullish mode.
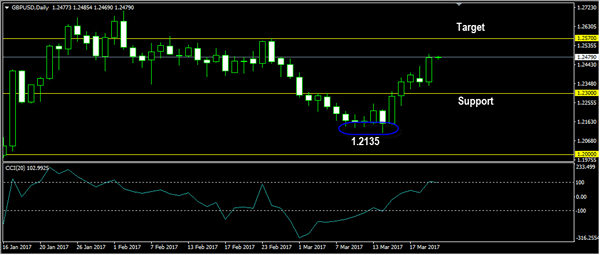
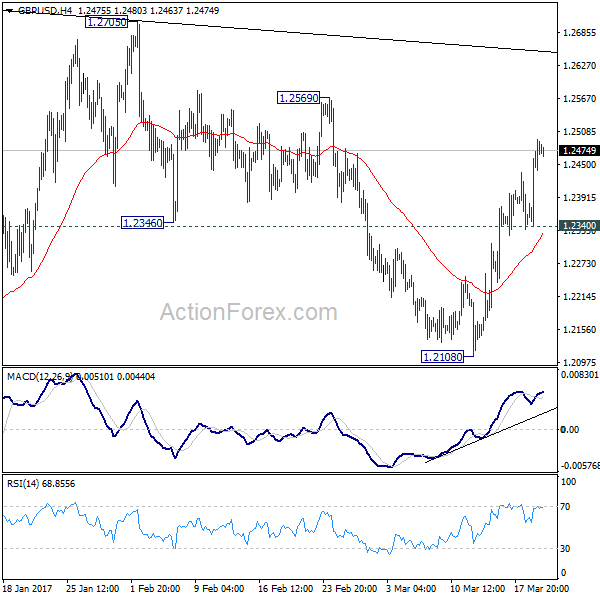
GBPUSD
The GBPUSD had a bullish momentum yesterday topped at 1.2494. The bias is bullish in nearest term testing 1.2570 region as a part of the bullish scenario after bounced from the triple bottom formation at 1.2135/08 as you can see on my daily chart below. Immediate support is seen around 1.2440. A clear break below that area could lead price to neutral zone in nearest term testing 1.2390 region but as long as stay above 1.2300 I prefer a bullish scenario at this phase and any downside pullback should be seen as a good opportunity to buy. Overall I remain neutral.
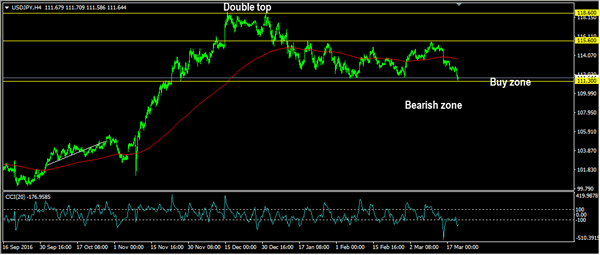
USDJPY
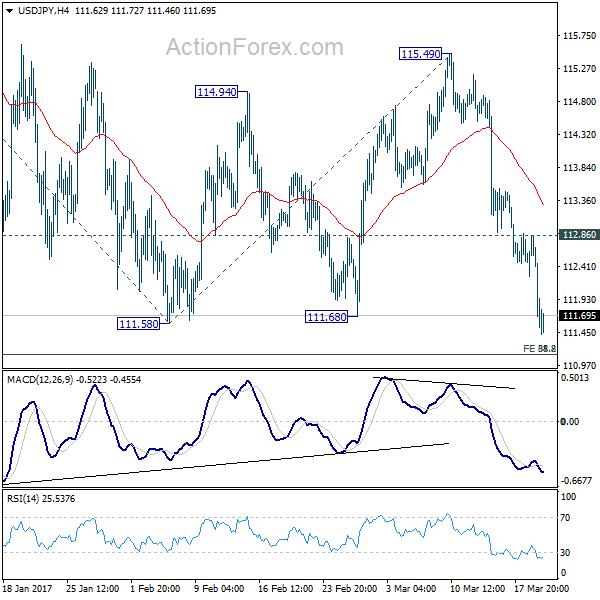
The USDJPY had a bearish momentum yesterday bottomed at 111.51 and hit 111.42 earlier today in Asia session. The bias remains bearish in nearest term but note that 111.50/30 region is a key support and good place to buy with a tight stop loss. Buying around that area gives us a better price and risk/reward ratio. Immediate resistance is seen around 112.30/50. A clear break above that area could lead price to neutral zone in nearest term testing 113.00 area or higher. On the downside, a clear break and daily close below 111.30 would reactivate my bearish mode as a part of the double top bearish scenario (118.60) as you can see on my H4 chart below.
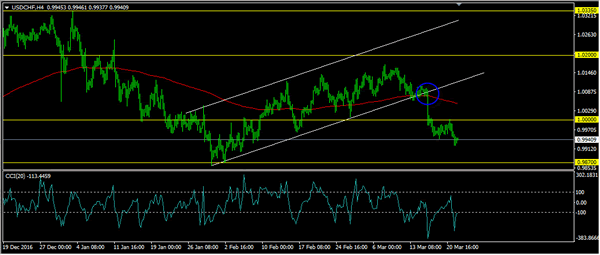
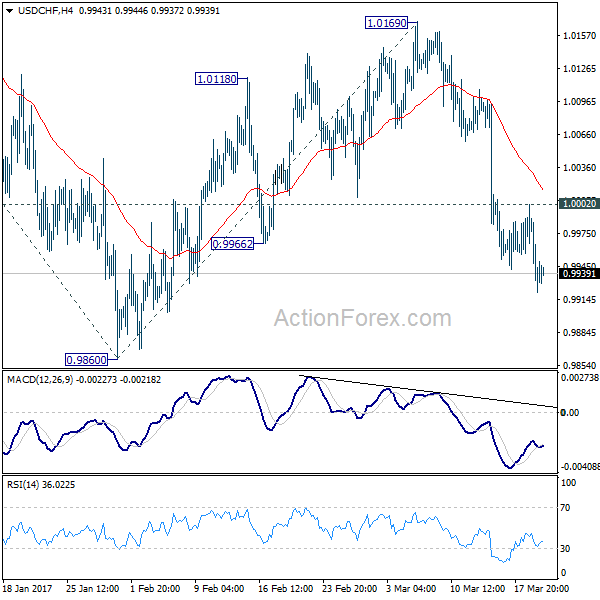
USDCHF
The USDCHF had a bearish momentum yesterday bottomed at 0.9921. The bias remains bearish in nearest term testing 0.9870 as a part of the bearish scenario after broke below the bullish channel as you can see on my H4 chart below. Immediate resistance remains around 1.0000. A clear break above that area could lead price to neutral zone in nearest term testing 1.0050 area. Overall I remain neutral.
USD/JPY Daily Outlook
Daily Pivots: (S1) 111.21; (P) 112.03; (R1) 112.54; More...
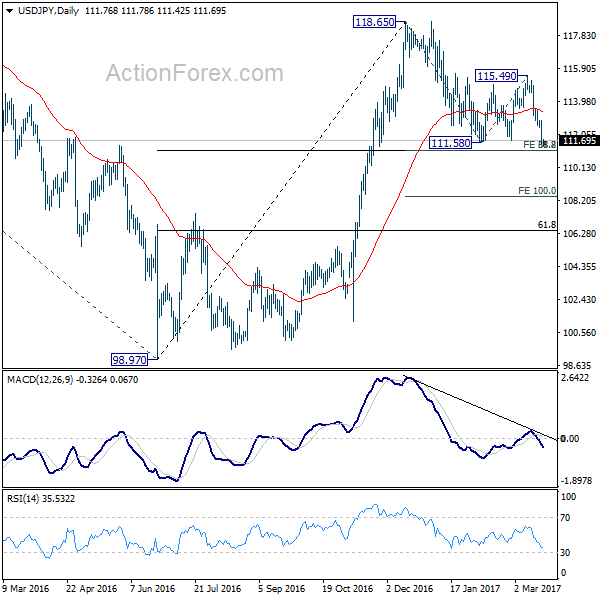
USD/JPY's fall from 118.65 resumed by taking out 111.58 and reaches as low as 111.42 so far. Intraday bias stays on the downside for the moment. At this point, we're still favor to see strong support from 111.12/13 cluster support to contain downside. This level represents 61.8% projection of 118.65 to 111.58 from 115.49 at 111.12 and 38.2% retracement of 98.97 to 118.65 at 111.13. On the upside, break of 112.86 will turn bias back to the upside for 115.49 resistance first. However, sustained break of 111.12/13 will bring deeper decline to 100% projection of 118.65 to 111.58 from 115.49 at 108.42.
In the bigger picture, price actions from 125.85 high are seen as a corrective pattern. The impulsive structure of the rise from 98.97 suggests that the correction is completed and larger up trend is resuming. Decisive break of 125.85 will confirm and target 61.8% projection of 75.56 to 125.85 from 98.97 at 130.04 and then 135.20 long term resistance. Nonetheless, sustained trading below 55 week EMA (now at 111.19) will extend the consolidation from 125.85 with another fall through 98.97 before completion.
EUR/USD Daily Outlook
Daily Pivots: (S1) 1.0716; (P) 1.0747 (R1) 1.0769; More.....
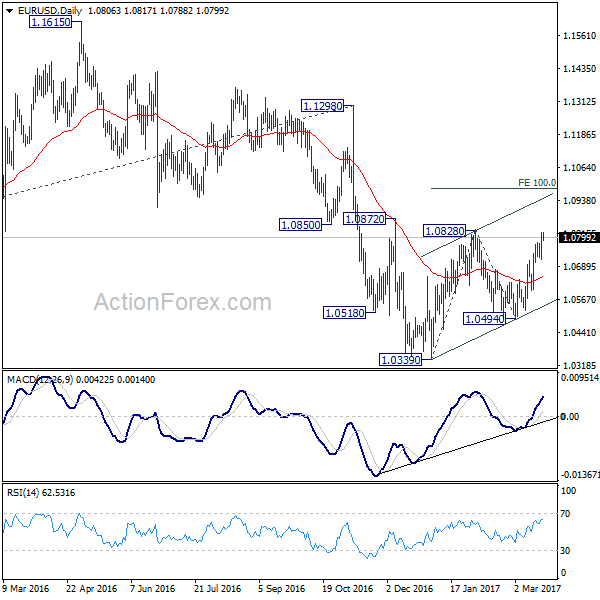
Intraday bias in EUR/USD remains on the upside as rise from 1.0494 continues. Break of 1.0828 will target 100% projection of 1.0339 to 1.0828 from 1.0494 at 1.0983. However, as rise from 1.0339 is seen as a corrective move. We'd expect upside to be limited by 1.0983 to complete the correction. On the downside, break of 1.0718 minor support will turn bias to the downside for 1.0494 support first.
In the bigger picture, as long as 1.1298 key resistance holds, whole down trend from 1.6039 (2008 high) is still expected to resume later. Break of 1.0339 low will send EUR/USD through parity to 61.8% projection of 1.3993 to 1.0461 from 1.1298 at 0.9115.
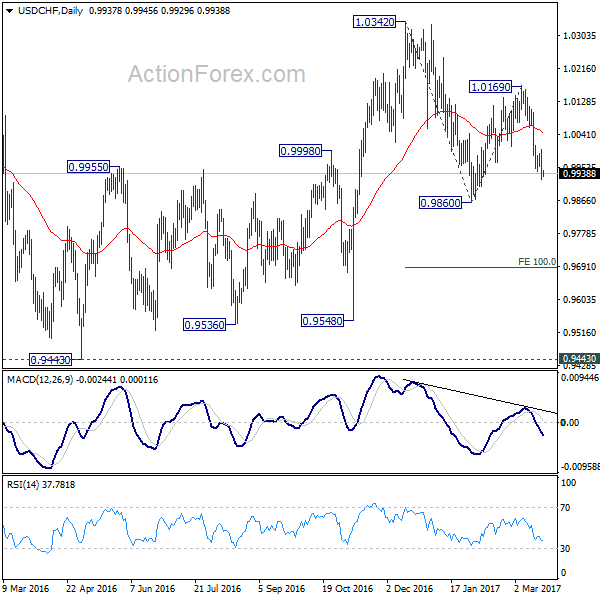
USD/CHF Daily Outlook
Daily Pivots: (S1) 0.9905; (P) 0.9953; (R1) 0.9985; More.....
USD/CHF's fall from 1.0169 is still in progress and intraday bias remains on the downside. The pair should now target 0.9860 support next. Whole decline from 1.0342 is likely resuming and break of 0.9860 will target 100% projection of 1.0342 to 0.9860 from 1.0169 at 0.9687. Nonetheless, on the upside, break of 1.0002 minor resistance will turn bias back to the upside for 1.0169 resistance instead.
In the bigger picture, USD/CHF is staying in medium term sideway pattern between 0.9443/1.0342. In any case, decisive break of 1.0342 resistance is needed to confirm underlying strength. Otherwise, we'll stay neutral in the pair first. In case of another fall, we'd expect strong support from 0.9443/9548 support zone.
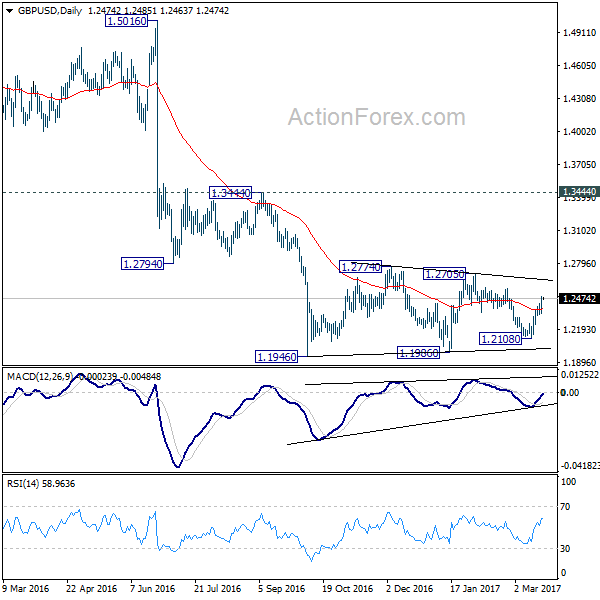
GBP/USD Daily Outlook
Daily Pivots: (S1) 1.2381; (P) 1.2437; (R1) 1.2535; More...
Intraday bias in GBP/USD remains on the upside as rise from 1.2108 continues. Their pair would target 1.2569 resistance first and break will target 1.2705/74 resistance zone. But still, price actions from 1.1946 are seen as a consolidation pattern. Hence, we'd expect strong resistance from 1.2705/2774 to limit upside and bring down trend resumption. On the downside, break of 1.2340 support will turn bias back to the downside for 1.2108 support. Though, sustained break of 1.2774 will extend the rise towards 1.3444 key resistance level.
In the bigger picture, fall from 1.7190 is seen as part of the down trend from 2.1161. There is no sign of medium term bottoming yet. Sustained trading below 61.8% projection of 2.1161 to 1.3503 from 1.7190 at 1.2457 will target 100% projection at 0.9532. Overall, break of 1.3444 resistance is needed to confirm medium term bottoming. Otherwise, outlook will remain bearish.
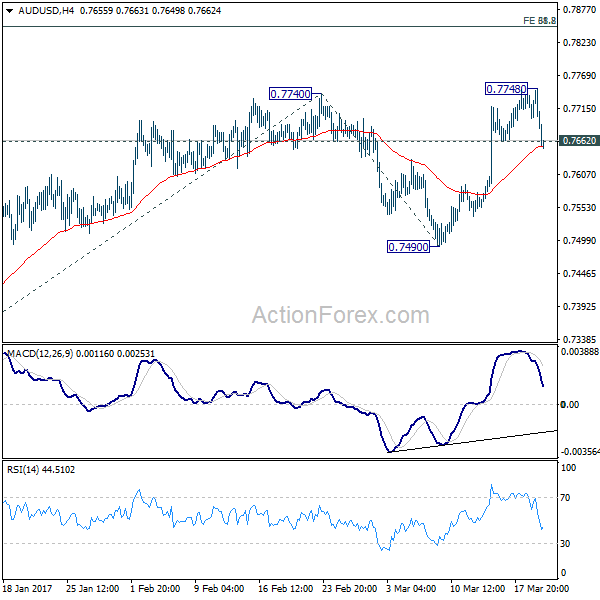
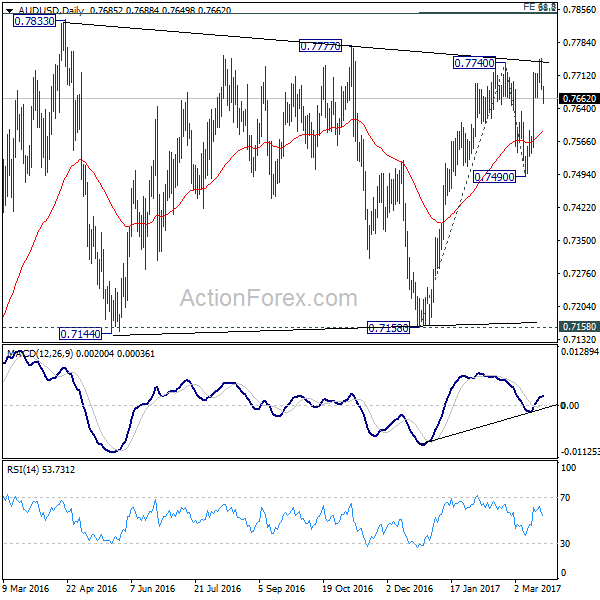
AUD/USD Daily Outlook
Daily Pivots: (S1) 0.7666; (P) 0.7707; (R1) 0.7733; More...
AUD/USD's sharp decline and break of 0.7662 minor support argues that rebound from 0.7490 might be completed. Intraday bias is back to the downside for retesting 0.7490 support first. Break will confirm completion of whole rise from 0.7158. Above 0.7748 will resume such rally. But at this point, we'd expect upside to be limited by 0.7849/50 cluster resistance to limit upside and bring reversal. That level represents 61.8% projection of 0.7158 to 0.7740 from 0.7490 at 0.7850 and key long term retracement level at 0.7849.
In the bigger picture, we're still treating price actions from 0.6826 low as a correction. And, as long as 38.2% retracement of 0.9504 to 0.6826 at 0.7849 holds, long term down trend from 1.1079 is expected to resume sooner or later. Break of 0.6826 low will target 0.6008 key support level. However, firm break of 0.7849 will indicate that rise from 0.6826 is developing into a medium term rebound, rather than a sideway pattern. In such case, stronger rise should be seek to 55 month EMA (now at 0.8169) and above.
Mixed Technical Forecast For The EURGBP Amid Brexit Fears
Key Points:
- ABC wave could spell near-term losses and medium-term gains for the pair.
- The long-term trend line should see the EURGBP back at 0.8879.
- Brexit negotiations will play a key role in the pair's future.
In light of the escalating political tension between the EU and the UK, it may be worth taking a look at the EURGBP's technical forecast in order to get a better feel of what could be next for the pair. Furthermore, we may need to take a look at what is due out on the economic data front in order to avoid being caught out by any rouge releases.
First and foremost, the medium-term outlook for the EURGBP looks to be moderately bullish, even if we are expecting some additional near-term downsides. Specifically, it currently looks as though we are mid-way through a corrective ABC pattern in the wake of the rather torrid downtrend which started late last year. As a result, we should see losses extend to the 0.8585 mark over the coming sessions before buying pressure returns to push the pair up to the 0.8879 level.
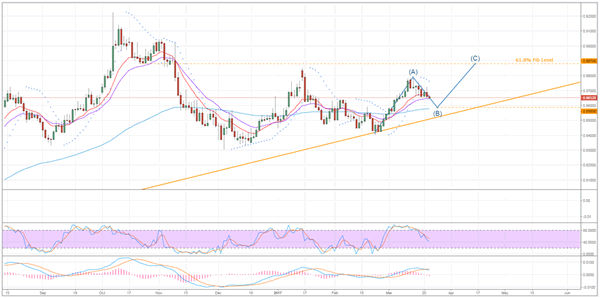
The argument for a near-term slip is supported by a number of technical instruments including, but not limited to, the Parabolic SAR and the MACD oscillator. More precisely, the Parabolic SAR retains its bearish bias whilst the recent signal line crossover on the MACD oscillator is suggestive of further downside risk. Moreover, it is expected that the turning point around the 0.8585 level eventuates as this coincides with the 100 day moving average which should provide dynamic support. Although, depending on fundamentals, the pair could test the long-term ascending trend line before reversing.
Once we have seen the EURGBP end its decline, the ensuing rally could lead to some sizable gains for the recently embattled pair. Such a rally is forecasted not only as a result of the ABC wave but also due to the EMA bias and the long-term ascending trend line, shown above. However, as is also made clear in the above chart, the uptrend will run into trouble around the 0.8879 mark. Largely, we expect to see resistance hold here due to the presence of the 61.8% Fibonacci level and some rather robust historical resistance.
From a fundamental perspective, the main risk events for the EURGBP in the week ahead will come from the UK data. Notably, the bevy of retail sales figures due out could spark some solid buying and selling pressure which could either help or hinder the technical forecast. However, on the less tangible or measurable news front, anything to do with Brexit is also likely to be weighing on one or both sides of this pair. Furthermore, the seemingly escalating tension between the EU and the UK, specifically regarding the tug of war over London's financial industry, could impact the EURGBP substantially so keep an eye out for any developments in the saga.
Ultimately, the bias remains near-term bearish and medium-term bullish for this pair regardless of fundamental interference. Notably, the combination of a number of technical readings and the influence of the long-term trend line seem to be in agreement with this assessment. As a result, expect to see the bears run low on momentum as they approach the terminus of the B leg and keep an eye out for the eventual return of the bulls currently in the wings
UK Inflation Figures Stoke Speculation Of Rate Hikes
Key Points:
- U.K. consumer price index exceeds forecasts and rises to 2.3% y/y.
- Economists are predicting a 3.0% y/y gain in inflation in near term.
- Bank of England may act to raise rates during their MPC meeting in May.
The latest round of U.K. CPI figures have proved a surprise to the market as rising food and energy prices have pushed the key inflation metric to 2.3% y/y. The result far exceeds the expected 2.1% gain and now places the metric well above the 2.00% range desired by the Bank of England (BoE). The result is the strongest seen in many years and now places increasing the pressure on the BoE to act on interest rates in the medium term.
The immediate response from the release of the inflation data was a sharp rise in the value of the Pound against most of the cross pairs. The Cable rose to a high of 1.2475, breaking through the 100EMA, which suggests that we could see prices creeping back above the key 1.25 handle in the near term. Much of the bullish activity is due to rising speculation that the Bank of England is going to have to raise rates to fight of the growing inflationary pressures in the short run.
However, the one metric that is still lagging behind is wage growth as the latest figures show stagnation in this regard. In fact, despite unemployment falling to its lowest levels in over 30 years, wage gains have slowed and real pay rates have started to slip. Subsequently, inflationary pressures and the requisite cycle of interest rate rises are likely to be unwelcome news to the vast majority of Britons.
Regardless, the reality is that the central bank will view the latest CPI result as a stark warning of the building inflationary pressures within the economy. Although the historically low Pound has certainly had an impact on import prices and purchasing parity it has largely been the global rise in crude oil prices that has led to the recent rises in both food and the CPI. Subsequently, many professional economists are now forecasting inflation to rise to 3% within the U.K. over the coming months. This is something that will be relatively unpalatable to the central bank and could spur action sooner, rather than later.
Ultimately, given the historically low official bank rate, the BoE was always going to have to act to counteract inflation eventually. Unfortunately, the decisive moment has arrived and the central bank is likely taking notice of the rising pressures. The monetary policy committee is not due to meet again until the middle of May but the meeting is set to be a ‘live’ event and there is a very real risk of a 25bps hike to rates, especially if the CPI figures keep rising in the near term.
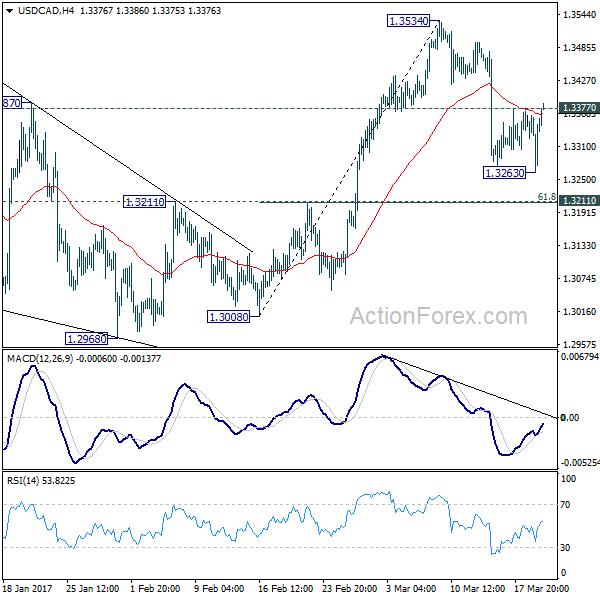
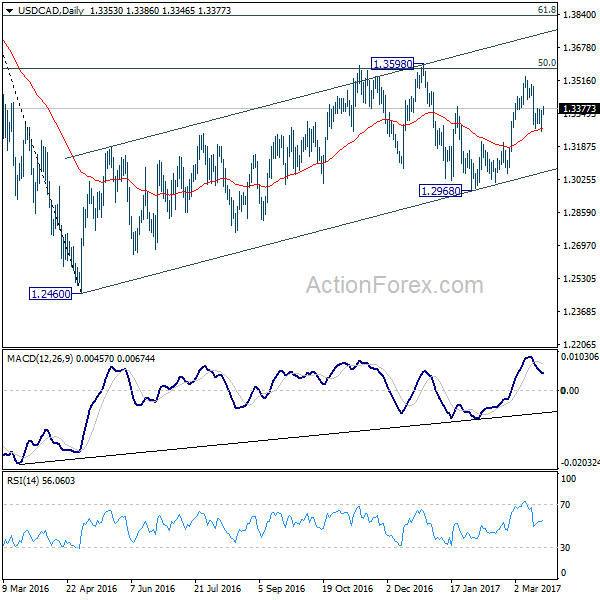
USD/CAD Daily Outlook
Daily Pivots: (S1) 1.3289; (P) 1.3327; (R1) 1.3390; More....
In the bigger picture, price actions from 1.4689 medium term top are seen as a correction pattern. The first leg has completed at 1.2460. The second leg is likely still in progress and could target 61.8% retracement of 1.4689 to 1.2460 at 1.3838. We'd look for reversal signal there to start the third leg. Break of 1.2968 wold at least bring at retest of 1.2460 low. However, sustained trading above 1.3838 would pave the way to retest 1.4689 high.
US Stocks Suffered Largest Drop this Year, Yen Surges on Risk Aversion
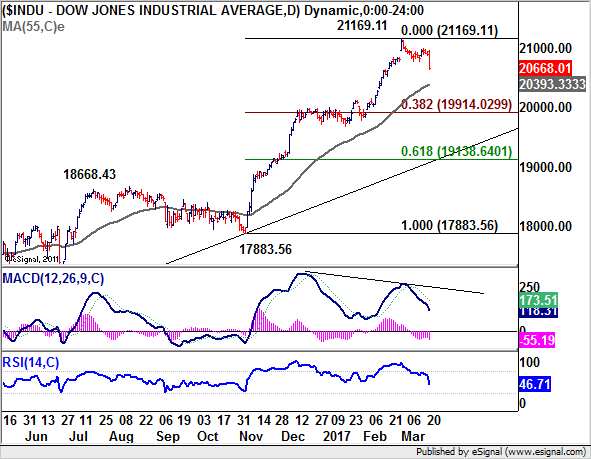
US equities suffered the steepest decline for the year overnight. Doubts over US president Donald Trump's ability to push through his policies are seen as the major factor driving stocks down. In particular, some economists pointed out that there is simply not enough money in the government to allow for a tax cut, nor the fiscal stimulus programs. DJIA dropped -237.85 pts, or -1.14% to close at 20668.01. S&P 500 lost -29.45 pts or -1.25% to close at 2344.02. Financials led the way, dropping more than -2.5%. Treasury yield also suffered with 10 year yield extending the near term fall from 2.615 to close at 2.436, down -0.037. Dollar index broke 100 handle to as low as 99.66. In the currency market, risk aversion boosted Yen to be the strongest major currency for the week. Commodity currencies are the weakest with Aussie leading the way down. Sterling and Euro are relatively resilient.
DJIA: Correction from 21169.11 medium term to extend
The sharp selloff in DJIA suggests that 21169.11 is a medium term top. This is supported by bearish divergence condition in daily MACD. The correction from there would now likely extend to 55 day EMA (now at 20393.33) and below. At this point, we'd expect support from 38.2% retracement from 17883.56 to 21169.11 at 19914.03 to contain downside and bring rebound. Based on current outlook, there is little chance for up trend resumption in near term. And correction/consolidation from 21169.11 should extend for a while.
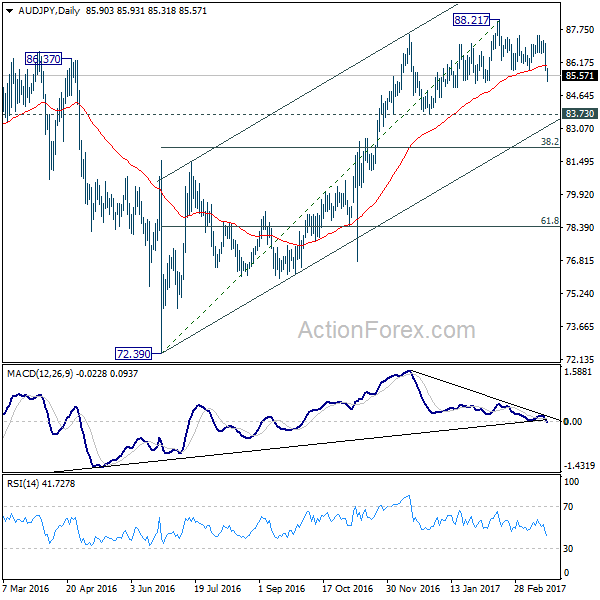
AUD/JPY: heading to 83.73 support
AUD/JPY is now trading as the biggest mover for the week. The break of 85.84 support confirms resumption of the fall from 88.21. Considering bearish divergence condition in daily MACD, 88.21 is seen as a medium term top. AUD/JPY show now head lower to 83.73 support, or possibly to medium term channel (now at 83.09). From a medium term point of view, we'd expect strong support from 38.2% retracement of 72.39 to 88.21 at 82.16 to contain downside.
BoJ members rejected lifting bond yield targets
The minutes of BoJ January 30/31 showed that "a few members" believed that CPI "would not reach around 2 percent during the projection period". And, "many members" believed "there was still a long way to go" to achieve that target. Some members acknowledged market speculations that BoJ would raise target level of long term interest rate in response to US rate hikes. But they rejected that and emphasized "monetary policy decisions should be made solely based on the viewpoint of aiming to achieve the 2 percent price stability target." After that meeting, BoJ lifted GDP forecast for 2017 fiscal year from 1.3% to 1.5%. Inflation forecast for the same period was kept unchanged at 1.5%.
Released from Japan today, trade surplus widened to JPY 0.68T in February, above expectation of 0.55T. Exports jumped 11.3% yoy, fastest since January 2015. Exports to China jumped 28.2% yoy, accelerated from 3.1% yoy in the prior month. Some analysts noted that even stripping out the Lunar New Year effects, exports still picked up as a trend.
Elsewhere...
Australia Westpac leading index dropped -0.1% mom in February. Eurozone will release current account in European session. US will release house price index and existing home sales.
USD/CAD Daily Outlook
Daily Pivots: (S1) 1.3289; (P) 1.3327; (R1) 1.3390; More....
USD/CAD dipped to 1.3263 but quickly recovered. The breach of 1.3377 minor resistance argues that the corrective fall from 1.3534 has completed already. Intraday bias is turned back to the upside for retesting 1.3534 high. Break there will target 1.3598 high. On the downside, in case of another fall, we'd expect strong support from 1.3211 cluster level (61.8% retracement of 1.3008 to 1.3534 at 1.3209) to contain downside and bring rebound. Overall, we're still expecting the medium term rise from 1.2460 to resume later.
In the bigger picture, price actions from 1.4689 medium term top are seen as a correction pattern. The first leg has completed at 1.2460. The second leg is likely still in progress and could target 61.8% retracement of 1.4689 to 1.2460 at 1.3838. We'd look for reversal signal there to start the third leg. Break of 1.2968 wold at least bring at retest of 1.2460 low. However, sustained trading above 1.3838 would pave the way to retest 1.4689 high.
Economic Indicators Update
| GMT | Ccy | Events | Actual | Forecast | Previous | Revised |
|---|---|---|---|---|---|---|
| 23:30 | AUD | Westpac Leading Index M/M Feb | -0.10% | 0.00% | ||
| 23:50 | JPY | BOJ Minutes (Jan 30-31) | ||||
| 23:50 | JPY | Trade Balance (JPY) Feb | 0.68T | 0.55T | 0.16T | 0.20T |
| 4:30 | JPY | All Industry Activity Index M/M Jan | 0.00% | -0.30% | ||
| 9:00 | EUR | Eurozone Current Account (EUR) Jan | 29.3B | 31.0B | ||
| 13:00 | USD | House Price Index M/M Jan | 0.40% | 0.40% | ||
| 14:00 | USD | Existing Home Sales Feb | 5.59M | 5.69M | ||
| 14:30 | USD | Crude Oil Inventories | -0.2M | |||
| 20:00 | NZD | RBNZ Rate Decision | 1.75% | 1.75% |