Sample Category Title
Gold Remains Quiet Ahead of Fed Policy Meeting
Gold continues to have a quiet week. In the North American session, the spot price for one ounce is $1204.65. On the release front, US PPI dipped to 0.3%, above the estimate of 0.1%. We could see some movement from gold on Wednesday, as the US publishes CPI and retail sales reports. As well, the Federal Reserve is widely expected to raise the benchmark rate to 0.75 percent.
With the markets expecting a quarter-point rate hike on Wednesday, will gold react negatively to a Fed move? Although a rate hike has been priced in by the markets at 93%, there have been disappointments in the past, so a rate move could boost the dollar at the expense of gold. Strong US employment numbers in February have reinforced market speculation that the Fed will raise rates for the first time this year. Nonfarm payrolls sparkled in February, as the indicator jumped to 235 thousand, easily beating the estimate of 196 thousand. Wage growth climbed 2.6% compared to February 2016, while the participation rate edged up to 63.0%, up from 62.9%. These solid job numbers have also provided President Trump with a much-needed boost. Trump is under pressure to present an economic agenda, but the markets won't mind giving him some additional breathing room, with the economy performing so well.
West Texas Crude Slide Continues as Saudi Arabia Hikes Production
West Texas crude has dropped below $48 on Tuesday, as the slide against the dollar continues. In North American trade, WTI crude futures are trading at $47.33. Brent Crude has dropped to $50.51, as the Brent premium has widened to $3.18. On the release front, US PPI dipped to 0.3%, above the estimate of 0.1%. Wednesday will be busy, as the US publishes CPI and retail sales reports. As well, the Federal Reserve is widely expected to raise the benchmark rate to 0.75 percent.
Oil prices continue to head downwards, as West Texas crude plunged 8.7 percent last week and dipped below the $47 level earlier on Tuesday. This was in response to reports that Saudi Arabia has increased oil production above 10 million barrels a day, raising concerns about a global oil glut. WTI crude is also under strong pressure as US crude stockpile reports continue to point to surpluses. Last week, Crude Inventories soared to 8.2 million barrels, well above the forecast of 1.1 million. US crude has posted surpluses in 11 of the past 12 weeks, reflective of increasing US shale production. Most of the surpluses have been much higher than the forecasts, as the markets continue to underestimate the level of crude stockpiles. The ongoing surplus has dampened OPEC's hopes of raising prices, as the cartel cut production levels at the beginning of January. Compliance with the agreement stands at an impressive 94% and OPEC had high hopes of pushing crude to $60 or more, but oil prices continue to lose ground in 2017.
Strong US employment numbers in February have cemented a rate hike by the Federal Reserve on Wednesday. Nonfarm payrolls sparkled in February, as the indicator jumped to 235 thousand, easily beating the estimate of 196 thousand. Wage growth climbed 2.6% compared to February 2016, while the participation rate edged up to 63.0%, up from 62.9%. These numbers make it a virtual certainty that the Fed will raise rates by a quarter-point on Wednesday. Although a rate hike has been priced in by the markets at 93%, there have been disappointments in the past, so a rate move will likely give the dollar a boost against its major rivals. The solid job numbers also give President Trump a much-needed boost. Trump is under pressure to present an economic agenda, but the markets won't mind giving him some additional breathing room, with the economy performing so well.
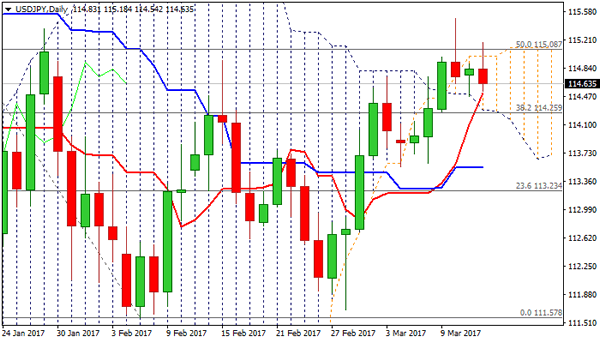
USDJPY Likely to Remain Within Daily Cloud Until FOMC
The pair fell back to 114.50 (rising daily Tenkan-sen support) after another failure above daily Ichimoku cloud top.
Today's rally stalled at 115.18, well below last Friday's spike to 115.49, signaling repeated rejection above 114.99/115.08 pivots (daily cloud top / 50% of 118.59/111.57 downleg).
Daily Tenkan-sen that tracks the rally since Feb 28, offers solid support, also guarding cloud base at 114.29.
Loss of these supports would generate stronger bearish signal.
Meantime, the pair is expected to remain in neutral mode while holding within the cloud, ahead of tomorrow's FOMC meeting.
As market participants are convinced that Fed will hike rates tomorrow, focus is turning on Yellen's comments and grade of hawkishness regarding next increase of interest rates.
Bullish scenario requires final close above 115.00 resistance zone to generate positive signal for fresh acceleration higher that may extend towards 115.91 barrier ( Fibo 61.8% of 118.59/111.57 descend).
Res: 114.99; 115.18; 115.49; 115.91
Sup: 114.51; 114.29; 114.00; 113.53
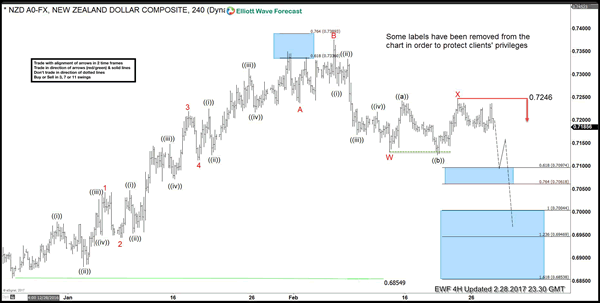
NZDUSD: Elliott Wave Forecasting the Decline
Hello fellow traders. In this technical blog we're going to take a quick look at the past Elliott Wave charts of NZDUSD. We're going to explain the structure and see how we guided our members through this instrument.
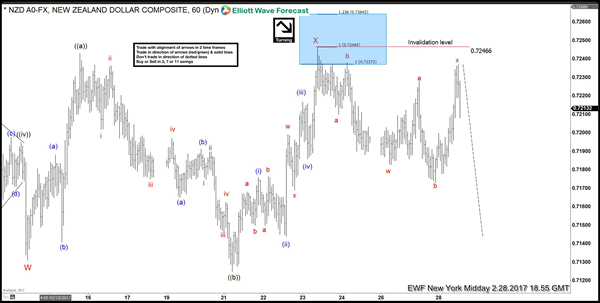
The chart below is $NZDUSD 4 hour chart from 02.28.2017. Our analysis suggests the price is correcting the cycle from the 0.6854 low. First leg W red has ended on 02/14 as expanded flat. On 02/21 date we got lower low: wave ((b)), and we got bearish sequences from the peak. In a mean time short term structure got little bit tricky. X red connector turned into irregular Flat correction. Our Elliott Wave analysis suggests X red is done at 0.7246 high. Consequently, the pair is ideally within Y red leg, looking for more downside, targeting 0.70044-0.69469 area.
NZDUSD 4 Hour Chart: 28 February
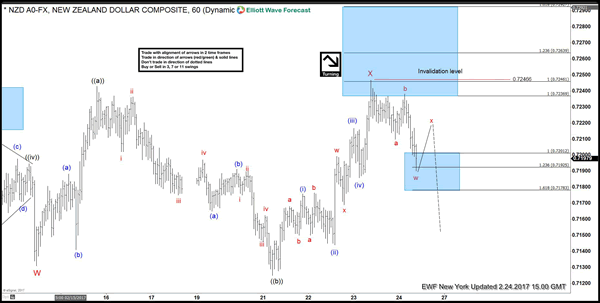
Now let's take a look at the short term structures:
NZDUSD 1 Hour Chart: 24 February
X red is done at 0.7246 high and as far as the price holds below that level further weakness should ideally follow. Current 0.71925-0.71783 area can provide 3 wave bounce before decline resumes.
NZDUSD 1 Hour Chart: 28 February
Short term price x red correction has turned into irregular flat against the 0.72466 peak. So far, the mentioned peak has held nicely and we're forecasting further decline within Y red leg toward 4 Hour target at 0.70044-0.69469
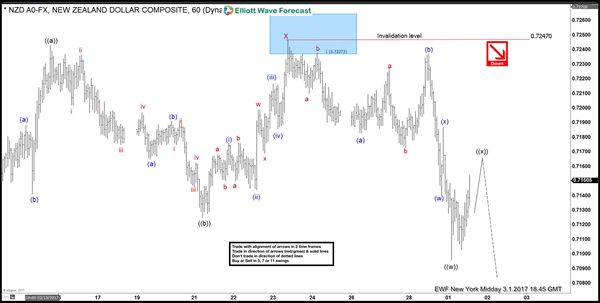
NZDUSD 1 Hour Chart: 1 March
We got nice decline and separation from the peak. As the pair has made new short term low we got more clue in proposed bearish view and we're recommending selling the rallies in 3,7,11 swings to our members. Currently price is showing clear 3 swings from the low suggesting that potential sell area comes at 0.7154-0.7184 .
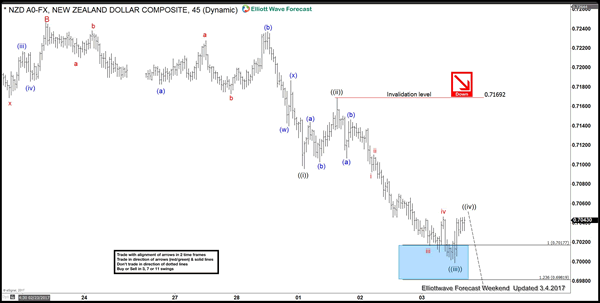
NZDUSD 1 Hour Chart: 4 March
The pair found sellers at 0.7154-0.7184 and short term correction ended at 0.71692. We got nice decline as expected. Although the price reached 4 hour target at 0.7004 , due to a market correalation and incomplete pull backs in the rest of commoditiy instruments we switch short term count little bit and calling for 5 wave structure in the cycle from the 0.7247 peak, where ((ii)) ended at 0.71692. Currently about to complete short term ((iv)) bounce , looking for further extension lower. Next technical area comes roughly at 1.236 fib extension :0.6946. (According to 4 hour chart we presented above)
GBP/USD – Pound Slips to 8-Week Low on Concern over Brexit Launch
GBP/USD has posted losses in the Tuesday session. In North American trade, the pair is trading at 1.2130. On the release front, US PPI dipped to 0.3%, above the estimate of 0.1%. Later in the day, UK releases the CB Leading Index. Traders should be prepared for volatility, with a host of key indicators on both sides of the pond. The UK will release three employment indicators - Average Earnings Index, Claimant Count Change and the unemployment rate. The US will publish CPI and retail sales reports. As well, the Federal Reserve is widely expected to raise the benchmark rate to 0.75 percent.
The political machinations over Brexit have continued this week. On Monday, the House of Lords backed down and voted through the Brexit bill without making any changes. This move means the bill will be passed into law, allowing Theresa May's government to trigger Article 50 and formally declare Britain's intent to leave the European Union. There had been speculation that May might invoke Article 50 on Tuesday, but the government said it will not do so until later in March. Under Article 50, the negotiations are slated to take up to two years. Relations between Britain and the EU have nosedived since the stunning Brexit vote in June. The timing of invoking Article 50 comes at a particularly delicate time for Europe, as the Netherlands holds elections on Wednesday and France goes to the polls in April.
Strong US employment numbers in February have cemented a rate hike by the Federal Reserve on Wednesday. Nonfarm payrolls sparkled in February, as the indicator jumped to 235 thousand, easily beating the estimate of 196 thousand. Wage growth climbed 2.6% compared to February 2016, while the participation rate edged up to 63.0%, up from 62.9%. These numbers make it a virtual certainty that the Fed will raise rates by a quarter-point on Wednesday. Although a rate hike has been priced in by the markets at 93%, there have been disappointments in the past, so a rate move will likely give the dollar a boost against its major rivals. The solid job numbers also give President Trump a much-needed boost. Trump is under pressure to present an economic agenda, but the markets won't mind giving him some additional breathing room, with the economy performing so well.
Trade Idea Wrap-up: USD/CHF – Stand aside
USD/CHF - 1.0085
Most recent candlesticks pattern : N/A
Trend : Sideways
Tenkan-Sen level : 1.0085
Kijun-Sen level : 1.0081
Ichimoku cloud top : 1.0113
Ichimoku cloud bottom : 1.0097
New strategy :
Stand aside
Position : -
Target : -
Stop : -
Despite yesterday’s marginal fall to 1.0060, lack of follow through selling on break of previous support at 1.0065 and current rebound suggest further consolidation above yesterday’s low would be seen and gain to 1.0110-20 cannot be ruled out, however, a break of resistance at 1.0142 is needed to signal the retreat from 1.0171 (last week’s high) has ended, bring another rise towards this level later.
On the downside, below said support at 1.0060 would signal the fall from 1.0171 top is still in progress and may bring further fall to 1.0035-40 but support at 1.0009 should remain intact, bring rebound later. As near term outlook is still mixed, would be prudent to stand aside in the meantime.

Trade Idea Wrap-up: GBP/USD – Stand aside
GBP/USD - 1.2154
Most recent candlesticks pattern : N/A
Trend : Near term down
Tenkan-Sen level : 1.2137
Kijun-Sen level : 1.2180
Ichimoku cloud top : 1.2201
Ichimoku cloud bottom : 1.2188
New strategy :
Stand aside
Position : -
Target : -
Stop : -
Cable’s intra-day selloff signals recent decline has resumed, hence downside risk remains for further fall to 1.2100, however, loss of downward momentum should prevent sharp fall below 1.2070 and reckon 1.2040-50 would hold from here, sterling may stage another rebound from there later.
In view of this, would not chase this fall here and would be prudent to stand aside in the meantime. Above the Kijun-Sen (now at 1.2180) would suggest an intra-day low is formed instead, risk rebound to 1.2215 but break there is needed to confirm and bring a stronger rebound towards resistance at 1.2251.
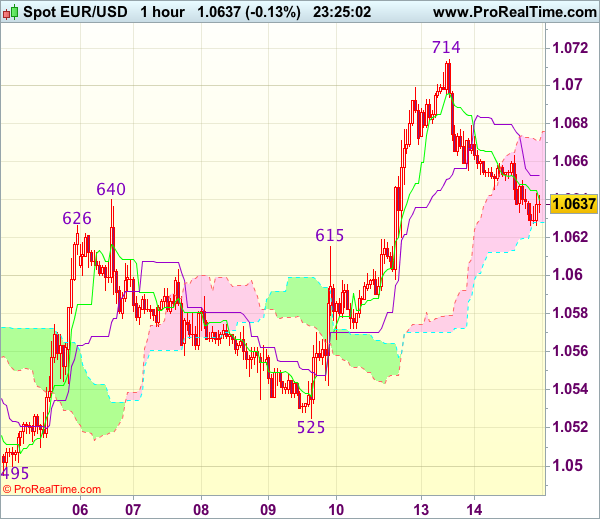
Trade Idea Wrap-up: EUR/USD – Hold long entered at 1.0640
EUR/USD - 1.0639
Most recent candlesticks pattern : N/A
Trend : Near term up
Tenkan-Sen level : 1.0652
Kijun-Sen level : 1.0677
Ichimoku cloud top : 1.0665
Ichimoku cloud bottom : 1.0613
Original strategy :
Bought at 1.0640, Target: 1.0740, Stop: 1.0610
Position : - Long at 1.0640
Target : - 1.0740
Stop : - 1.0610
New strategy :
Hold long entered at 1.0640, Target: 1.0740, Stop: 1.0610
Position : - Long at 1.0640
Target : - 1.0740
Stop : - 1.0610
Although the single currency has slipped again today and marginal weakness from here cannot be ruled out, reckon downside would be limited and as long as previous resistance at 1.0615 (now support) holds, mild upside bias remains for another rise, above 1.0680 would suggest the retreat from 1.06714 has ended, bring retest of this level, break there would extend the erratic rise from 1.0493 low to 1.0740-45 (1.5 times projection of 1.0495-1.0640 measuring from 1.0525) but loss of upward momentum should prevent sharp move beyond 1.0760 (1.618 times projection of 1.0495-1.0640 measuring from 1.0525).
In view of this, we are holding on to our long position entered at 1.0640. Below previous resistance at 1.0615 would abort and signal top has been formed, risk further fall to 1.0575-80 first.
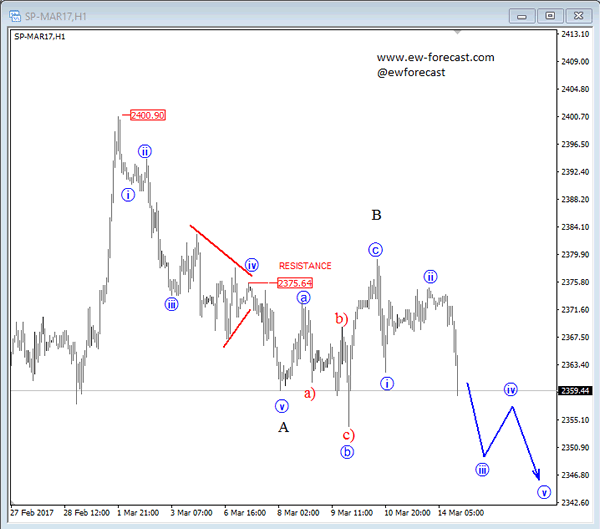
Elliott Wave Analysis: S&P500 Intraday View
On the hourly chart of S&P500, we can see that price is currently trading sharply lower within higher degree wave C as part of a three wave corrective decline. Well, if that is the case, then even more weakness may show up within the mentioned wave C. Current bearish breakdown is regarded as sub-wave iii, that may extend its gains, probably below the previous swing b-circled and to around the 2347/2350 region. Afterwards a minor correction may pop up as sub-wave iv.
S&P500, 1H
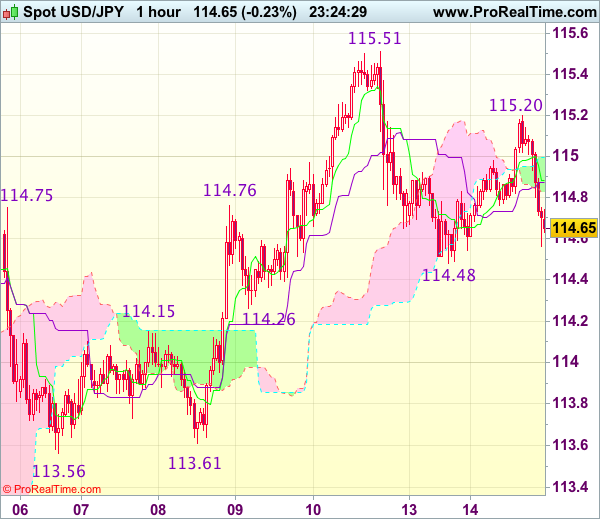
Trade Idea Wrap-up: USD/JPY – Stand aside
USD/JPY - 114.66
Most recent candlesticks pattern : N/A
Trend : Near term up
Tenkan-Sen level : 114.88
Kijun-Sen level : 114.87
Ichimoku cloud top : 115.00
Ichimoku cloud bottom : 114.88
New strategy :
Stand aside
Position : -
Target : -
Stop : -
As the greenback has retreated after meeting resistance at 115.20, retaining our view that further consolidation below last week’s high at 115.51 is in store and risk of another fall to 114.48 (yesterday’s low) cannot be ruled out, however, reckon downside would be limited to 114.26 support and as this move is viewed as retracement of recent upmove, reckon downside would be limited to 114.00-05 (38.2% Fibonacci retracement of 111.69-115.51) and price should stay well above strong support at 113.56-61), bring rebound later.
In view of this, would be prudent to stand aside for now. A firm break above 115.20 would suggest an intra-day low is formed, bring a stronger rebound but still reckon said resistance at 115.51 would cap upside. Only break there would revive bullishness and extend recent upmove to previous resistance at 115.62, then towards 115.90-00.