
Sample Category Title
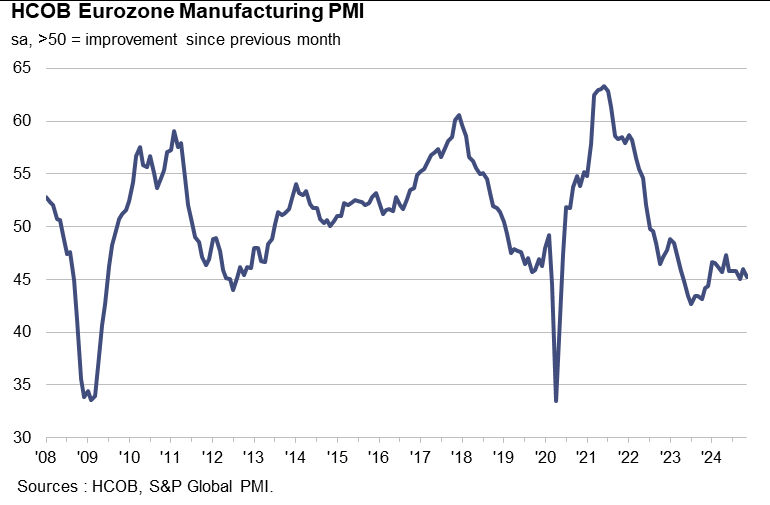
Eurozone PMI manufacturing finalized at 45.2, recession looks never going to end
Eurozone Manufacturing PMI slipped to 45.2 in November, down from October’s 46.0, reflecting deepening contraction in the sector.
The downturn remains widespread, with manufacturing activity deteriorating across major economies. Germany and France recorded PMI readings of 43.0 and 43.1 (a 10-month low), respectively, indicating severe weaknesses. Italy followed closely at 44.5, hitting a 12-month low, while the Netherlands posted a reading of 46.6, an 11-month low. Spain and Greece maintained levels above 50, but both fell to two-month lows at 53.1 and 50.9, respectively.
Cyrus de la Rubia, Chief Economist at Hamburg Commercial Bank, described the figures as "terrible," suggesting the manufacturing recession “is never going to end.”
De la Rubia forecasted a -0.7% contraction in manufacturing output for Q4, with the slump likely "going to drag into next year". The capital goods sector is bearing the brunt of the downturn, while companies continue to trim staff, signaling rising unemployment ahead.
Full Eurozone PMI manufacturing final release here.
XAG/USD Analysis: Silver Price Balances at Key Support
As reflected in the XAG/USD chart, the price of silver this morning is trading near $30.2, just above a critical support zone formed by:
→ The psychological level of $30.00;
→ The lower boundary of the ascending channel. As indicated by the blue arrows, this lower boundary has consistently provided support, enabling bullish reversals in silver prices throughout 2024.
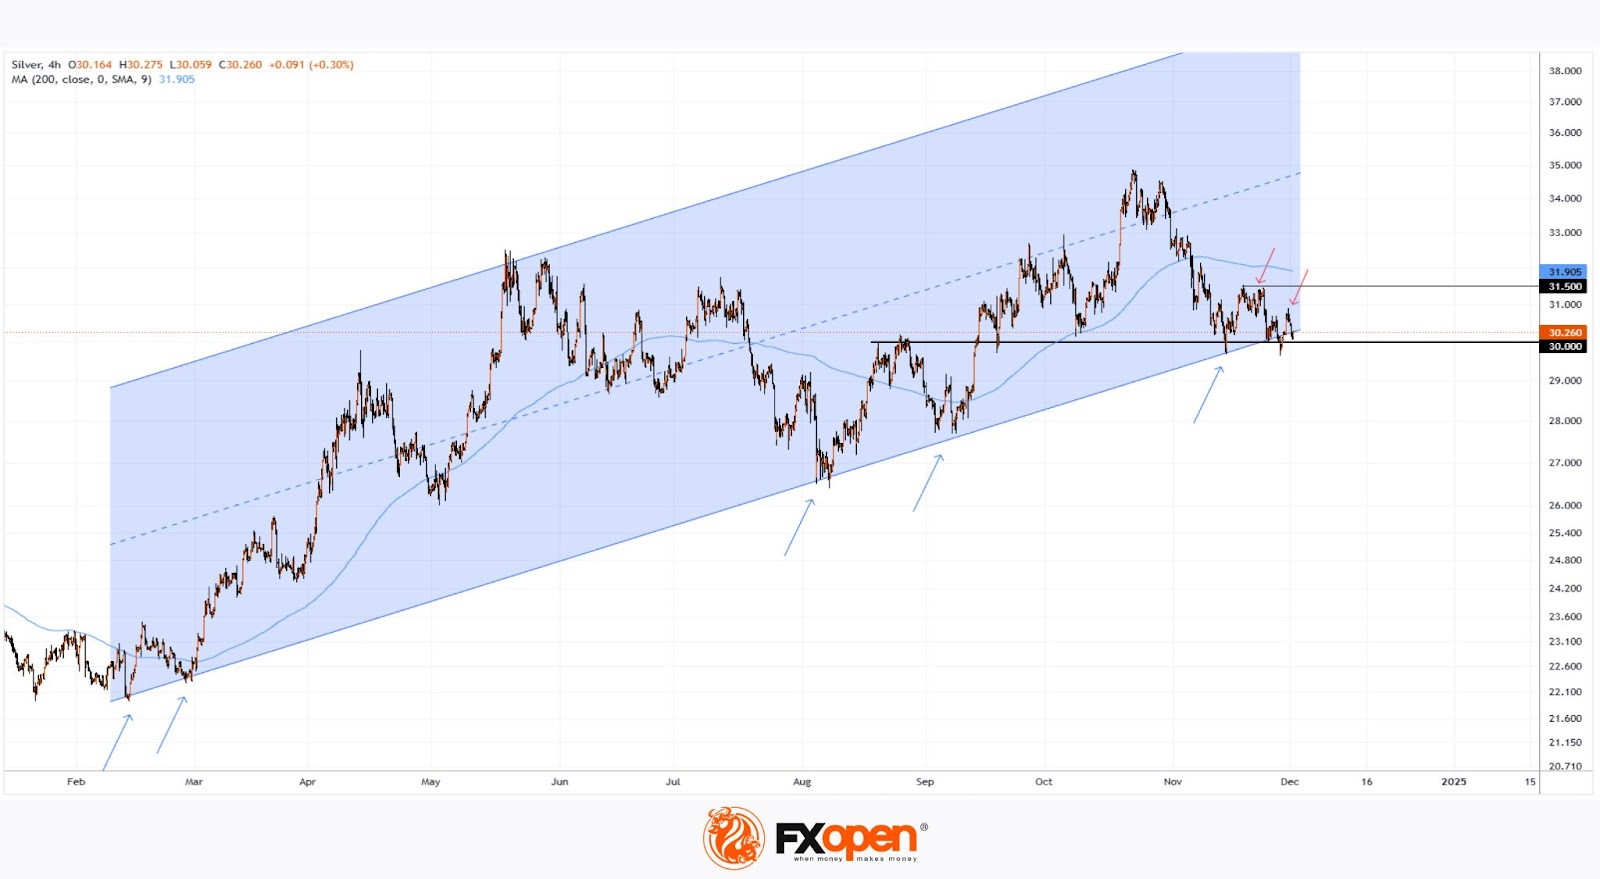
However, the price is currently below the 200-day moving average (MA), which is trending downward. An examination of price action in November reveals a lack of sustained growth following two breaches of the psychological level. As the red arrows illustrate:
→ On the first occasion, the price encountered resistance near $31.50;
→ On the second, it failed to rise above $31.
This could indicate weak demand, increasing the risk of a bearish breakout below the key support zone, potentially breaking the 2024 uptrend.
Meanwhile, analysts remain optimistic, citing strong fundamentals. According to media reports:
→ ANZ Research analysts forecast silver prices reaching $35.4 in 2025;
→ JP Morgan analysts predict silver at $36;
→ Saxo Bank analysts anticipate prices climbing to $40 by 2025.
Start trading commodity CFDs with tight spreads. Open your trading account now or learn more about trading commodity CFDs with FXOpen.
This article represents the opinion of the Companies operating under the FXOpen brand only. It is not to be construed as an offer, solicitation, or recommendation with respect to products and services provided by the Companies operating under the FXOpen brand, nor is it to be considered financial advice.
AUD/USD Stabilises Amid US Dollar Pressures and Domestic Economic Strength
On Monday, the AUD/USD pair remains stable around the 0.6450 mark. After benefiting from the US dollar's weakness during the extended US holiday weekend, the currency pair faced new pressures following remarks by US President-elect Donald Trump. Trump's threat to impose 100% trade tariffs on BRICS nations if they pursue a universal currency to replace the US dollar has sparked a renewed demand for safe-haven assets, bolstering the USD.
October's retail sales figures exceeded expectations, supporting the Australian dollar, and reinforcing the market's belief that the Reserve Bank of Australia (RBA) may not cut rates soon. RBA Governor Michele Bullock recently highlighted that core inflation remains elevated, which justifies continuing a restrictive monetary policy stance. The RBA believes it will take some time before inflation stabilises near its target.
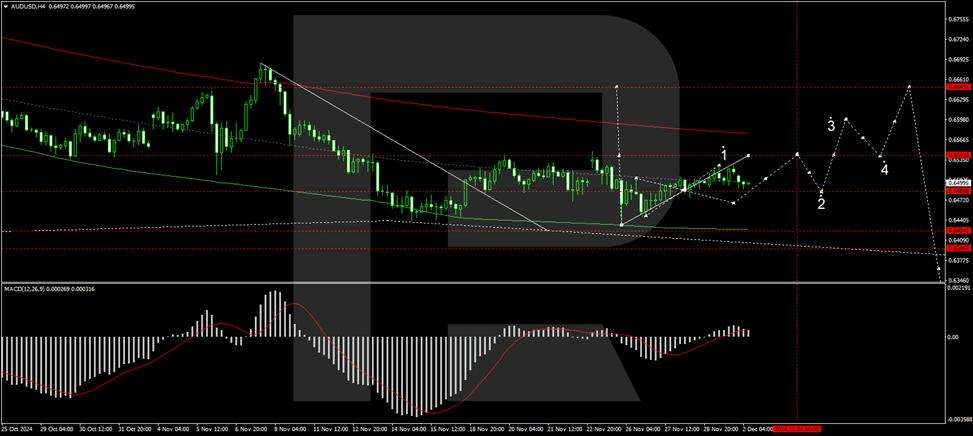
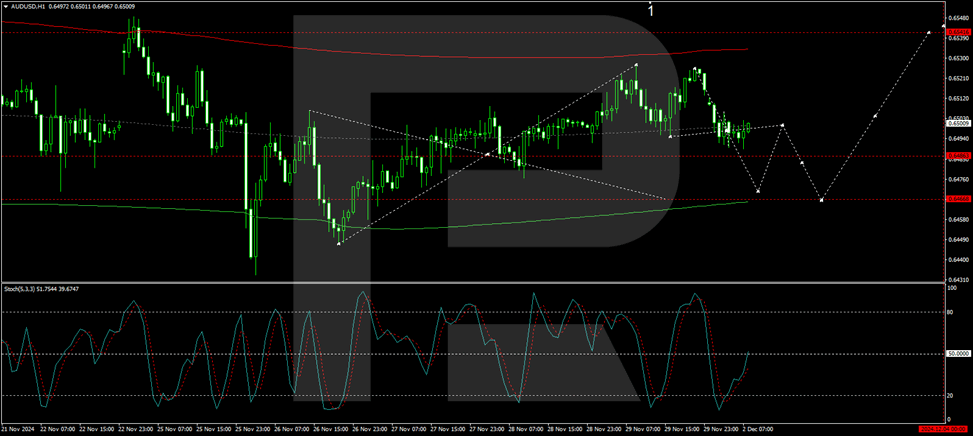
Technical analysis of AUD/USD
H4 chart: the AUD/USD is currently in the first phase of a correction wave, having achieved a local target at 0.6527. The market is now forming a decline structure towards 0.6466, and once this level is reached, a new growth phase will begin, aiming for 0.6542. This scenario is supported by the MACD indicator, which shows the signal line above zero and trending upwards, indicating potential for continued growth.
H1 chart: the pair has nearly reached the local growth target of 0.6527. A decline to 0.6470 is expected shortly, followed potentially by a rise to 0.6500 and then a drop to 0.6466. If this level is achieved, the market may prepare for another upward movement towards 0.6542. The Stochastic oscillator supports this outlook, with its signal line currently below 50 and expected to drop to 20, suggesting a forthcoming reversal and potential for growth.
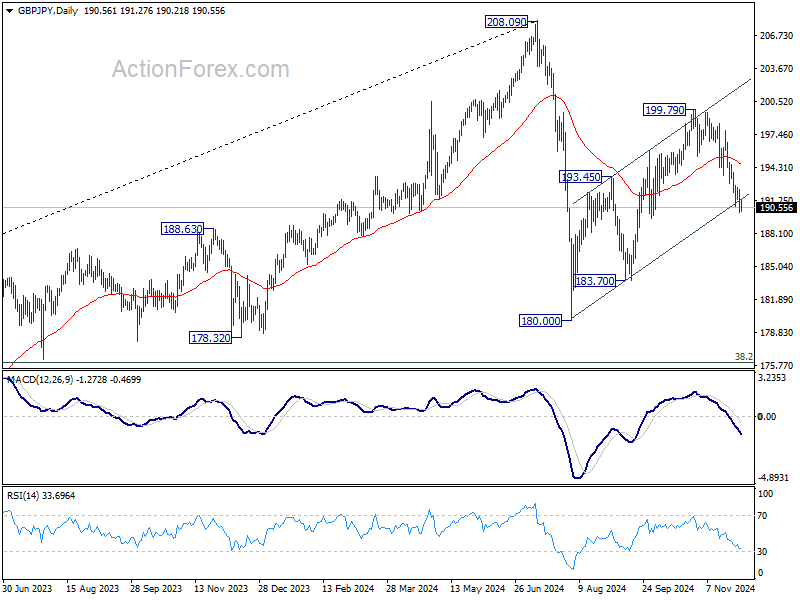
GBP/JPY Daily Outlook
Daily Pivots: (S1) 189.79; (P) 191.07; (R1) 192.00; More...
Intraday bias in GBP/JPY remains on the downside at this point. Fall from 199.79 should target 183.70 support. Break there will bring retest of 180.00 low. On the downside, above 192.45 minor resistance will turn intraday bias neutral first. But risk will now stay on the downside as long as 55 D EMA (now at 194.73) holds, in case of recovery.
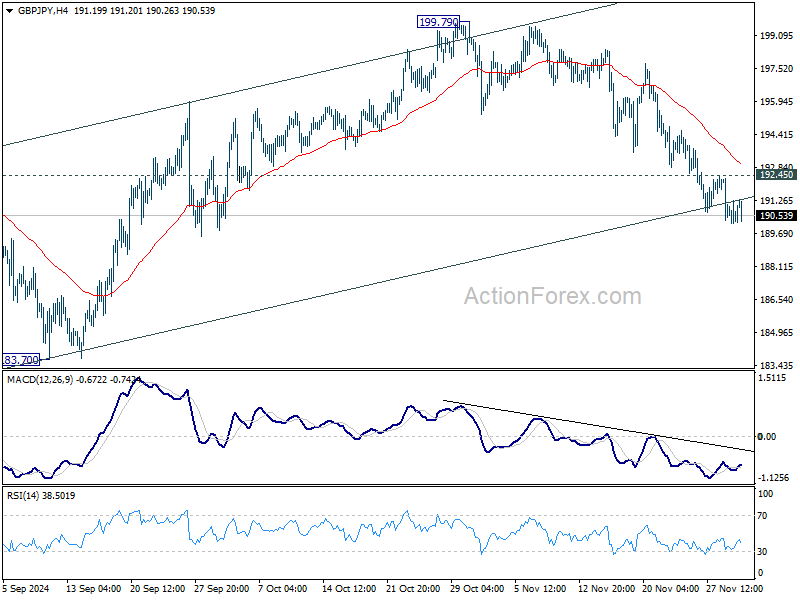
In the bigger picture, price actions from 208.09 are seen as a correction to whole rally from 123.94 (2020 low). The range of consolidation should be set between 38.2% retracement of 123.94 to 208.09 at 175.94 and 208.09. However, decisive break of 175.94 will argue that deeper correction is underway.
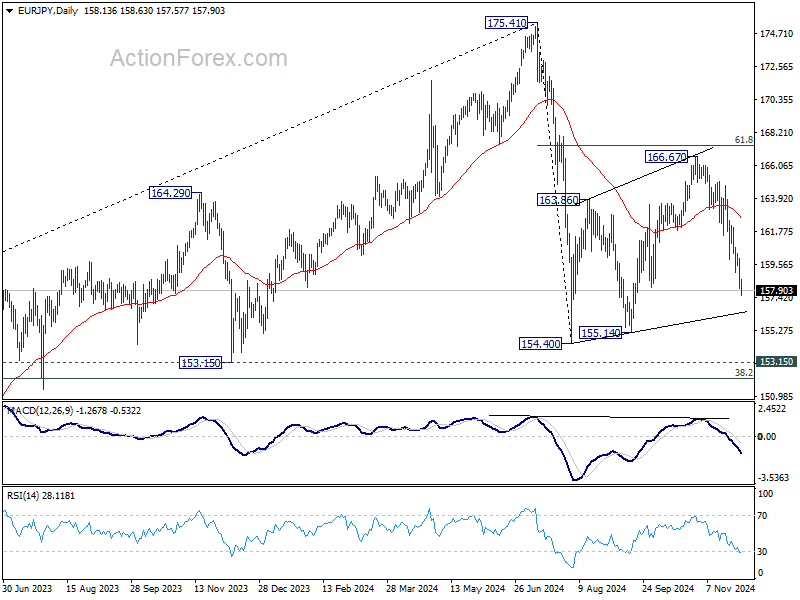
EUR/JPY Daily Outlook
Daily Pivots: (S1) 157.63; (P) 158.80; (R1) 159.55; More....
Intraday bias in EUR/JPY remains on the downside, as fall from 166.67 is in progress for 155.14 support first. Firm break there will raise the chance that whole decline from 175.41 is resuming, and target 154.40 low next. On the upside, above 159.08 minor resistance will turn intraday bias neutral first.

In the bigger picture, price actions from 175.41 are seen as correction to rally from 114.42 (2020 low). The range of consolidation should have been set between 38.2% retracement of 114.42 to 175.41 at 152.11 and 175.41 high. However, decisive break of 152.11 would argue that deeper correction is underway.
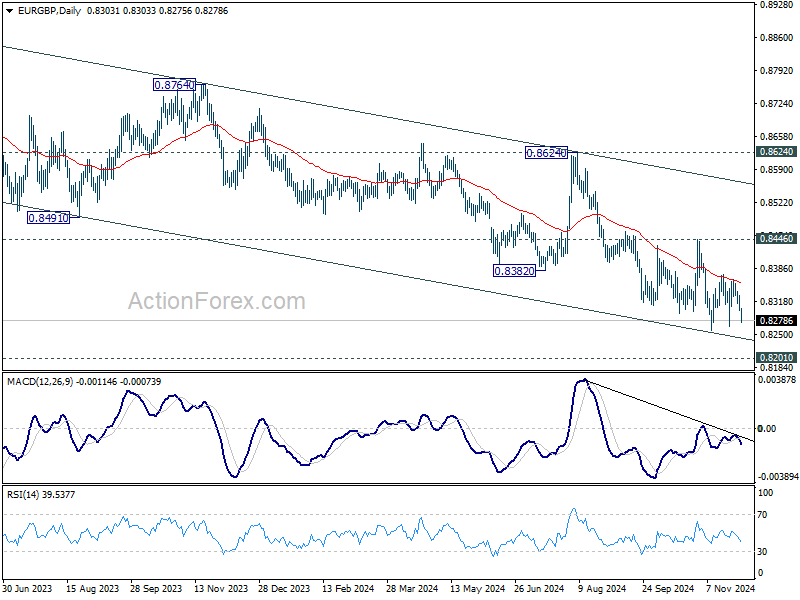
EUR/GBP Daily Outlook
Daily Pivots: (S1) 0.8295; (P) 0.8314; (R1) 0.8325; More...
EUR/GBP dips notably today but stays above 0.8259 support. Intraday bias remains neutral first. Further decline is expected with 0.8446 resistance intact. On the downside, decisive break of 0.8259 will resume larger down trend to 0.8201 key support.
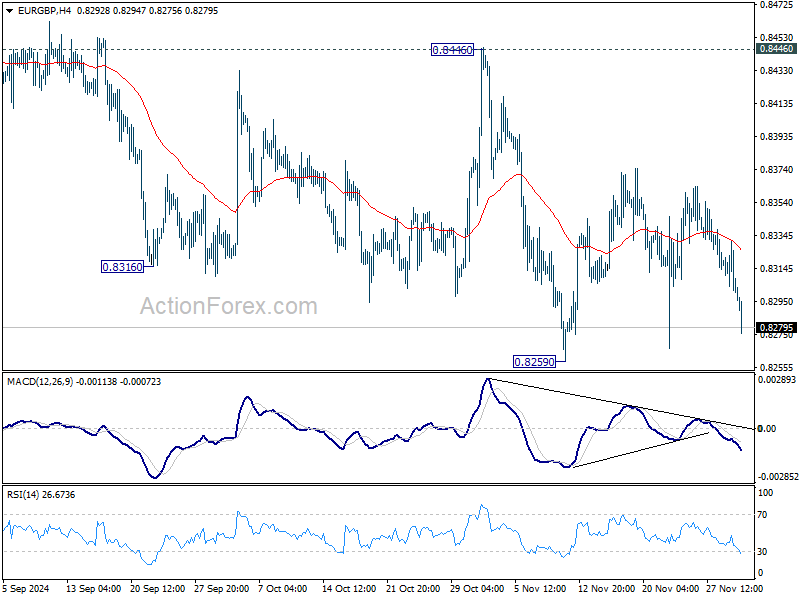
In the bigger picture, down trend from 0.9267 (2022 high) is in progress. Next target is 0.8201 (2022 low), but strong support should be seen there to bring rebound. However, outlook will remain bearish as long as 0.8624 resistance holds even in case of strong rebound. Decisive break of 0.8201 will indicate long term bearish reversal.
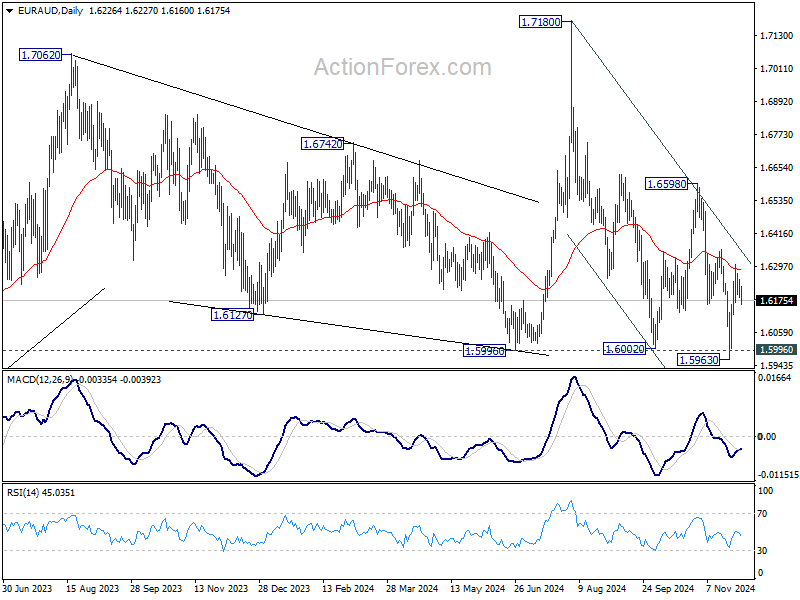
EUR/AUD Daily Outlook
Daily Pivots: (S1) 1.6200; (P) 1.6229; (R1) 1.6270; More...
Outlook in EUR/AUD is unchanged and intraday bias stays neutral. On the upside, firm break of 1.6359 resistance will be the first sign of bullish reversal and target 1.6598 resistance for confirmation. On the downside, though, below 1.6125 minor support will bring retest of 1.5963 low.

In the bigger picture, immediate focus is now on 1.5996 key support level. Sustained break there will argue that whole up trend from 1.4281 (2022 low) is already reversing. Deeper decline would be seen to 61.8% retracement of 1.4281 to 1.7180 at 1.5388, even as a correction. Nevertheless, strong rebound from current level, followed by break of 1.6359 resistance, will keep medium term outlook neutral at worst.
EUR/CHF Daily Outlook
Daily Pivots: (S1) 0.9300; (P) 0.9313; (R1) 0.9333; More....
Intraday bias in EUR/CHF stays neutral and outlook is unchanged. Further decline is in favor with 0.9343 resistance intact. On the downside, below 0.9269 minor support will bring retest of 0.9204/9 support zone. Decisive break there will confirm larger down trend resumption. Nevertheless, firm break of 0.9343 will now be a sign of near term bullish reversal, and target 0.9444 resistance for confirmation.

In the bigger picture, outlook will now stay bearish as long as 0.9444 resistance holds. Decisive break of 0.9209 low will resumed long term down trend to 61.8% projection of 0.9772 to 0.9209 from 0.9444 at 0.9096 next.

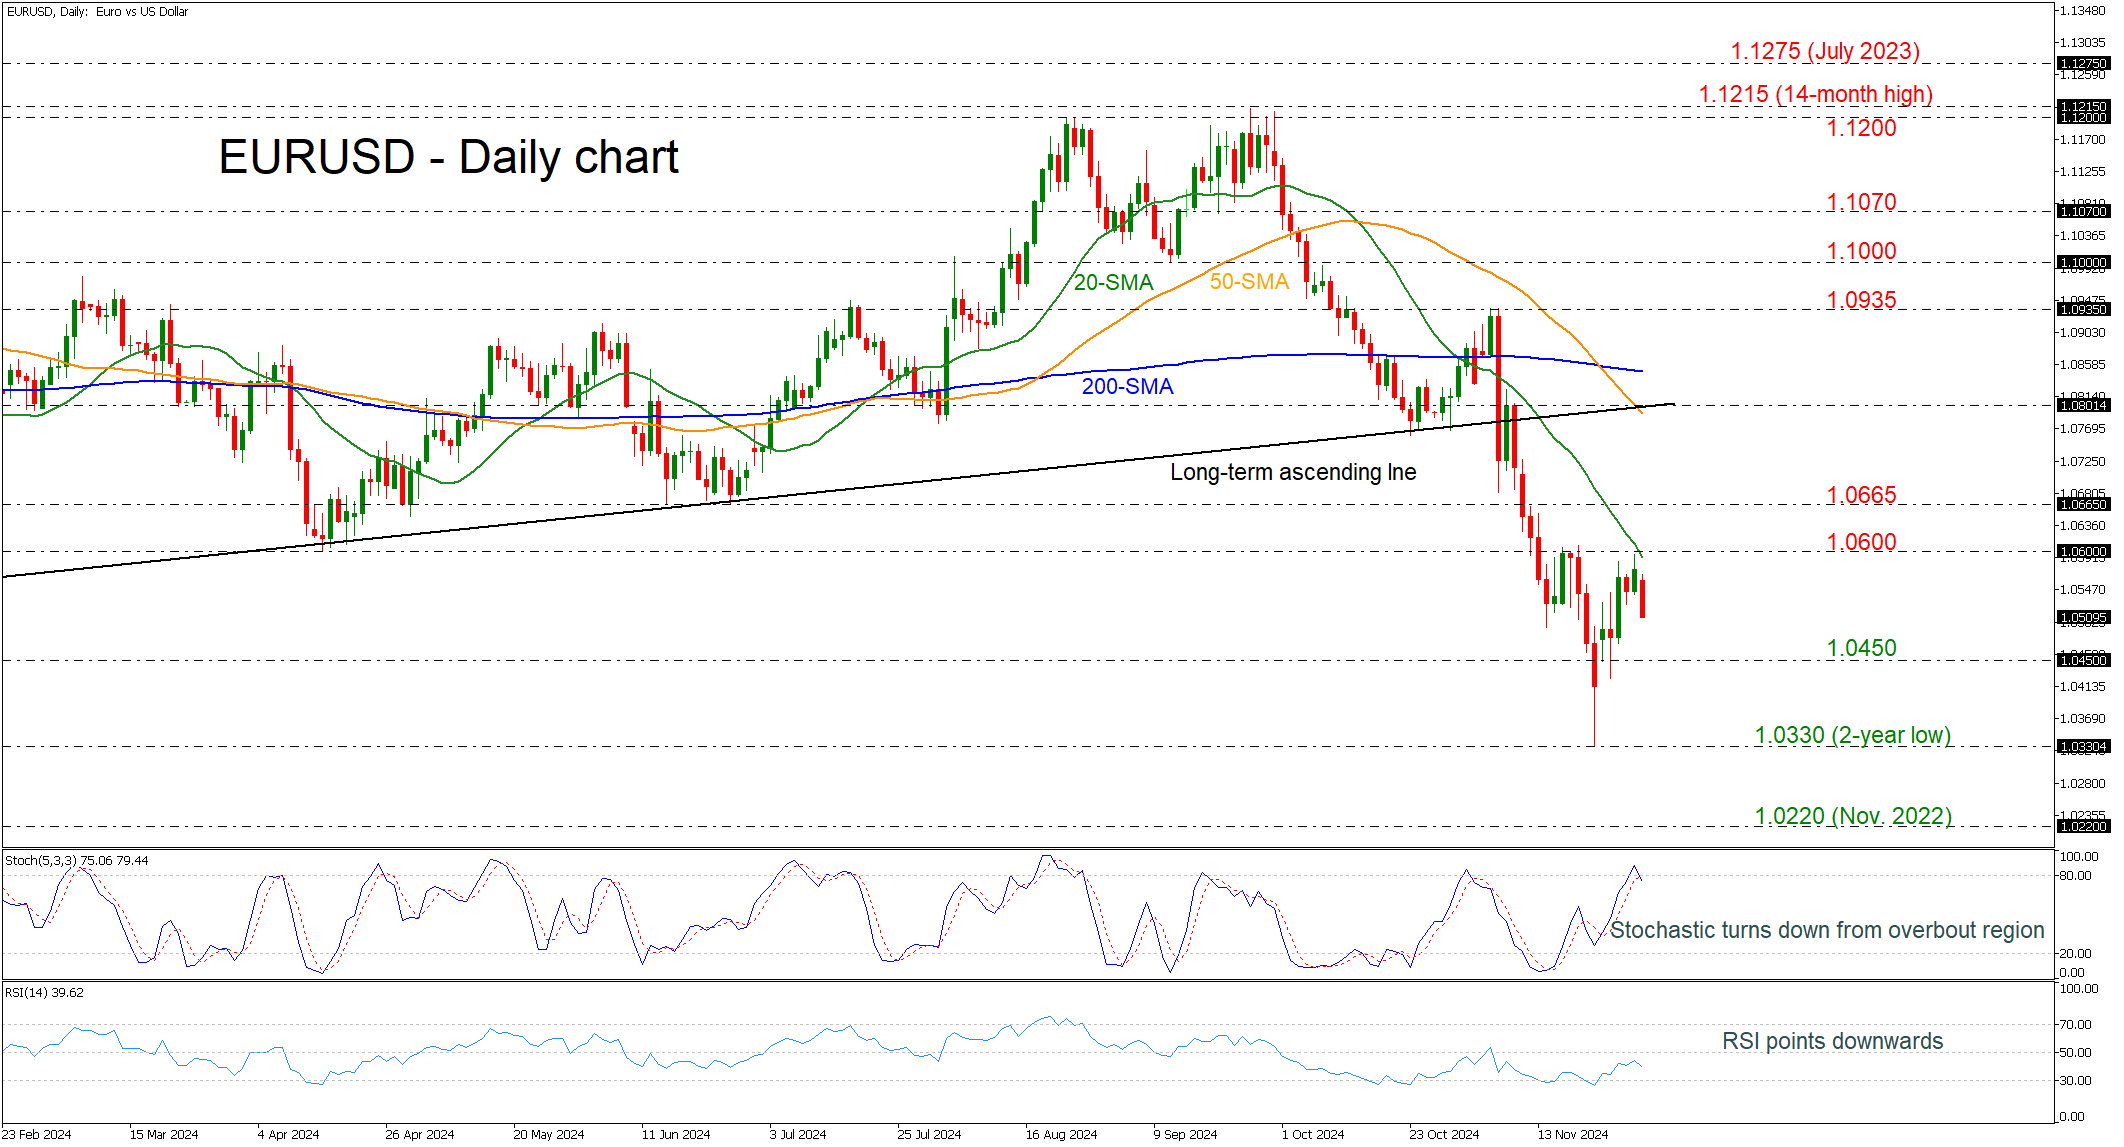
EURUSD Keeps Downside Momentum
- EURUSD meets 1.0500 again
- Stochastic and RSI continue bearish moves
EURUSD failed to extend its bullish movement above the 1.0600 round number, which overlaps with the 20-day simple moving average (SMA), raising the likelihood for further downside movements.
According to technical oscillators the upside momentum of the last ten days may come to an end. The stochastic oscillator posted a bearish crossover within its %K and %D lines in the overbought territory, while the RSI is sloping south below the neutral threshold of 50.
If the price continues the selling interest, then the first support for traders to look for is the 1.0450 barricade. Even lower, the two-year low of 1.0330 may pause the bearish move; but if a lower low take place, then the market may visit November 2022 trough at 1.0220.
In the positive scenario, a climb above the 1.0600 obstacle could add some optimism for more bullish actions heading towards the 1.0665 bar and the 1.0800 round number, which coincides with the 50-day SMA.
To conclude, EURUSD has been in a bearish tendency since September 25, losing around 8%. The signs for upside correction are fading, especially as long as the price remains below 1.0600.
GBP/USD Climbs Back as EUR/GBP Faces Pressure
GBP/USD is attempting a recovery wave above the 1.2600 resistance. EUR/GBP declined steadily below the 0.8340 and 0.8330 support levels.
Important Takeaways for GBP/USD and EUR/GBP Analysis Today
- The British Pound is attempting a fresh increase above 1.2620.
- There is a key bullish trend line forming with support near 1.2680 on the hourly chart of GBP/USD at FXOpen.
- EUR/GBP is trading in a bearish zone below the 0.8330 pivot level.
- There is a connecting bearish trend line forming with resistance near 0.8305 on the hourly chart at FXOpen.
GBP/USD Technical Analysis
On the hourly chart of GBP/USD at FXOpen, the pair declined after it failed to clear the 1.3000 resistance. As mentioned in the previous analysis, the British Pound even traded below the 1.2800 support against the US Dollar.
Finally, the pair tested the 1.2500 zone and is currently attempting a fresh increase. The bulls were able to push the pair above the 50-hour simple moving average and 1.2600. The pair even climbed above the 1.2700 level.
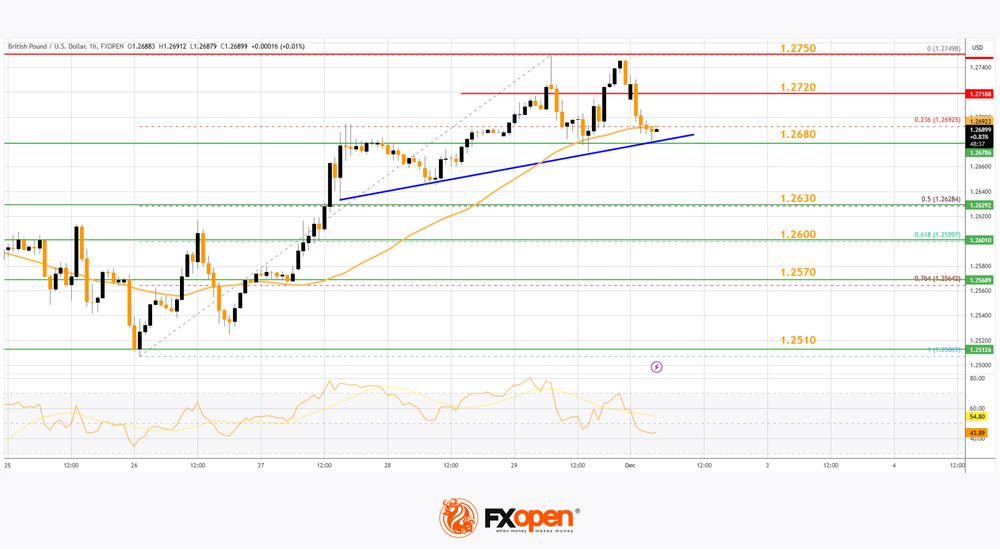
A high was formed at 1.2749 and the pair is now consolidating gains. There was a move below the 23.6% Fib retracement level of the upward move from the 1.2506 swing low to the 1.2749 high.
On the upside, the GBP/USD chart indicates that the pair is facing resistance near 1.2720. The next major resistance is near 1.2750. A close above the 1.2750 resistance zone could open the doors for a move toward 1.2800. Any more gains might send GBP/USD toward 1.2880.
On the downside, there is a bullish trend line forming with support at 1.2680. If there is a downside break below 1.2680, the pair could accelerate lower. The first major support is near the 1.2630 level and the 50% Fib retracement level of the upward move from the 1.2506 swing low to the 1.2749 high.
The next key support is seen near 1.2600, below which the pair could test 1.2570. Any more losses could lead the pair toward the 1.2510 support.
EUR/GBP Technical Analysis
On the hourly chart of EUR/GBP at FXOpen, the pair started a fresh decline from well above 0.8350. The Euro traded below the 0.8320 and 0.8320 support levels against the British Pound.
The EUR/GBP chart suggests that the pair even declined below the 0.8300 level and tested 0.8290. It is now consolidating losses and trading below the 50-hour simple moving average. The pair is now facing resistance near the 23.6% Fib retracement level of the downward move from the 0.8364 swing high to the 0.8289 low.
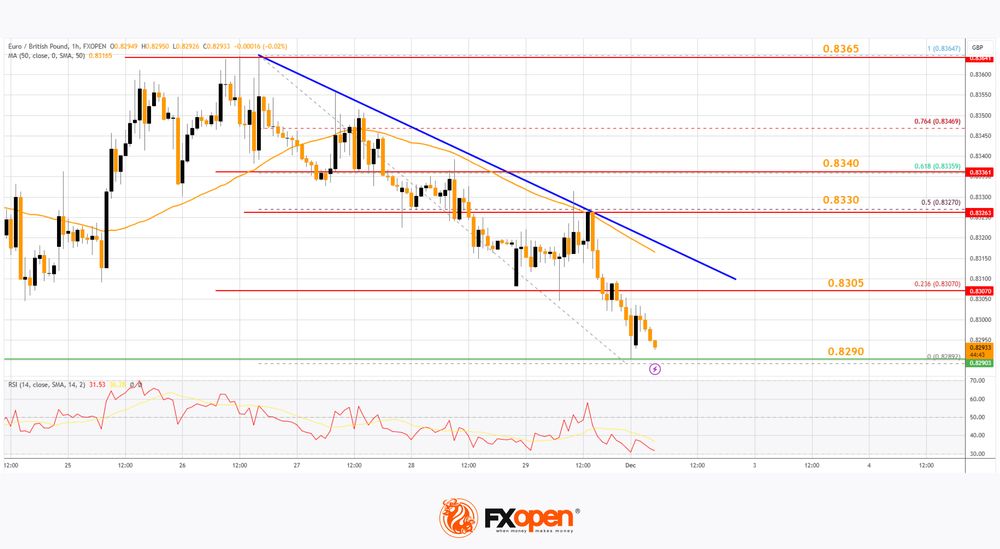
There is also a connecting bearish trend line forming with resistance near 0.8305. The next major resistance could be 0.8330. It coincides with the 50% Fib retracement level of the downward move from the 0.8364 swing high to the 0.8289 low.
The main resistance is near the 0.8340 zone. A close above the 0.8340 level might accelerate gains. In the stated case, the bulls may perhaps aim for a test of 0.8365. Any more gains might send the pair toward the 0.8400 level.
Immediate support sits near 0.8290. The next major support is near 0.8265. A downside break below the 0.8265 support might call for more downsides. In the stated case, the pair could drop toward the 0.8240 support level.
Trade over 50 forex markets 24 hours a day with FXOpen. Take advantage of low commissions, deep liquidity, and spreads from 0.0 pips. Open your FXOpen account now or learn more about trading forex with FXOpen.
This article represents the opinion of the Companies operating under the FXOpen brand only. It is not to be construed as an offer, solicitation, or recommendation with respect to products and services provided by the Companies operating under the FXOpen brand, nor is it to be considered financial advice.