Sample Category Title
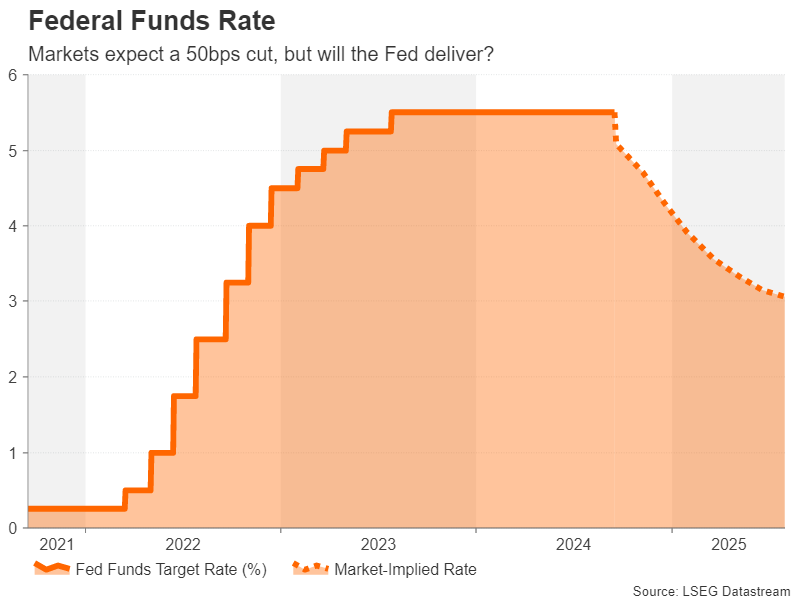
Will Fed Cut by 25 bps or 50 bps?
- Fed is expected to cut rates, but is it too late to the game?
- Intense speculation about size of cut as markers lean towards 50 bps
- New dot plot will also be crucial in Wednesday’s decision at 18:00 GMT
Fed to join rate-cut club
The timing of the Fed’s first interest rate cut of the cycle has been the dominant market theme all year, but since the summer, the narrative has changed to the size of the cut, not when. Nevertheless, after much frenzied speculation, the moment of truth has arrived, and the Fed is almost certain to begin its long-awaited easing cycle on Wednesday.
Until a few days ago, investors had all but priced out the probability of a 50-basis-point rate cut, as the July payrolls report that sparked fears of a possible US recession was not followed up by similarly weak data. But that hasn’t stopped some market participants to worry that the Fed has left it too late to start trimming borrowing costs and that a hard landing may now be inevitable.
What recession?
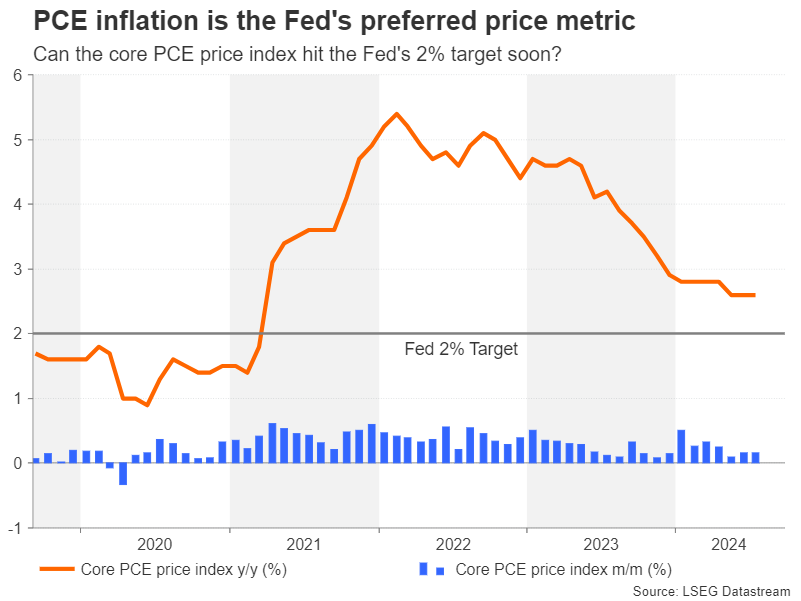
So how likely is a recession? The US economy clearly appears to be slowing, particularly the labour market. But there’s few signs in the hard data that currently point to a significant risk of an outright recession (although it’s worth remembering that jobs numbers tend to be lagging indicators) and inflation isn’t exactly falling off a cliff either.
The Atlanta Fed GDPNow model’s latest estimate is growth of 2.5% in the third quarter and the core PCE measure of inflation has been stuck at 2.6% for the past three months. These are hardly red flags that would prompt policymakers to slash rates by 50 basis points. Yet, markets remain jittery and even former New York Fed President Bill Dudley has joined calls for the central bank to cut rates by half a point this week, arguing that policy is too restrictive.
Fed is flip-flopping
The Fed may have started to take on board some of the criticism. Both the Financial Times and Wall Street Journal published articles last week suggesting that the Fed is debating whether to cut rates by 25 bps or 50 bps, despite no strong hints from officials that they saw the decision as such a dilemma before going into the blackout period.
This dramatically flipped expectations for Wednesday’s announcement back towards a 50-bps reduction. Not only that, but investors have also priced in rate cuts of almost 250 bps over the next 12 months, 120 of which are expected by year-end. Unsurprisingly, the US dollar has taken a dive in FX markets while shares on Wall Street just had their best week since last October.
A communications challenge
The problem is that there’s a danger traders have misinterpreted the Fed’s motives in ‘prepping’ the markets for the possibility of a 50-bps cut. By creating the impression that the September decision is going to be a close call, policymakers may have simply wanted to send a strong signal that they’re ready to adjust rates aggressively should it be warranted. Moreover, by setting a dovish backdrop for the meeting and additionally using the dot plot to flag multiple rate cuts in the months ahead, any reduction, whether it’s 50 bps or only 25 bps, would be perceived as a ‘dovish cut’.
But a potential challenge for the Fed, or more specifically for Chair Jerome Powell, to cutting rates by 50 bps is how to communicate a larger cut. Powell and his colleagues have gone out of their way to brush off concerns that the American economy is about to hit the rocks. So how would they go about justifying the reasoning behind a 50-bps move without setting off alarm bells that they see trouble ahead?
Frontloading may be the way to go
One argument is that if they increasingly view the risks to the labour market as being tilted to the downside, frontloading the rate cuts now would give them an insurance policy against a sharp slowdown and they could always pause if the worst case scenario doesn’t materialise. But again, even if Powell can convince investors why it was necessary to act aggressively without triggering any recession panic, it would still be an admission that the Fed kept rates too high for too long.
Thus, whatever the decision, it’s hard to see Powell’s press conference, scheduled 30 minutes after the announcement, to pass without any episodes in financial markets. With the odds for a 50-bps cut now standing at around 60%, the dollar could reverse sharply higher if the Fed disappoints.
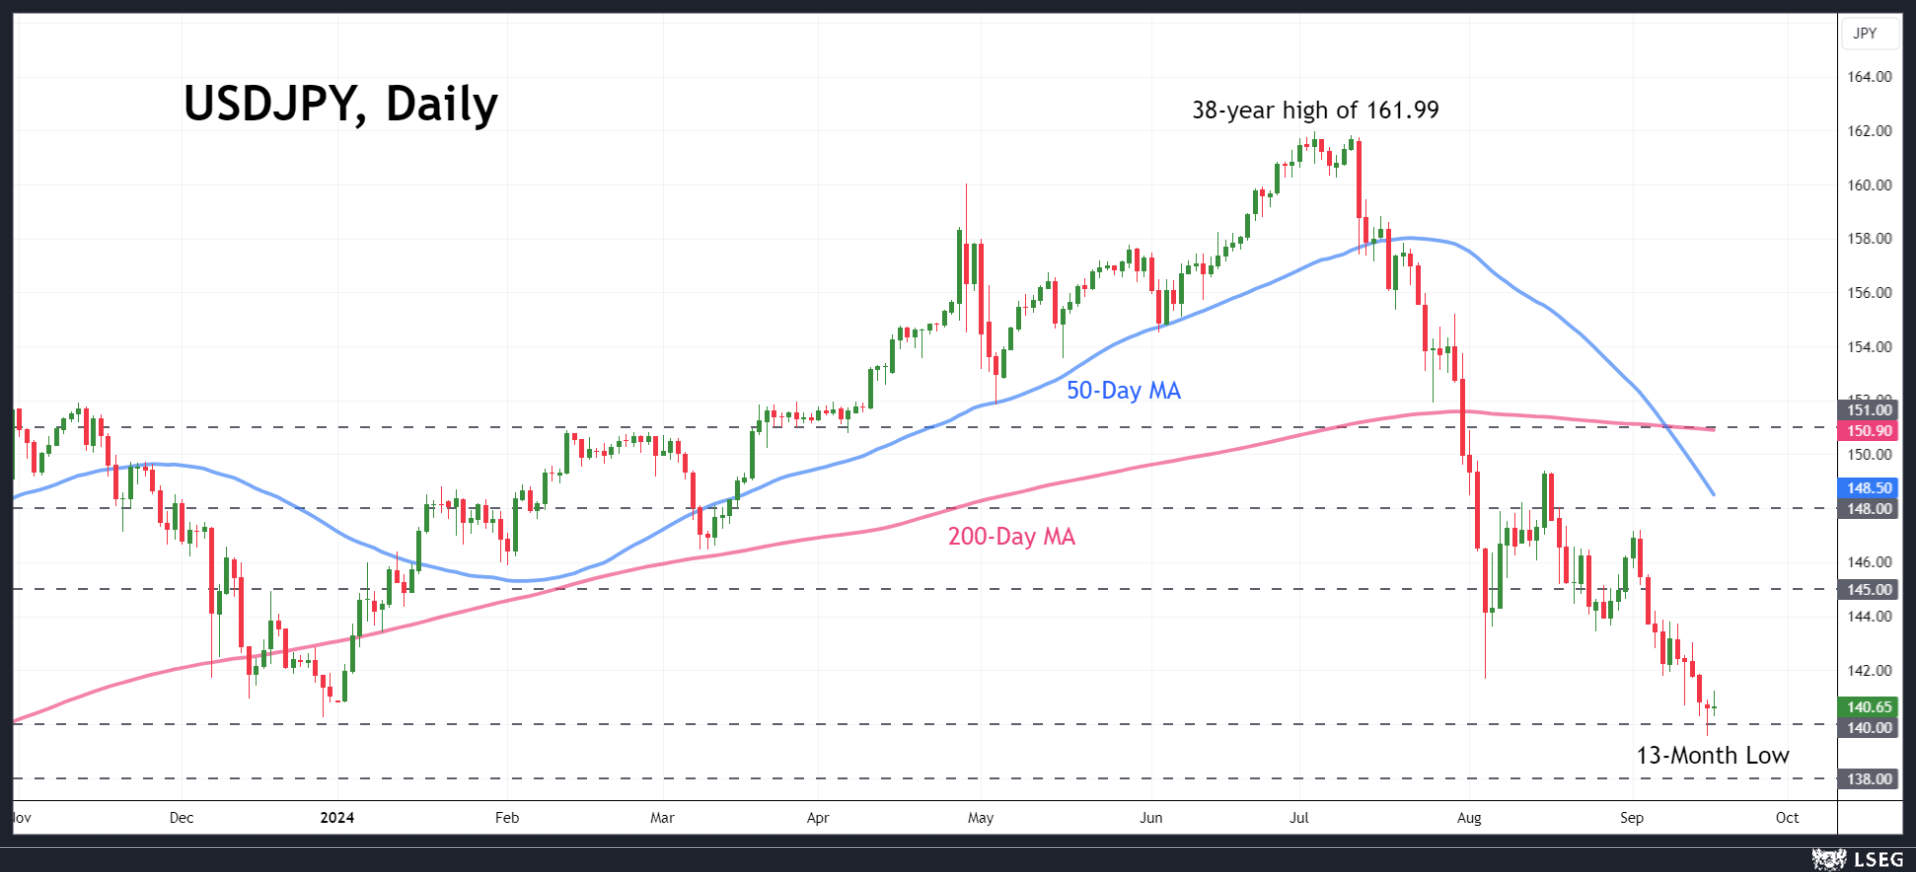
Is the dollar set for a rebound?
The upside risk is particularly high for dollar/yen, which has been on the slide since July and is therefore looking a little oversold. The lower highs of 147.20 and 149.39 are potential targets for the bulls. The latter also happens to be close to the 50-day moving average, while the 200-day moving average is flatlining in the 151.00 region.
However, if the Fed does go ahead with a 50-bps cut or pleases markets with a very dovish dot plot, the dollar could soon be headed for 138.00 yen before testing the 135.00 mark.
Ahead of the Fed decision, investors will be watching the retail sales numbers for August, out on Tuesday at 13:30 GMT.
EURJPY Seems to Have Found a Floor
- EURJPY rebounds off 155.15
- Immediate resistance at downtrend line
- RSI and MACD look negative
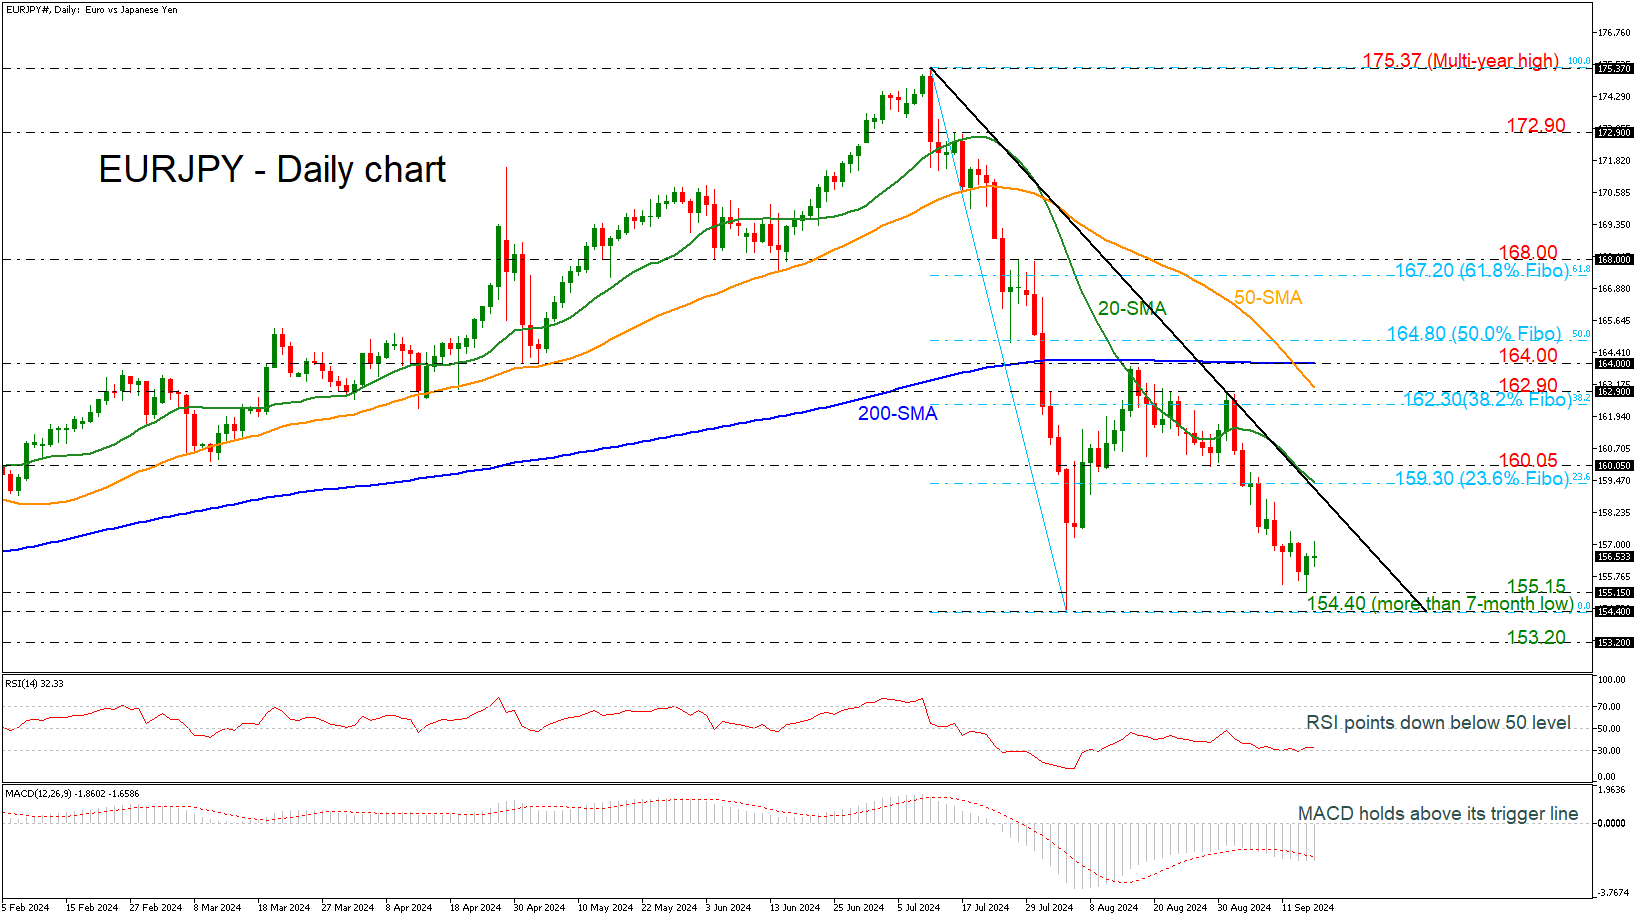
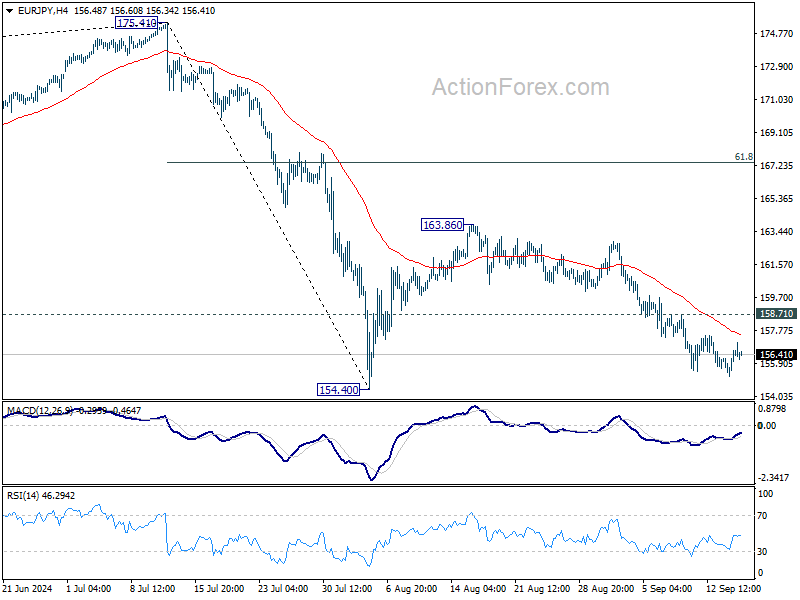
EURJPY held losses for the second week in a row, dropping towards the 155.15 support, which stands slightly above the more-than-seven-month low.
Technically, the price could lose some ground in the short term as the RSI is changing direction to the downside and towards its 30 mark, while the MACD is still standing beneath its trigger and zero lines. Moreover, the 50- and the 200-day simple moving averages (SMAs) posted a bearish crossover.
A rebound on the 155.15 support could take the pair towards the short-term descending trend line at 158.00, ahead of the 159.30-160.05 restrictive region, which encapsulates the 23.6% Fibonacci retracement level of the down leg from 175.37 to 154.40, as well as the 20-day SMA.
Alternatively, a decline under 155.15 could meet a strong barrier near 154.40; even lower, 153.20 may halt bearish actions, taken from the trough of December 2023.
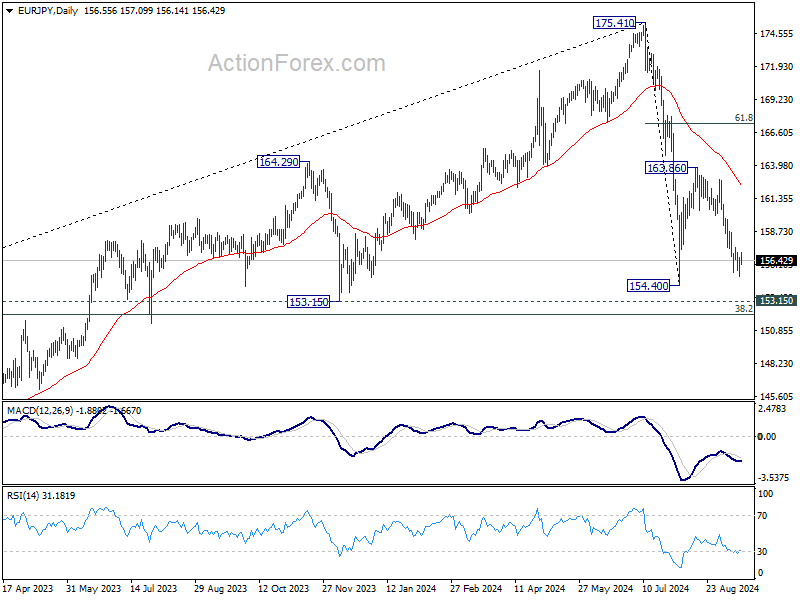
In the medium-term picture, EURJPY is gently pointing up over the past, framing a potential upside correction. A strong rally above the 200-day SMA at 164.00 would extend the upward pattern, making the outlook more bullish.
In brief, USDJPY could lose further steam in the short term if there is a plunge below 154.50, while in the long term, the pair continues to hold a positive outlook.
Elliott Wave View on Nasdaq (NQ) Calling the Next Bullish Leg Has Started
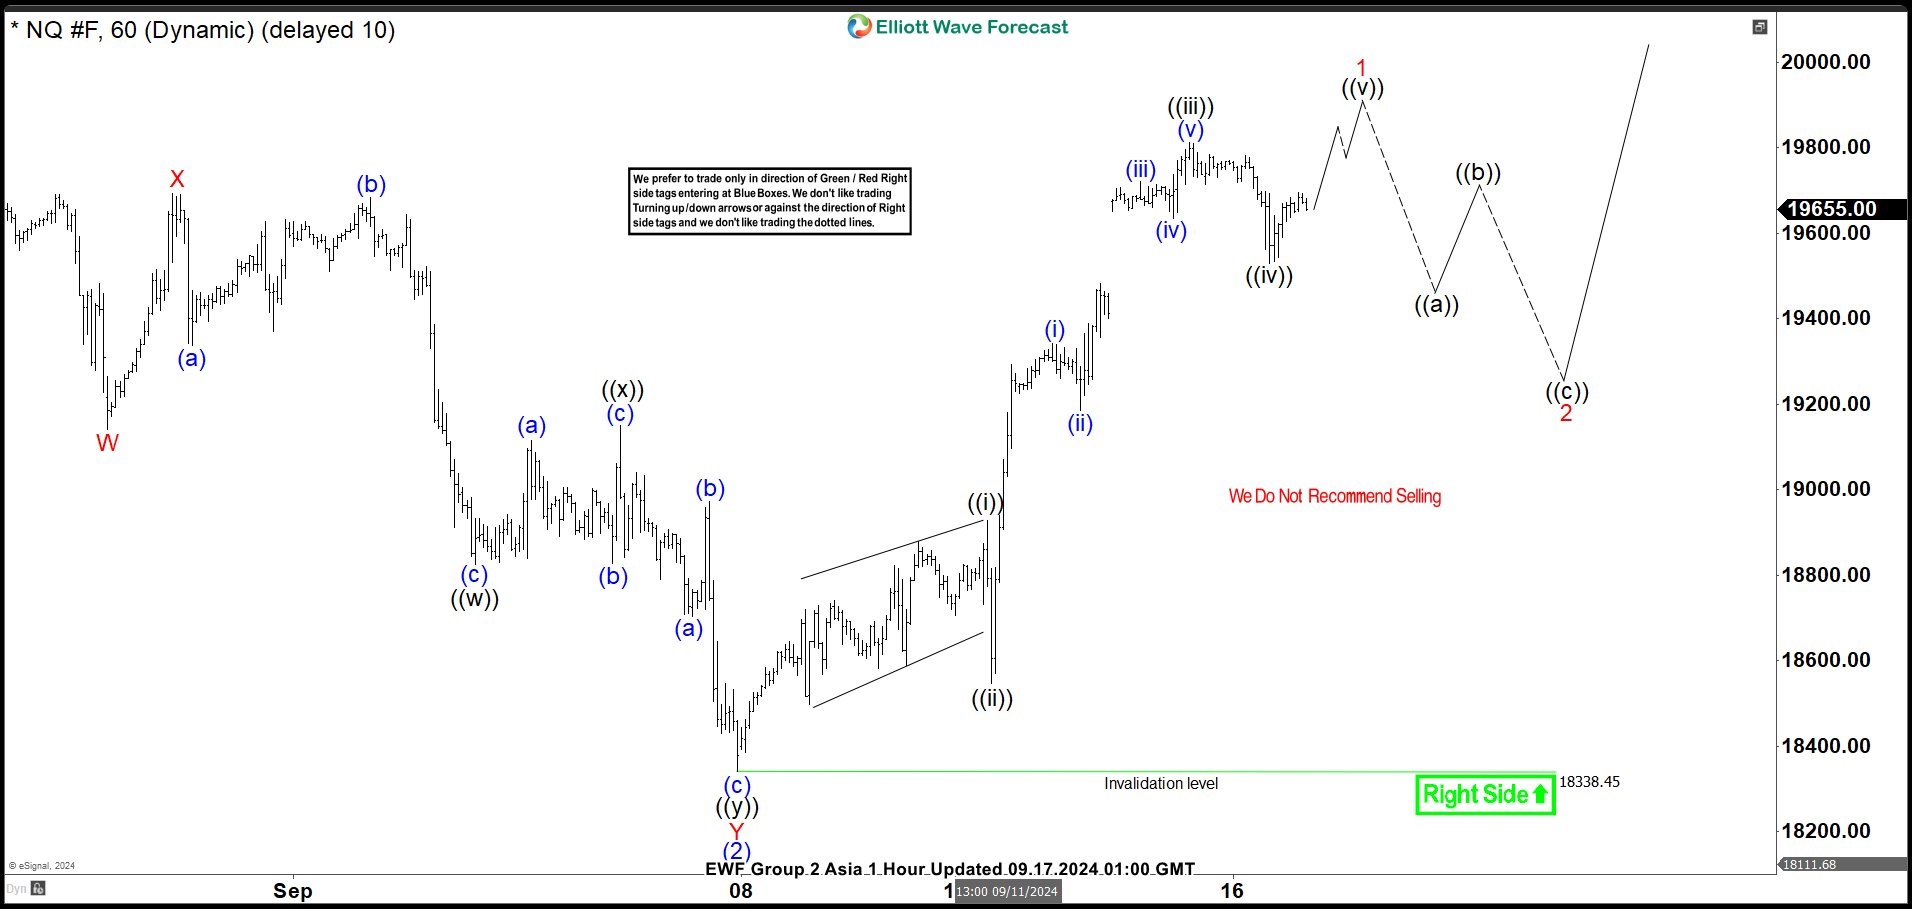
Short term Elliott Wave view on Nasdaq (NQ) shows that rally from 8.5.2024 low is unfolding as a 5 waves impulse. Up from 8.5.2024 low, wave (1) ended at 20025.25. Pullback in wave (2) ended at 18338.45 with internal subdivision as a double three Elliott Wave structure. Down from wave (1), wave W ended at 19140.25 and wave X ended at 19693.50. Wave Y lower unfolded as another double three in lesser degree. Down from wave X, wave ((w)) ended at 18825.75 and wave ((x)) ended at 19150.50. Wave ((y)) lower ended at 18338.45 which completed wave Y of (2) in higher degree.
The Index has turned higher in wave (3) with internal subdivision as a 5 waves impulse. Up from wave (2), wave ((i)) ended at 18927.5 and pullback in wave ((ii)) ended at 18547. Wave ((iii)) higher ended at 19813.50 and pullback in wave ((iv)) ended at 19529. Near term, expect Index to extend higher to end wave ((v)) and this should complete wave 1 in higher degree. Afterwards, it should pullback in wave 2 to correct cycle from 9.7.2024 low in 3, 7, 11 swing before it resumes higher.
Nasdaq (NQ) 60 Minutes Elliott Wave Chart
NQ Elliott Wave Video
https://www.youtube.com/watch?v=yoWu8Nzh9fE
Further Loss of Interest Rate Support Makes South the Path of Least Resistance for Dollar
Markets
With investors counting down to the Fed policy decision on Wednesday, yields moving further south still was the path of least resistance on US (and EMU) interest rate markets. Maybe a bit strange that when discussing a jumbo rate cut at the start of the easing cycle, the long end of the US yield curve outperformed (2-y -3.1 bps, 30-y -5.1 bps). Technical considerations might have been in play. The 2-y yield is already testing the March 2023 low. Longer maturities are falling below (10-y) or are testing 30-y the December 2023 low. Also something to keep an eye on, the US 10-y real yield remains on a protracted downward trajectory (cycle top 2.58% October last year, 2.30% end April and currently nearing the 1.50% barrier). This suggests already a substantial easing of financial conditions. Economic data were few. The New York Fed manufacturing survey showed an unexpected sharp rebound, both for the current conditions measures (11.5 from -4.7) and for the 6M ahead expectations (30.6 from 22.9). The release triggered some brief jitters on the intraday graphs, but didn’t change the overall trend. In the end markets further raised the odds for a 50 bps step on Wednesday to 70%+. German Bunds still underperform Treasuries as several ECB governors (Kazaks, Kazimir, de Guindos) fully supported a data-dependent approach with many of them signalling reluctance on the room to already make a next step at the October meeting. Bund yields eased between 2.8 bps and 3.1 bps. A further loss of interest rate support (decline in the US real yield) also makes south the path of least resistance for the US dollar. EUR/USD regained the 1.11 barrier (close 1.1133). DXY is only a whisker away from key support at 100.51 (YTD low) and at 100.23 (end December 2023 low). USD/JPY intraday briefly dropped below the 140 barrier, but still closed at 140.62. Equities showed a mixed picture (Dow +0.55%, Nasdaq -0.52%). Oil tries a bottoming out process after the sell-off late August/early September.
Japanese markets this morning reopen in a risk-off mode. However, this time it doesn’t really help the yen. USD/JPY holds little changed at 140.65. DXY shows no clear trend (100.75). US yields tentatively rise about 1.0 bp. Later today, US retail sales, production data and the NAHB housing index are providing final input for tomorrow’s Fed policy decision. Headline August US retail sales are expected to ease marginally (-0.2%) after strong July reading (soft auto & gas sales expected). Control group sales are expected at 0.3%. We don’t expected today’s data to profoundly change markets’ assessment on tomorrow’s Fed interest rate decision. As already indicated yesterday, it’s all about Fed tactics, more than about data. With key technical levels nearby in US yields (cf supra) and in the dollar (DXY 100.25/50 area, EUR/USD 1.1155/1.1202), some order-driven technical trade might be on the cards.
News & Views
Czech National Bank member Holub, who leaves the board by the end of the year, argued in favour of continuing with making monetary policy less restrictive at the final two meetings of the year, bringing the policy rate down to 4% from currently 4.5%. Even a reduction to 3.75% by end 2024 would still mean slightly restrictive monetary conditions. “It would be premature to end or pause the rate-cutting cycle. The economy is bouncing from the bottom but in a very hesitant way.” Both headline and core inflation are close enough to target which in Holub’s view means there no need for such a restrictive policy. Slowed-than-expected wage growth, subdued private spending and weaker demand for Czech exports all cement the inflation outlook. Services inflation is also showing signs of a gradual slowdown while easing cycles by the Fed and the ECB should fend off downward pressure on the Czech koruna. EUR/CZK bounced off the psychologic 25 barrier earlier this month to currently change hands at 25.15. There’s strong technical resistance in the 25.40/50 area.
Former Fed vice-chair and current National Economic Council director Lael Brainard said that with inflation coming back down to normal levels, it is important to safeguard the important labour market progress made. She pointed to sticky housing prices, without which CPI is only rising about 1.8% Y/Y, below the Fed’s 2% price goal. She added that the US actually needs more homes to get to greater affordability. That will be more possible in an environment that is more supportive in terms of the market interest rates.
Graphs
GE 10y yield
The ECB cut policy rates by 25 bps in June and in September. Stubborn inflation (core, services) make follow-up moves less evident. We expect the central bank to stick with the quarterly reduction pace. Disappointing US and unconvincing EMU activity data dragged the long end of the curve down. The move accelerated during the early August market meltdown.
US 10y yield
The Fed in its July meeting paved the way for a first cut in September. It turned attentive to risks to the both sides of its dual mandate as the economy is moving to a better in to balance. The pivot weakened the technical picture in US yields. A string of weak eco data and a risk-off market climate pushed and kept the 10-yr sub 4%. We think we could be up to three 50 bps rate cuts this year.
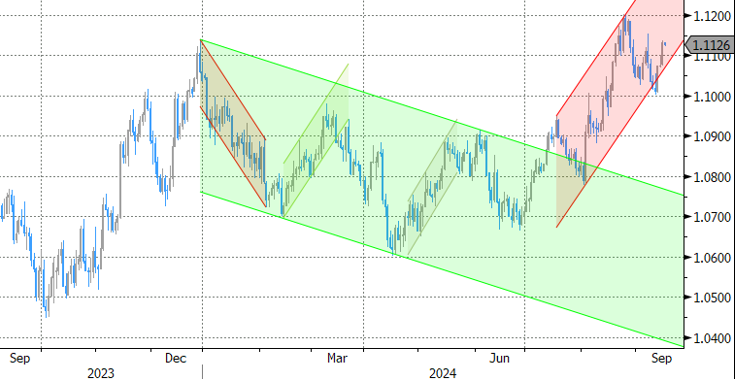
EUR/USD
EUR/USD moved above the 1.09 resistance area as the dollar lost interest rate support at stealth pace. US recession risks and bets on fast and large rate cuts trumped traditional safe haven flows into USD. EUR/USD 1.1276 (2023 top) serves as next technical references.
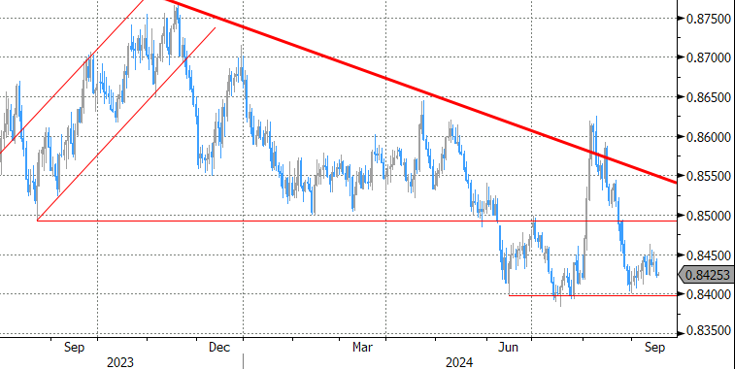
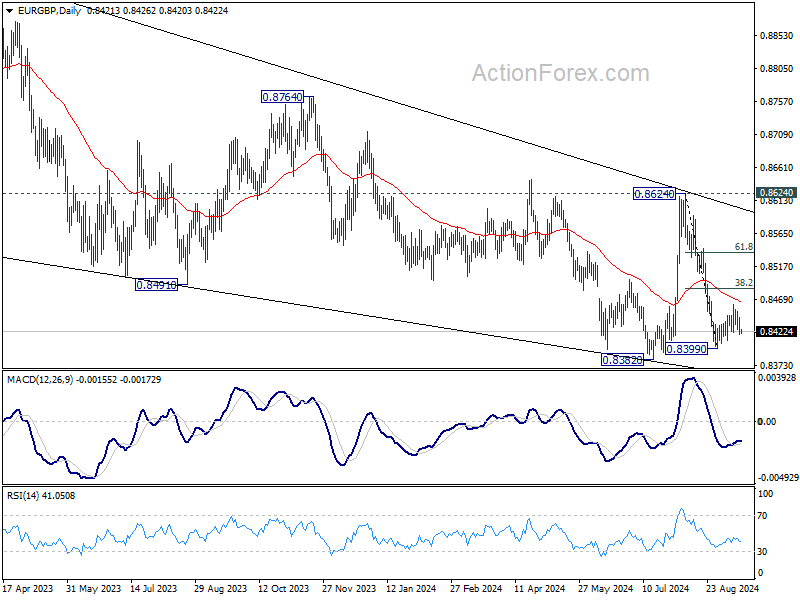
EUR/GBP
The BoE delivered a hawkish cut in August. Policy restrictiveness will be further unwound gradually on a pace determined by a broad range of data. The strategy similar to the ECB’s balances out EUR/GBP in a monetary perspective. Recent better UK activity data and a cautious assessment of BoE’s Bailey at Jackson Hole are pushing EUR/GBP lower in the 0.84/0.086 range.
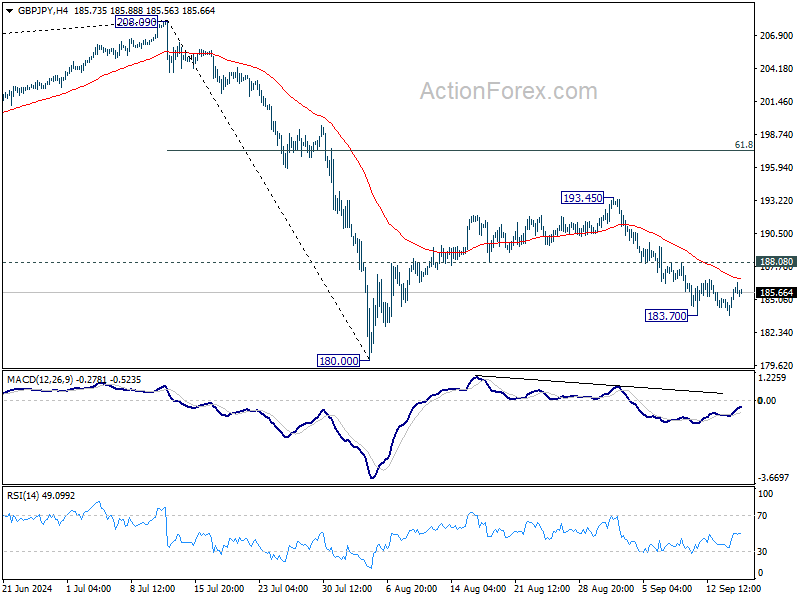
GBP/JPY Daily Outlook
Daily Pivots: (S1) 184.38; (P) 185.21; (R1) 186.64; More...
Intraday bias in GBP/JPY remains neutral and outlook will stay cautiously bearish as long as 18.08 resistance holds. Below 183.70 will resume the fall from 193.45 to retest 180.00 low. Firm break there will extend whole decline from 208.09 to 175.94 fibonacci level.
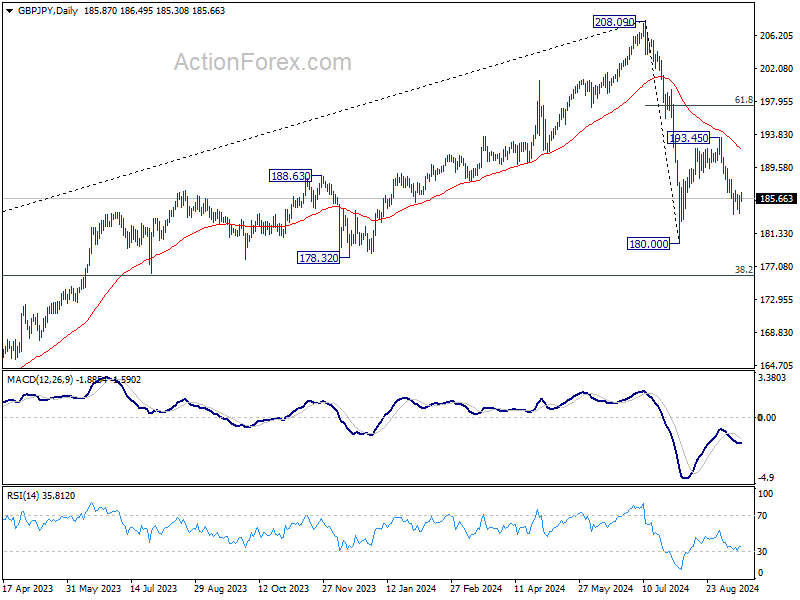
In the bigger picture, price actions from 208.09 are seen as a correction to whole rally from 123.94 (2020 low). The range of consolidation should be set between 38.2% retracement of 123.94 to 208.09 at 175.94 and 208.09. However, decisive break of 175.94 will argue that deeper correction is underway.
EUR/JPY Daily Outlook
Daily Pivots: (S1) 155.58; (P) 156.12; (R1) 157.09; More....
Intraday bias in EUR/JPY is turned neutral again with current recovery, and some consolidations would be seen. But further decline is expected as long as 158.71 resistance holds. Decisive break of 154.40 low will resume whole decline from 175.41 to 153.15 support, and possibly further to 152.11 fibonacci level.
In the bigger picture, price actions from 175.41 are seen as correction to rally from 114.42 (2020 low). The range of consolidation should have been set between 38.2% retracement of 114.42 to 175.41 at 152.11 and 175.41 high. However, decisive break of 152.11 would argue that deeper correction is underway.
EUR/GBP Daily Outlook
Daily Pivots: (S1) 0.8415; (P) 0.8430; (R1) 0.8439; More...
Intraday bias in EUR/GBP stays neutral at this point. Consolidation from 0.8399 is in progress and stronger recovery cannot be ruled out. But upside should be limited by 38.2% retracement of 0.8624 to 0.8399 at 0.8485. Break of 0.8399 will bring retest of 0.8382 low. Firm break there will resume larger down trend. However, sustained break of 0.8485 will bring stronger rally to 61.8% retracement at 0.8538 and possibly above.
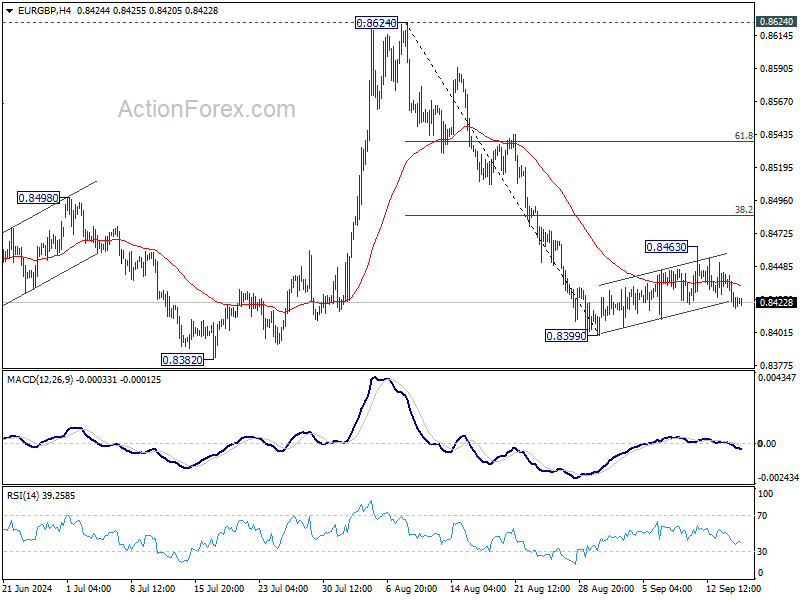
In the bigger picture, as long as 0.8624 resistance holds, down trend from 0.9267 is expected to continue. Firm break of 0.8382 will target 0.8201 (2022 low). However, decisive break of 0.8624 will indicate that such down trend has completed, and turn outlook bullish for 0.8764 resistance next.
EUR/AUD Daily Outlook
Daily Pivots: (S1) 1.6463; (P) 1.6505; (R1) 1.6530; More...
Intraday bias in EUR/AUD stays neutral and outlook is unchanged. For now, the favored case remains that corrective fall from 1.7180 has completed at 1.6256 already. On the upside, above 1.6629 will resume the rebound for retesting 1.7180 high. However, firm break of 1.6457 minor support will dampen this view and turn bias back to the downside for 1.6256 again.
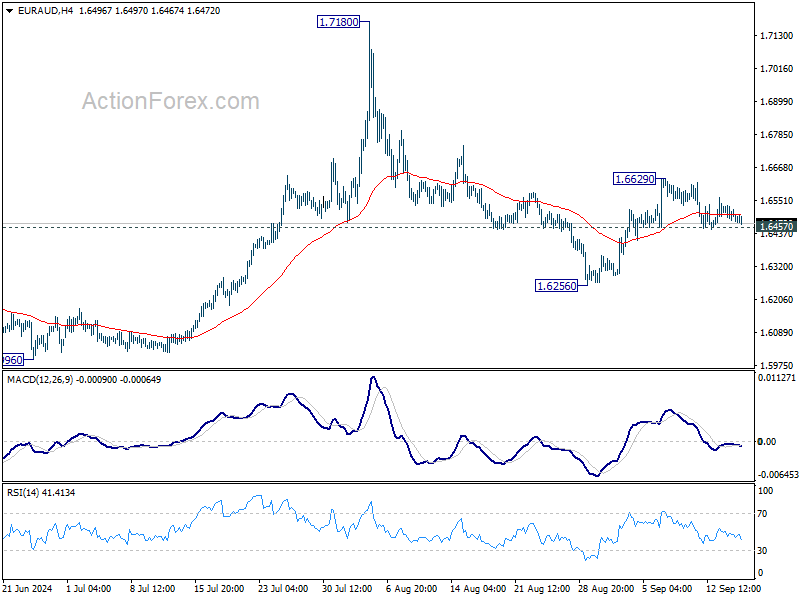
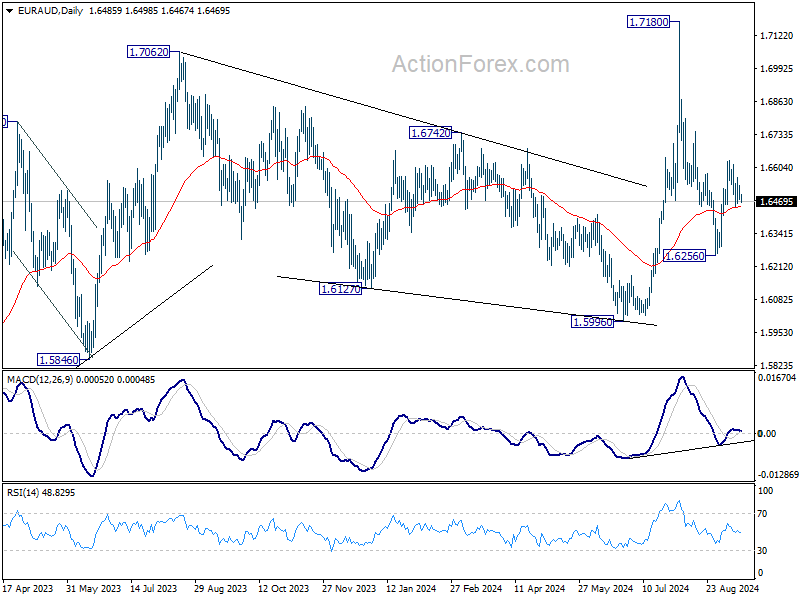
In the bigger picture, outlook is mixed up by the deeper than expected fall from 1.7180. Yet as long as 1.5996 support holds, up trend from 1.4281 (2022 low) is still in favor to resume at a later stage. Firm break of 1.7180 will pave the way to 61.8% projection of 1.4281 to 1.7062 from 1.5996 at 1.7715.
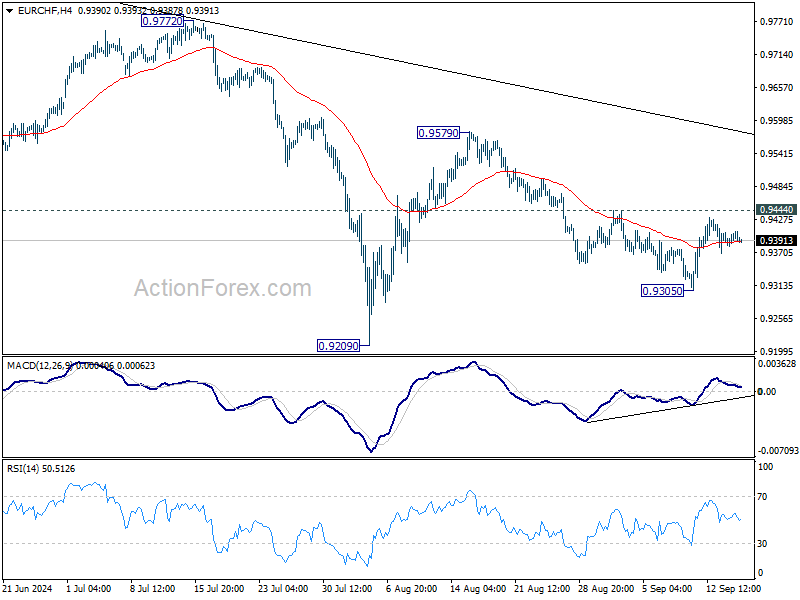
EUR/CHF Daily Outlook
Daily Pivots: (S1) 0.9389; (P) 0.9399; (R1) 0.9416; More....
Intraday bias in EUR/CHF stays neutral and further decline is in favor with 0.9444 resistance intact. On the downside, below 0.9305 will resume the fall from 0.9579 to retest 0.9209 low. Firm break there will resume larger down trend. However, decisive break of 0.9444 will argue that the fall from 0.9579 has completed as a corrective move. Intraday bias will be turned bias to the upside for 0.9579.
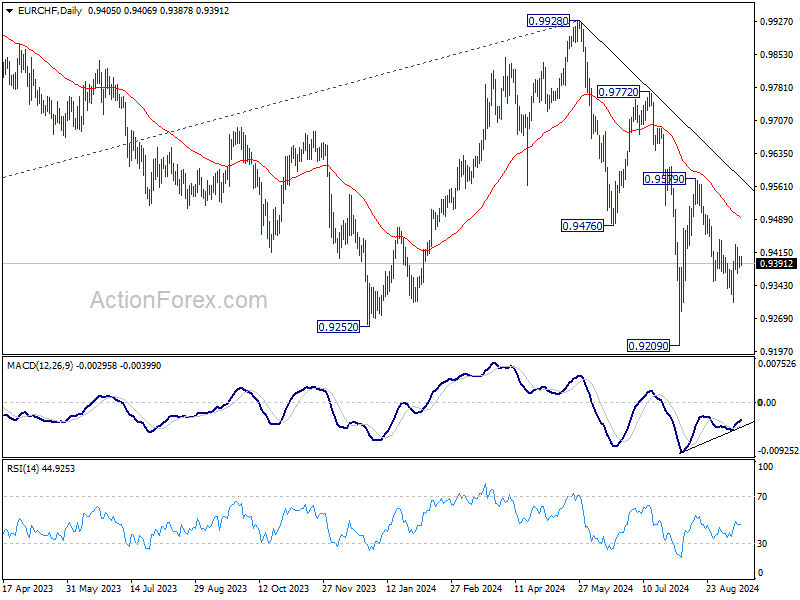
In the bigger picture, medium term corrective pattern from 0.9407 (2022 low) might have completed with three waves to 0.9928. Decisive break of 0.9252 (2023 low) will confirm long term down trend resumption. Next target will be 61.8% projection of 1.1149 to 0.9407 from 0.9928 at 0.8851. For now, outlook will stay bearish as long as 0.9928 resistance holds, even in case of strong rebound.
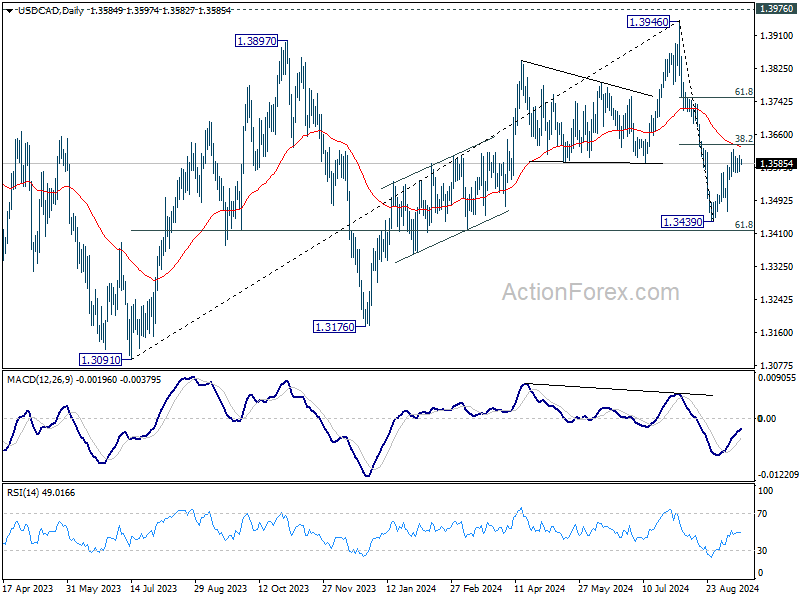
USD/CAD Daily Outlook
Daily Pivots: (S1) 1.3567; (P) 1.3587; (R1) 1.3607; More...
Intraday bias in USD/CAD remains neutral as sideway trading continues. On the downside, below 1.3545 minor support will suggest that recovery from 1.3439 has completed, turn bias to the downside for retesting this low. Nevertheless, decisive break of 38.2% retracement of 1.3946 to 1.3439 at 1.3633 would argue that the decline from 1.3946 has completed. Stronger rally would then be seen to 61.8% retracement at 1.3752 and above.
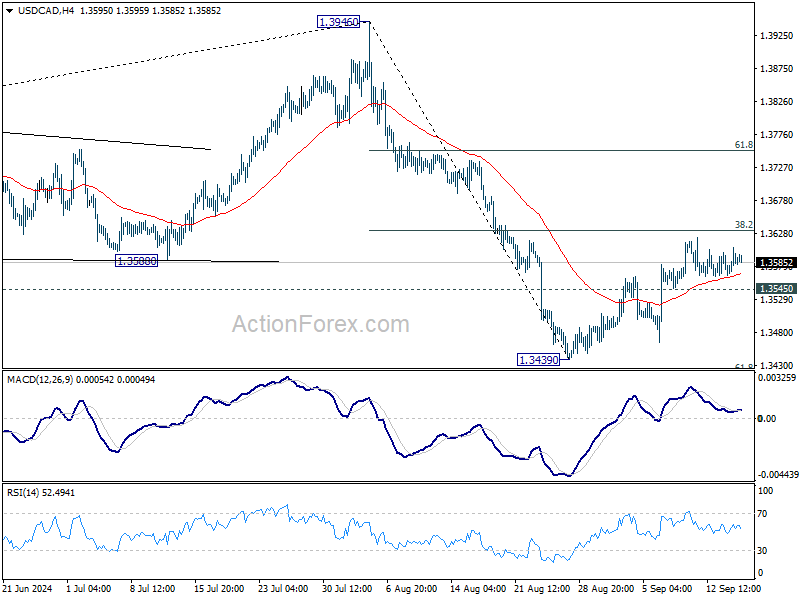
In the bigger picture, corrective pattern from 1.3976 (2022 high) is extending with another falling leg. While deeper decline could be seen, strong support should emerge above 1.2947 resistance turned support to bring rebound. Rise from 1.2005 (2021 low) is still in favor to resume at a later stage.