

Sample Category Title
US: Payrolls Remain Firm in April, Unemployment Rate Holds Steady at 4.3%
Nonfarm payrolls rose by 115k in April, down from March's gain of 185k but ahead of the consensus forecast calling for a smaller print of 65k. Revisions to the two prior months subtracted a total of 16k from the previously reported figures, with February revised lower (-156k from -133k) and March slightly higher (+185k from +178k).
- Smoothing through the volatility, nonfarm payrolls averaged 48k per-month over the last three months, up from the -39k averaged through the three months ending in December 2025.
Private payrolls rose 123k, following a stronger gain of 190k in March. Job gains were concentrated in health care & social assistance (+53.9k), transportation & warehousing (+30.3k) and retail trade (+21.8k). Federal government hiring (-9k) continued to decline.
In the household survey, the unemployment rate was unchanged at 4.3% as the number of unemployed were little changed amid a small decline in the labor force (-92k). The labor force participation rate fell to 61.8% (from 61.9% the month prior), which is its lowest level since late-2021.
Average hourly earnings (AHE) rose a "soft" 0.2% month-on-month (m/m), matching March's gain. On a twelve-month basis, AHE ticked up to 3.6% (from 3.4% the month prior).
Key Implications
Payrolls were volatile through Q1, largely due to temporary factors like inclement weather and a healthcare strike in California. With those effects now in the rearview mirror, April provided as the first "clean" read on hiring for 2026 and the underlying details were reasonably constructive, despite the recent surge in energy prices. Job growth appears to have picked up from its anemic pace at the end of last year and is now running reasonably close to its breakeven rate – holding the unemployment rate steady.
It's too soon to say whether the labor market is regaining momentum, but this morning's report alongside other recent data points including initial jobless claims and job posting data by Indeed certainly help to assuage any fears that conditions have continued to cool. From the Fed's perspective, this means they can sit tight to better assess the extent to which higher energy prices bleed through to core measures of inflation in the months ahead. Yields were relatively muted post-payrolls, with Fed futures priced for the FOMC to remain on hold into next year.
Canada’s Unemployment Rate Rises as More People Look for Work
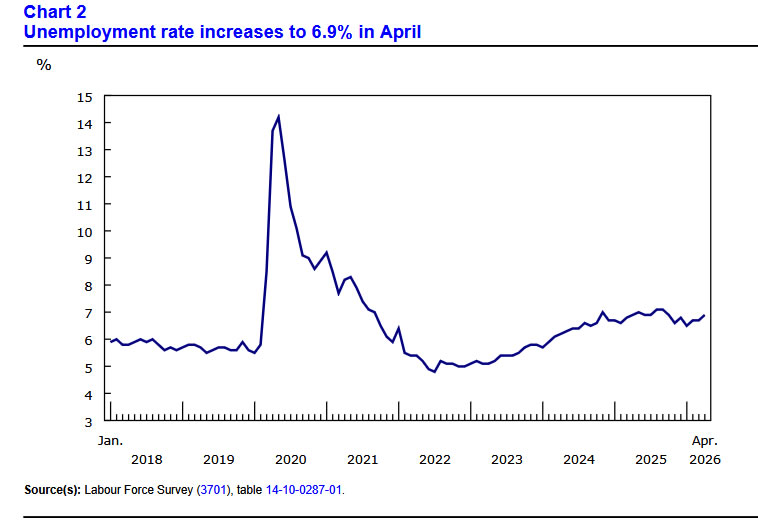
Canada’s economy lost 18k jobs in April (-0.1% m/m), undershooting consensus expectations for a 10k gain. Employment is now virtually unchanged following February’s sharp decline. Full‑time employment fell by 47k, while the number of private‑sector workers was essentially flat (-2.6k).
The unemployment rate rose to 6.9% from 6.7%, as labour supply increased faster than job creation. The number of people in the labour force grew by 33.5k, pushing the labour force participation rate up 0.1 percentage point to 65.0%. The monthly layoff rate (0.6%) remained in-line with the pre-pandemic average.
Job losses were concentrated in services-producing industries, led by information, culture and recreation (-25k), construction (-16k), and other services (-13k). These declines were partially offset by gains in business, building and other support services (+22k), health care and social assistance (+18k), and accommodation and food services (+13k).
Average hourly wages were up 4.5% year-on-year (y/y) down from 4.7% in March. Importantly, the elevated wage gain reflects compositional shifts, with fewer employees with shorter job tenures.
Key Implications
A modest drop in employment coupled with a sizeable jump in the labour force drove up the unemployment rate two ticks this month. Although the monthly data reflect a high degree of variability, the persistently elevated unemployment rate is reflective of a job market that continues to struggle to absorb labour supply. In the coming months we expect the labour force increases to lose steam and help cap further rises in the unemployment rate.
The economic outlook is far from rosy and the ongoing slack in the labour market is reflective of an economy that is still struggling to gain traction. However, with the labour market still soft, the ability of firms to pass on cost increases from the inflation shock to consumers is more limited. This is a key factor that underpins our view that if the sharp rise in oil prices begins to reverse in the coming weeks, the Bank of Canada will be able to stay on hold this year.
EUR/USD Mid-Day Outlook
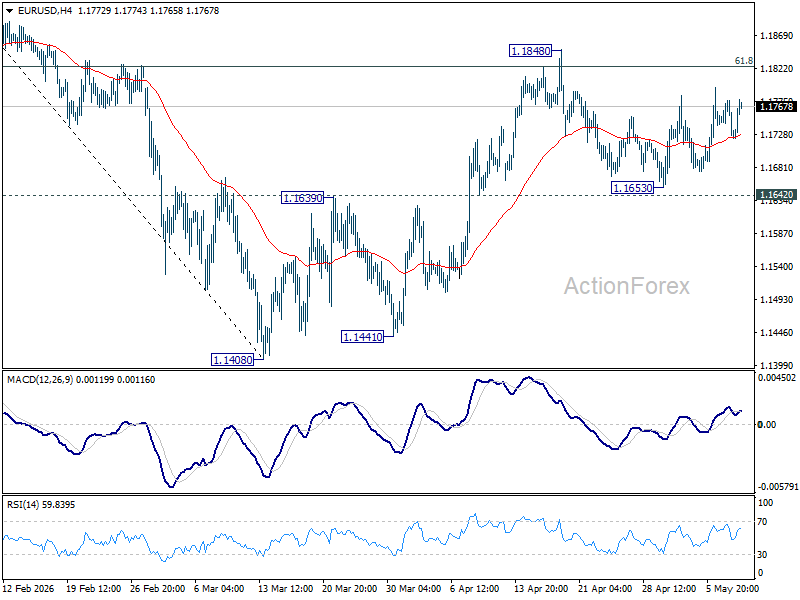
Daily Pivots: (S1) 1.1705; (P) 1.1743; (R1) 1.1762; More….
EUR/USD is still bounded in range trading and intraday bias remains neutral. With 1.1642 support intact, rise from 1.1408 is expected to continue. On the upside, firm break of 1.1848 will target 1.2081 high next. However, firm break of 1.1662 support will indicate the the rebound from 1.1408 has completed, and bring deeper decline back towards this low instead.
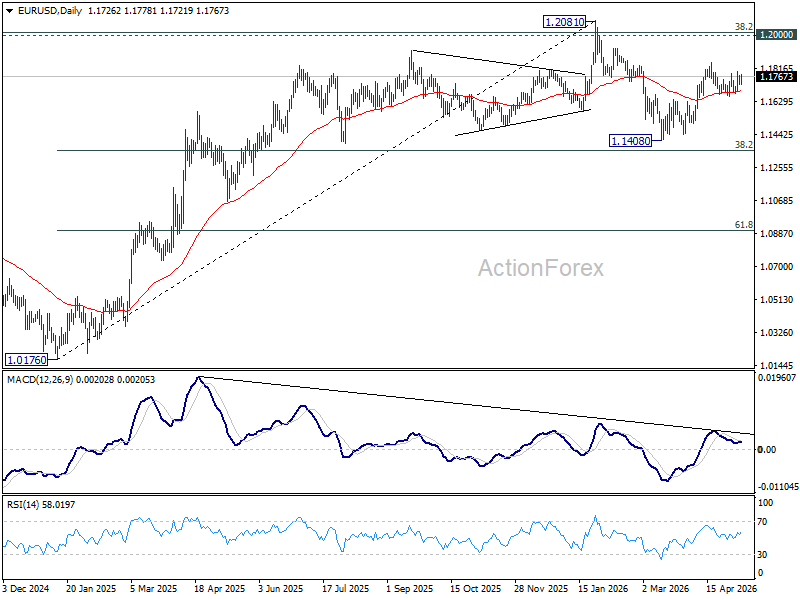
In the bigger picture, the strong support from 38.2% retracement of 1.0176 to 1.2081 at 1.1353 suggests that the pullback from 1.2081 is more likely a corrective move. Strong support was also found in 55 W EMA (now at 1.1537). Focus is back on 1.2 key cluster resistance level. Decisive break there will carry long term bullish implications. Nevertheless, break of 1.1408 support will revive the case of medium term bearish trend reversal.
USD/CHF Mid-Day Outlook
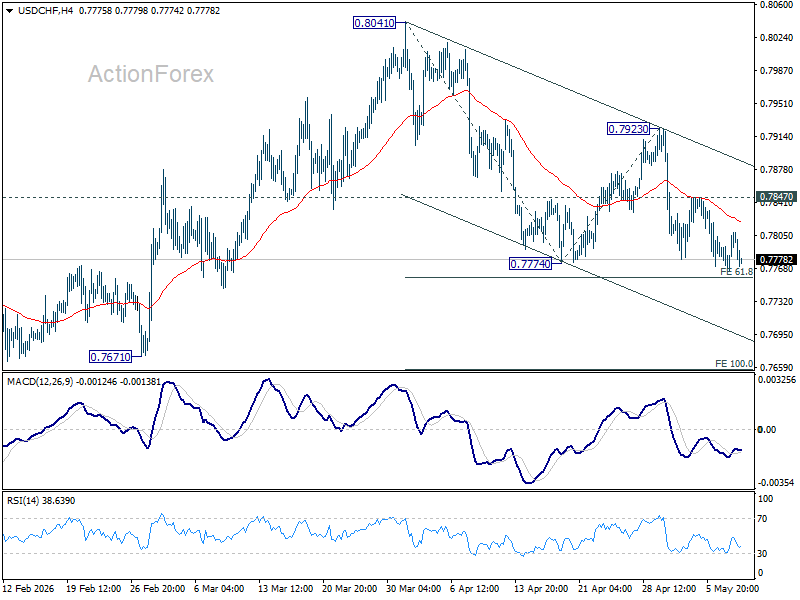
Daily Pivots: (S1) 0.7778; (P) 0.7793; (R1) 0.7822; More….
Intraday bias in USD/CHF remains mildly on the downside at this point. Decisive break of 61.8% projection of 0.8041 to 0.7774 from 0.7923 at 0.7758 will extend the fall from 0.8041 to 100% projection at 0.7656. On the upside, above 0.7847 minor resistance will turn bias neutral again.
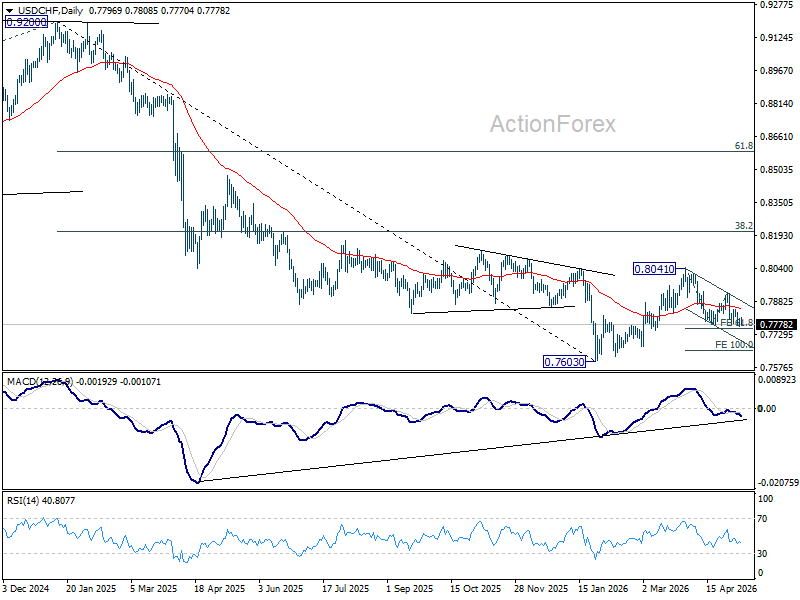
In the bigger picture, rebound from 0.7603 medium term bottom is seen as correcting the fall from 0.9200 only. Rejection by 55 W EMA (now at 0.8042) will affirm this bearish case, and setup down trend resumption to 100% projection of 1.0146 (2022 high) to 0.8332 from 0.9200 at 0.7382 at a later stage. Though, sustained break of 55 W EMA will suggest that it's probably correcting the larger scale down trend from 1.0146 (2022 high).
USD/JPY Mid-Day Outlook
Daily Pivots: (S1) 156.32; (P) 156.64; (R1) 157.26; More...
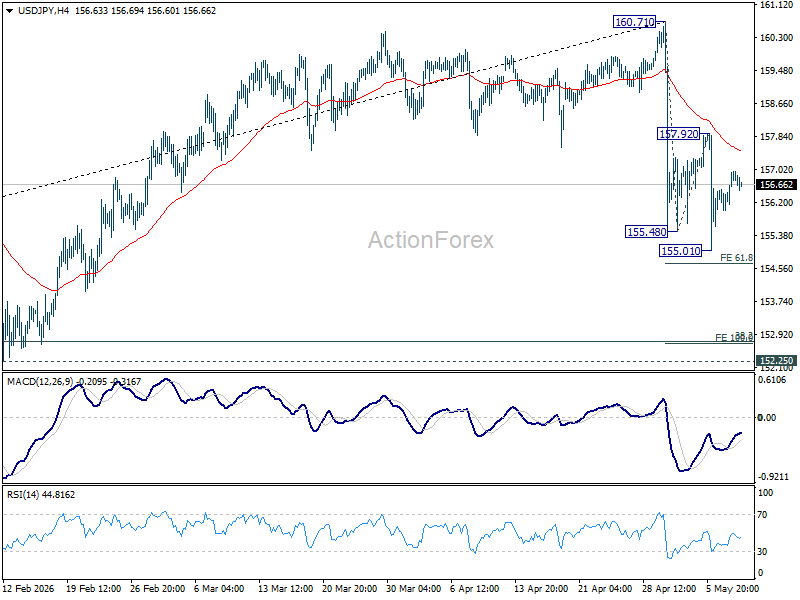
Range trading continues in USD/JPY and intraday bias stays neutral. Risk will stay on the downside as long as 157.92 resistance holds. Below 155.01 will resume the fall from 160.71 to 61.8% projection of 160.71 to 155.48 from 157.92 at 154.68. Firm break there will target 100% projection at 152.69. That would be close to key 152.25 cluster support (38.2% retracement of 139.87 to 160.71 at 152.74). However, firm break of 157.92 will turn bias back to the upside for stronger rebound.
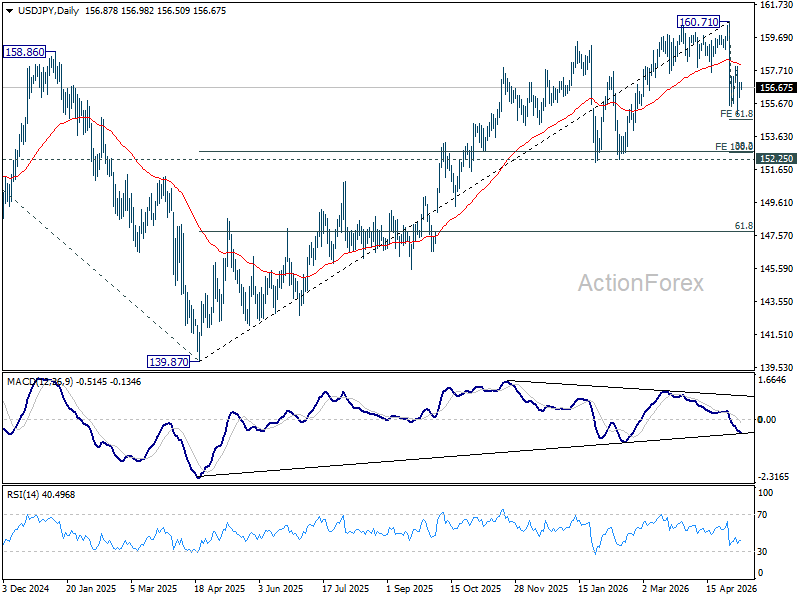
In the bigger picture, for now, corrective pattern from 161.94 (2024 high) is still seen as completed at 139.87. Rise from there is seen as resuming the long term up trend. So, break of 161.94 is expected at a later stage to resume the long term up trend. However, sustained break of 55 W EMA (now at 154.01) will dampen this view and bring deeper fall back towards 139.87 to extend the pattern from 161.94.
GBP/USD Mid-Day Outlook
Daily Pivots: (S1) 1.3522; (P) 1.3577; (R1) 1.3607; More...
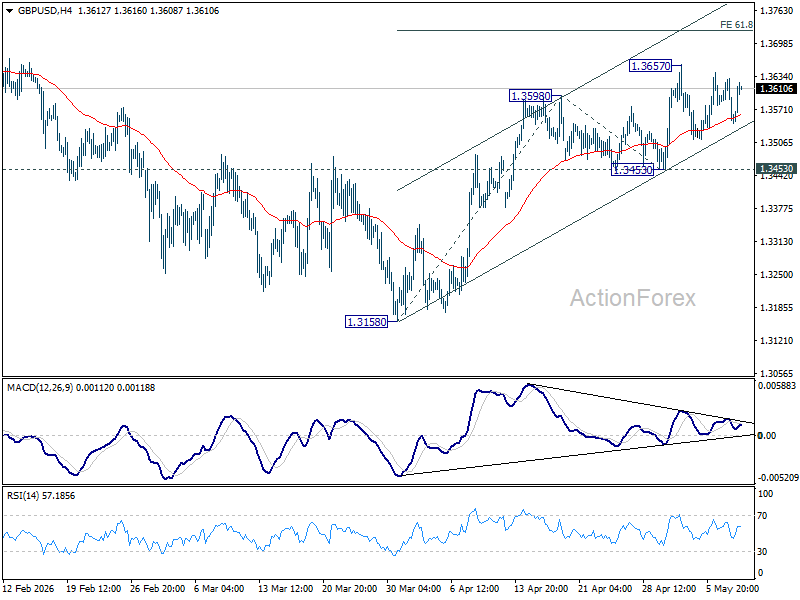
GBP/USD rebounded after drawing support from 55 4H EMA, but stays below 1.3657 resistance. Intraday bias remains neutral and more consolidations could still be seen. Further rise is expected with 1.3453 support intact. On the upside, above 1.3657 will target 61.8% projection of 1.3158 to 1.3598 from 1.3453 at 1.3725 first. Firm break there will target a retest on 1.3867 high. However, break of 1.3453 will turn bias back to the downside for 1.3158 support instead.
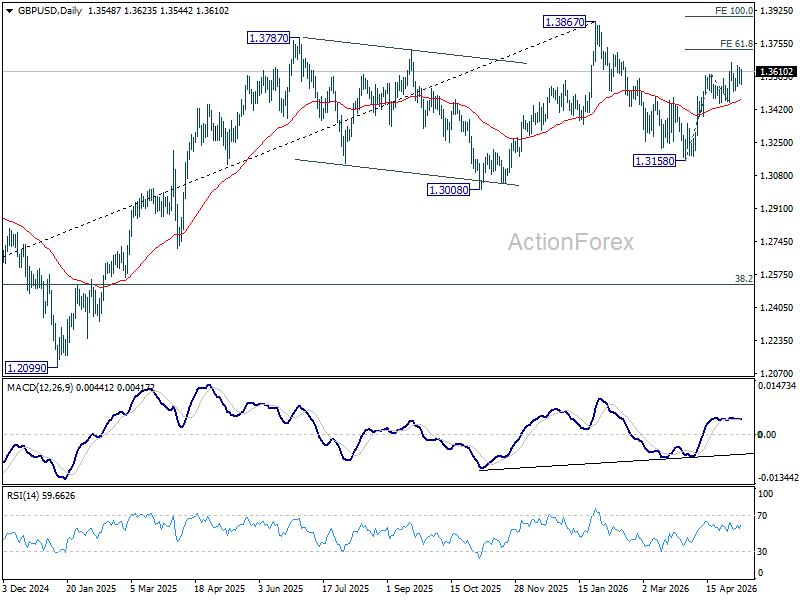
In the bigger picture, current development suggests that price actions from 1.3867 are merely a corrective pattern within the broader up trend from 1.0351 (2022 low). With 1.3008 support intact, medium term bullishness is maintained and break of 1.3867 is in favor for a later stage, towards 1.4248 key resistance (2021 high).
Markets Embrace Strong US Employment Report, but Iran Remains the Bigger Risk
The US jobs report gave stock markets exactly what they wanted — proof the economy is still holding up without reigniting fears of runaway inflation. Stocks liked it, the Fed will likely like it, and recession fears eased further. Yet despite the upbeat reaction, traders still seem unwilling to fully commit because the biggest market risk remains geopolitical, not economic.
Dollar slipped broadly in early US trading after the payrolls release, though the move lacked strong follow-through against most major currencies. That hesitation says a lot about the current market environment. Even after a stronger-than-expected jobs report, investors are still treating developments surrounding the US-Iran conflict as the dominant macro driver.
The April payrolls report itself was clearly solid. Non-Farm Payrolls rose by 115k, almost double market expectations, while March’s already strong reading was revised higher to 185k. The unemployment rate held steady at 4.3%, suggesting the labor market continues showing resilience despite geopolitical uncertainty and slowing global growth concerns.
At the same time, the inflation side of the report stayed relatively calm. Average hourly earnings increased just 0.2% mom, below expectations, even though annual wage growth ticked up modestly to 3.6% yoy. For markets, that combination created the ideal “Goldilocks” outcome: strong enough to reassure investors the economy is not sliding toward recession, but soft enough to avoid reviving fears of a more hawkish Federal Reserve.
That dynamic helped reinforce the powerful risk-on environment that has driven S&P 500 and NASDAQ toward repeated record highs in recent sessions. Investors could believe the Fed can comfortably stay on hold for the rest of the year without needing to either rescue the economy or aggressively tighten policy further. Market pricing now shows more than 70% probability that rates remain unchanged through year-end.
Meanwhile, Canadian Dollar became the major underperformer after Canada’s labor market delivered a sharp negative surprise. Employment fell by -17.7k in April instead of posting expected gains, while unemployment rose to 6.9%. The report reinforced concerns that Canada’s economy is losing momentum more quickly than the US.
While BoC Governor Tiff Macklem has warned that persistent inflation could eventually require multiple rate hikes, deteriorating employment conditions make it increasingly difficult for the central bank to realistically follow through on that threat.
Still, even the strong US payrolls report failed to fully dominate market attention. Markets are now turning back toward geopolitics as the dominant macro driver. US Secretary of State Marco Rubio said Washington expects a response from Tehran later Friday regarding the proposed agreement aimed at ending the conflict. “We’ll see what the response entails. The hope is it’s something that can put us into a serious process in negotiation,” Rubio said.
For now, the broader market tone remains cautiously constructive. Kiwi leads currency gains for the week, followed by Aussie and Swiss Franc, while Loonie, Dollar, and Yen underperform. But despite the encouraging payrolls report, investors appear unwilling to fully extend risk positioning until there is greater clarity on whether the fragile path toward a US-Iran agreement can hold.
US Payrolls Beat Expectations With 115k Growth, But Wage Growth Stays Calm
US payrolls surprised to the upside in April, reinforcing the view that the labor market remains resilient despite slowing growth concerns. At the same time, softer monthly wage growth helped keep the broader “Goldilocks” soft-landing narrative intact. Read More.
Canada Employment Falls -17.7k as Unemployment Rises to 6.9%
Canada’s labor market weakened in April. Employment unexpectedly fell, full-time jobs dropped heavily, and unemployment climbed to 6.9%, adding to concerns about slowing economic momentum. Read More.
Japan Real Wage Growth Extends Gains Despite Slower Nominal Pay Growth
Japan’s real wages rose for a third consecutive month in March, supported by easing inflation and the strongest stretch of base pay growth in more than three decades. Read More.
Japan PMI Services Finalized at 51.0 as Middle East War Fuels Cost Pressures
Japan’s services sector lost momentum in April just as inflation pressures intensified sharply. Rising energy costs linked to the Middle East conflict pushed input prices to a three-and-a-half-year high and selling prices to their steepest increase in nearly two decades. Read More.
GBP/USD Mid-Day Outlook
Daily Pivots: (S1) 1.3522; (P) 1.3577; (R1) 1.3607; More...
GBP/USD rebounded after drawing support from 55 4H EMA, but stays below 1.3657 resistance. Intraday bias remains neutral and more consolidations could still be seen. Further rise is expected with 1.3453 support intact. On the upside, above 1.3657 will target 61.8% projection of 1.3158 to 1.3598 from 1.3453 at 1.3725 first. Firm break there will target a retest on 1.3867 high. However, break of 1.3453 will turn bias back to the downside for 1.3158 support instead.
In the bigger picture, current development suggests that price actions from 1.3867 are merely a corrective pattern within the broader up trend from 1.0351 (2022 low). With 1.3008 support intact, medium term bullishness is maintained and break of 1.3867 is in favor for a later stage, towards 1.4248 key resistance (2021 high).
Canada Employment Falls -17.7k as Unemployment Rises to 6.9%
Canada’s labor market weakened notably in April as employment unexpectedly declined and the unemployment rate climbed to its highest level in months. Total employment fell by -17.7k during the month, sharply missing expectations for a modest gain of 5.1k. The weakness was concentrated in full-time positions, which dropped by -47k, while part-time employment rose by 29k.
Unemployment rate increased from 6.7% to 6.9%, above market expectations, while employment rate slipped to 60.5%. At the same time, participation rate edged higher to 65.0%, suggesting more people entered the labor force despite deteriorating hiring conditions.
Wage growth remained relatively elevated but showed signs of gradual moderation. Average hourly wages rose 4.5% yoy in April, slowing slightly from March’s 4.7% increase.
| Indicator | Previous | Latest | Expectation |
|---|---|---|---|
| Employment Change | +14.1K | -17.7k | +5.1k |
| Unemployment Rate | 6.7% | 6.9% | 6.7% |
| Employment Rate | 60.6% | 60.5% | — |
| Participation Rate | 64.9% | 65.0% | — |
US Payrolls Beat Expectations With 115k Growth, But Wage Growth Stays Calm
US job growth slowed in April but remained significantly stronger than expectes. Non-Farm Payrolls increased by 115k during the month, comfortably above consensus forecasts near 60k, while March payrolls were revised higher from 178k to 185k.
The unemployment rate held steady at 4.3% as expected, although the labor force participation rate edged lower from 61.9% to 61.8%. The labor market continues to show resilience despite elevated interest rates and heightened geopolitical uncertainty.
Wage growth was relatively contained. Average hourly earnings rose 0.2% mom for a second consecutive month, undershooting expectations for a 0.3% increase. On an annual basis, wage growth ticked up from 3.4% yoy to 3.6% yoy.
| Indicator | Previous | Latest | Expectation |
|---|---|---|---|
| Non-Farm Payrolls | 185k | 115k | 60k |
| Unemployment Rate | 4.3% | 4.3% | 4.3% |
| Participation Rate | 61.9% | 61.8% | — |
| Avg Hourly Earnings (MoM) | +0.2% | +0.2% | +0.3% |
| Avg Hourly Earnings (YoY) | +3.4% | +3.6% | +3.8% |
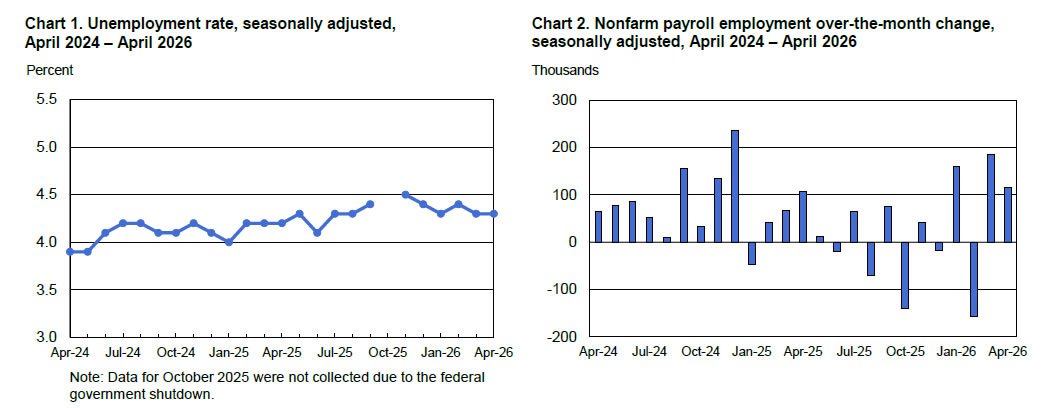
Chart Alert: Nasdaq 100 Bulls Still in Control Above 28,280 Key Support Amid US-Iran Tensions
Key takeaways
- Nasdaq 100 remains in a bullish structure despite short-term volatility driven by US–Iran geopolitical tensions and profit-taking, with price action stabilising above key support at 28,280.
- Market sentiment was briefly pressured by conflict-related headlines, but losses were largely recovered as ceasefire stability expectations improved and risk appetite returned.
- Market breadth is healthy but not euphoric, with broad participation across components and technical indicators supporting near-term upside continuation.
The US stock market saw profit-taking on Thursday, 7 May 2026, as traders grew increasingly concerned over the fragility of the month-long US-Iran ceasefire after both sides exchanged fire.
Market sentiment was further unsettled by uncertainty surrounding Washington’s latest proposal to Iran to reopen the Strait of Hormuz, which Tehran has yet to respond to.
The leading Nasdaq 100 dropped by 1.3% intraday from its all-time intraday high of 28,825, but trimmed its losses to end Thursday’s US session with a marginal loss of only 0.1% and underperformed against other US stock indices; S&P 500 (-0.4%), Dow Jones Industrial Average (-0.6%), and small-cap Russell 2000 (-1.6%).
In today's (Friday, 8 May 2026), the Nasdaq 100 E-min futures recovered by 0.5% at this time of writing and almost recovered Thursday’s US session losses, reinforced by US President Trump's remarks that stated the ceasefire agreement “remains intact”.
Aside from this piece of “Trump’s positive news flow”, several technical elements are also advocating for another potential round of fresh short-term bullish impulsive up move sequence for the Nasdaq 100.
Let’s decipher them.
Nasdaq 100’s Market Breadth Remains Healthy, Not Euphoric
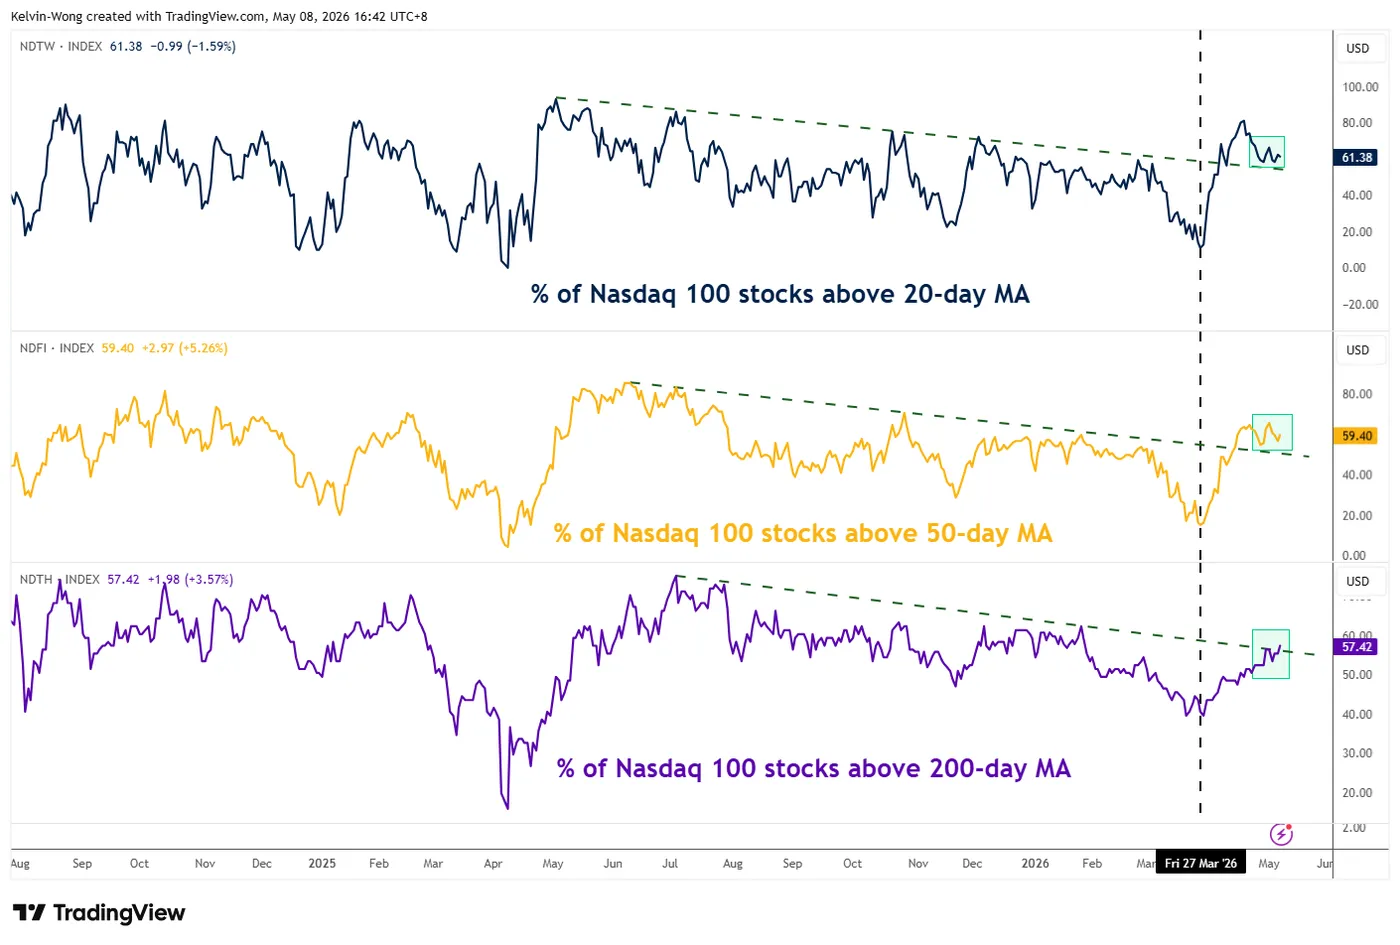
Fig. 1: Nasdaq 100 component stocks above 20-day, 50-day & 200-day moving averages as of 7 May 2026 (Source: TradingView).
Even though in the past four weeks, the performance of the Nasdaq 100 has been primarily driven by several AI-related semiconductors and chip stocks such as Intel (+111%), SanDisk (+87%), and Advanced Micro Devices (+87%), the percentage of Nasdaq 100 component stocks trading above their respective 20-day and 50-day moving averages is steady at 61% and 59%, not yet at euphoric levels of 80%-90%.
In addition, the percentage of Nasdaq 100 component stocks trading above the key 200-day moving averages has increased steadily from 47% on 15 April 2026 to 57% as of Thursday, 7 May 2026 (below euphoric levels of 80%-90%), which indicates that a broader set of Nasdaq 100 is taking part in this ongoing rally since the end of March 2026 (see Fig. 1).
Let's now focus on the short-term trajectory (1 to 3 days) of the US Nasdaq 100 CFD index (a proxy of the Nasdaq 100 E-mini futures).
Nasdaq 100 – Looking to Break Above 28,890 with Bullish Momentum
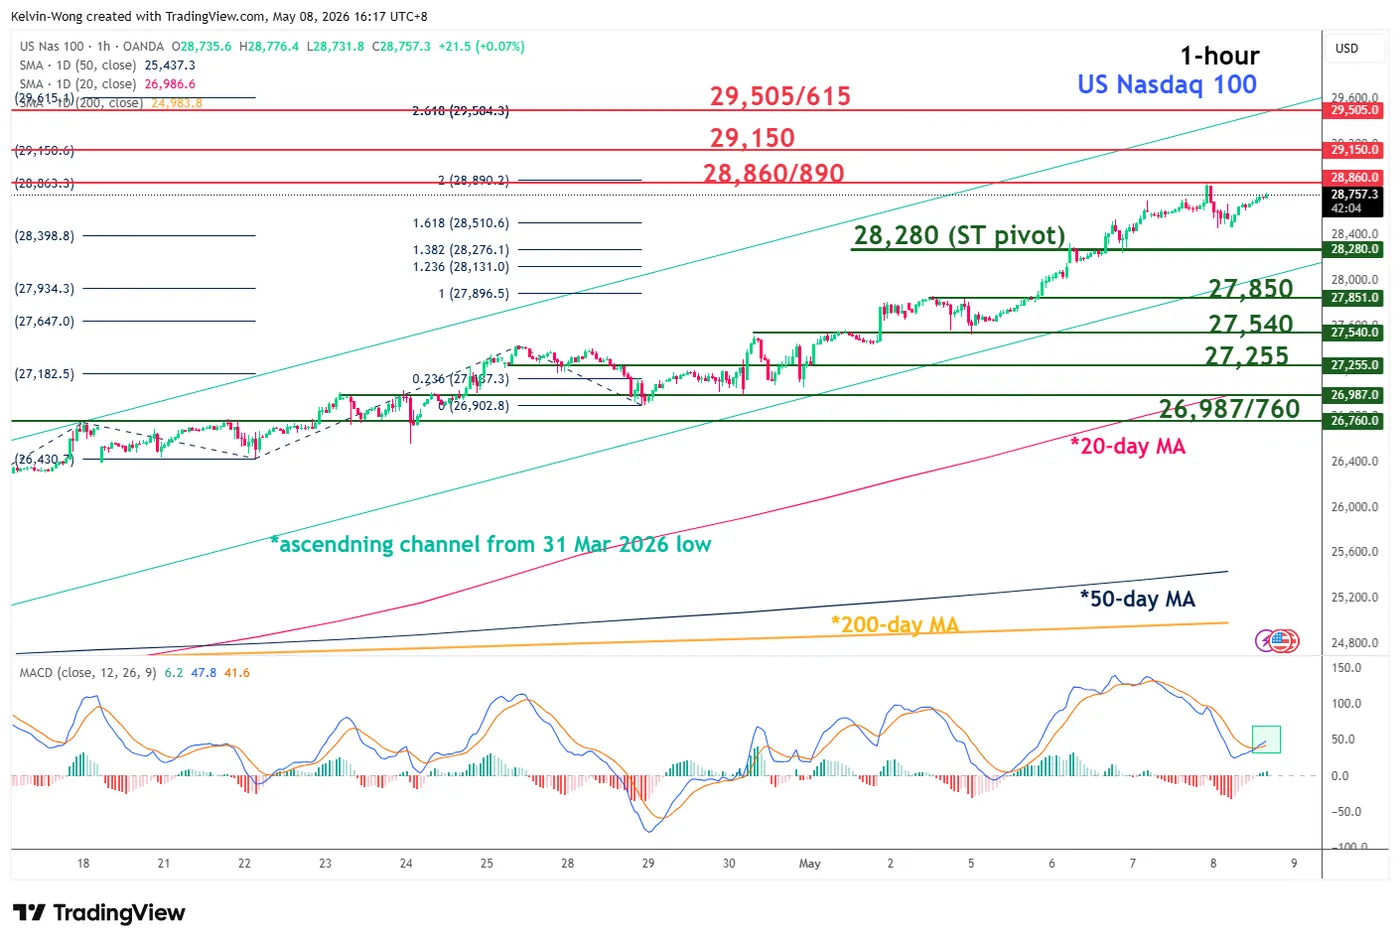
Fig. 2: US Nasdaq 100 CFD index minor trend as of 8 May 2026 (Source: TradingView).
Trend bias: Bullish above 28,280 short-term pivotal support within an uptrend phase (see Fig. 2).
Resistances: 28,860/890, 29,150, and 29,505/615
Next supports: 27,850, 27,540, and 27,255
Key Elements to Support the Near-Term Bullish Bias on the Nasdaq 100
- Price actions continue to oscillate within a medium-term ascending channel from the 31 March 2026 low.
- Current price actions of the Nasdaq 100 CFD index are trading at the upper half of the ascending channel, with the upper boundary of the channel coming in at around 29,505.
- The hourly MACD trend indicator has just flashed out a bullish crossover condition above its centreline.