Sample Category Title
AUD/USD Outlook: Keeps Firm Tone Ahead of US Inflation Data
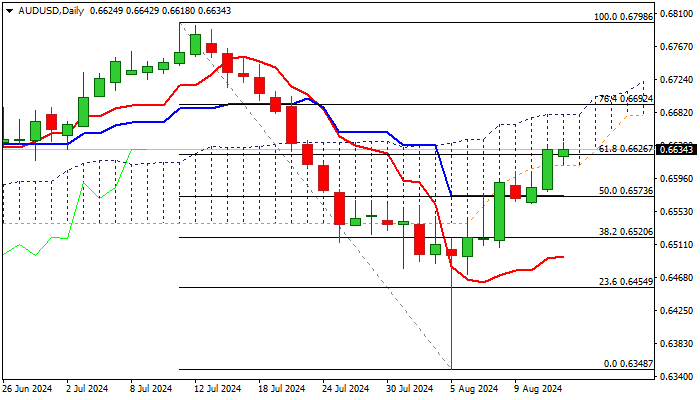
AUDUSD remains constructive and consolidating Tuesday’s 0.80% advance, as this morning’s RBNZ rate cut by 25 basis points negatively impacted Aussie dollar, but dips were limited, due to strong near-term bullish sentiment on revived risk appetite.
Technical studies are bullish on daily chart (rising positive momentum / MA’s turning to bullish setup) with strong bullish signals generated on close above converged 100/200DMA and penetration and close within rising daily cloud.
On the other hand, overbought conditions may further weigh on bulls, as markets await release of key US inflation data.
AUDUSD would benefit if CPI numbers fall below expectations, with extension towards targets at 0.6680 (daily cloud top) and 0.6692 (Fibo 76.4% of 0.6798/0.6348) in bullish scenario.
Conversely, above expectations July CPI would deflate AUD and risk extension through initial supports at 0.6613/0.6596 zone (daily cloud base / converged 100/200DMA’s).
Res: 0.6642; 0.6680; 0.6692; 0.6714.
Sup: 0.6613; 0.6596; 0.6573; 0.6555.
USD/JPY Sees Retreat Amid US Dollar Weakness
USD/JPY has retreated from its peak this week, settling at 146.82. The yen gained some strength as the US dollar weakened following July's lacklustre US Producer Price Index (PPI) data. This report bolstered market expectations for a potential 50 basis point cut by the Federal Reserve at its upcoming September meeting.
The focus now shifts to the July US Consumer Price Index (CPI), due for release today. Market participants predict sharp reactions if the data is weaker than expected, reinforcing the case for further rate cuts.
Domestically, the Tankan report indicated a decline in business confidence in Japan in August, likely influenced by reduced demand from China and other external pressures. This decrease to 10 points from 11 reflects Japan's broader economic challenges.
Additionally, the Bank of Japan’s (BoJ) monetary policy outlook remains a critical focal point amid recent stock market volatility and decreased carry trade activities involving the yen. While a former BoJ official expressed doubts about the possibility of an interest rate increase this year due to financial market impacts, the broader market remains cautiously optimistic about future monetary tightening.
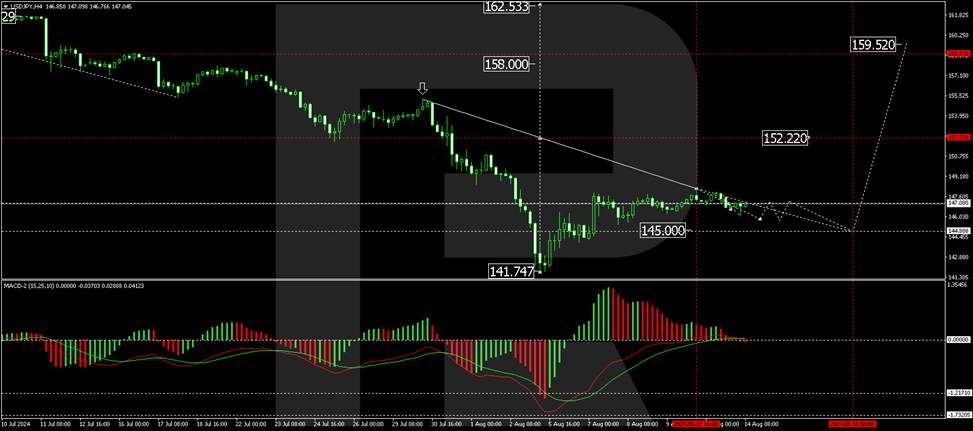
Technical Analysis of USD/JPY
The USD/JPY is currently consolidating around the 147.00 level. We anticipate a corrective decline to 145.00, followed by a potential rebound towards 152.22. A breach of this level could extend the upward trend towards 159.52. This bullish outlook is technically supported by the MACD indicator, which, although its signal line is below zero, suggests downward momentum.
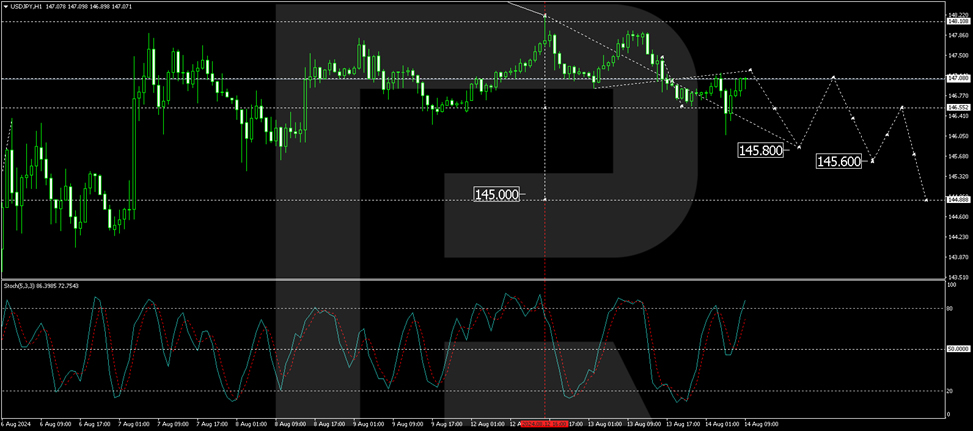
On the hourly chart, USD/JPY continues its corrective phase with a target set at 145.80. The pair is currently stabilising around 146.55, setting the stage for a potential decline to 145.60, and possibly extending the correction to 145.00. This scenario is corroborated by the Stochastic oscillator, with its signal line poised to move from below the 80 level to the 20 level, suggesting potential further declines.
GBP/USD Outlook: Cable Dips on Softer Than Expected UK Data, Focus Shifts on US Inflation
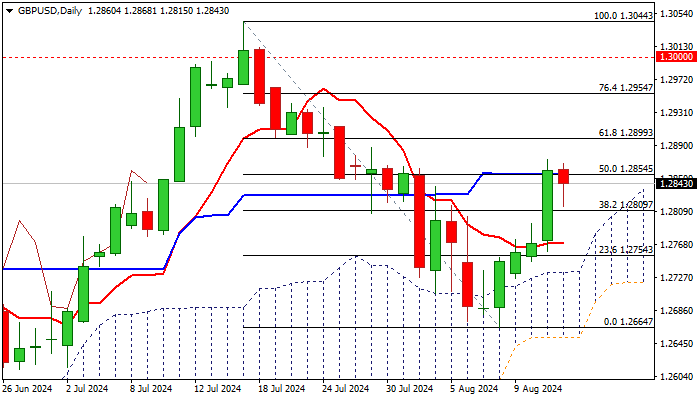
Cable fell 0.35% in immediate reaction to softer than expected UK inflation numbers in July.
Although the BoE expected inflationary pressure to rise after CPI stayed at 2% target in past two months, weaker than expected July figure adds to expectations for more rate cuts that deflated sterling.
Fresh dip emerged after repeated failure to clear Fibo resistance at 1.2854 (50% of 1.3044/1.2664, reinforced by daily Kijun-sen), although facing increased headwinds from supports at 1.2825/09 (20DMA / broken Fibo 38.2%).
Firm break of these levels to generate fresh bearish signal and open way for deeper pullback.
Overbought Stochastic and rising 14-d momentum still in the negative territory support the notion, though positive signals from MA’s in bullish setup and rising daily cloud underpinning the action, partially offset downside threats.
Look for stronger direction signals on breach of 1.2800 support zone (negative) or lift above upper pivots at 1.2854/70 (positive).
All eyes are on US July inflation report (due later today) which is expected to shed more light on Fed’s next steps on monetary policy.
Annualized CPI is expected to remain at 3% in July, while monthly inflation and core figure (excluding the most volatile components) I s expected to tick higher.
Markets may show stronger reaction on any divergence of July figure from forecasted levels, while less volatility could be expected if CPI comes overall in line with expectations.
Res: 1.2854; 1.2870; 1.2899; 1.2954.
Sup: 1.2826; 1.2809; 1.2768; 1.2734.
Eurozone industrial production falls -0.1% mom in Jun, EU down -0.1% mom
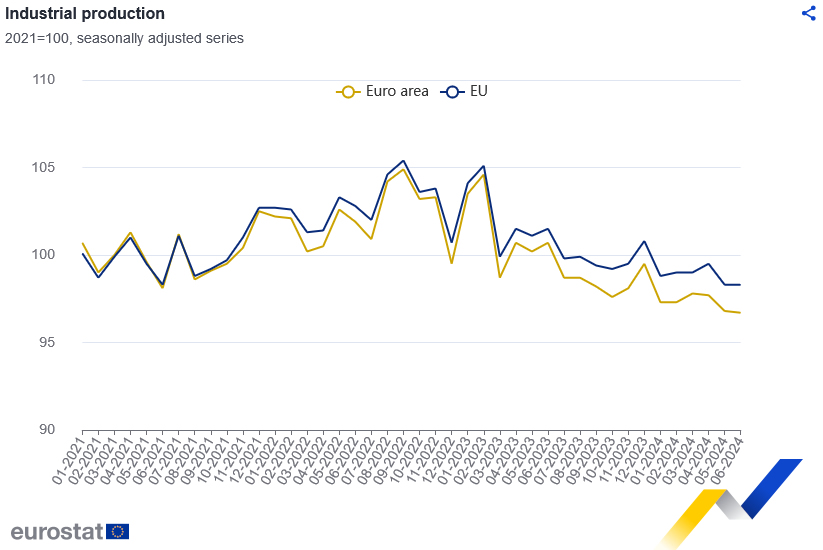
Eurozone industrial production fell -0.1% mom in June, much worse than expectation of 0.4% mom rise. Industrial production increased by 0.7% for intermediate goods, 1.9% for energy, 0.9% for capital goods, and 3.8% for durable consumer goods. Production decreased by -2.5% for non-durable consumer goods.
EU industrial production fell -0.1% mom. Among Member States for which data are available, the largest monthly decreases were recorded in Ireland (-7.8%), Belgium (-6.5%), Croatia and Portugal (both -3.7%). The highest increases were observed in Romania (+4.0%), Finland (+3.6%) and Slovakia (+2.1%).
NZDUSD Hits a Wall at 200-Day SMA
- NZDUSD had been in a recovery mode since early August
- But 200-day SMA rejects advance after dovish RBNZ meeting
- Oscillators deteriorate, yet remain neutral-to-positive
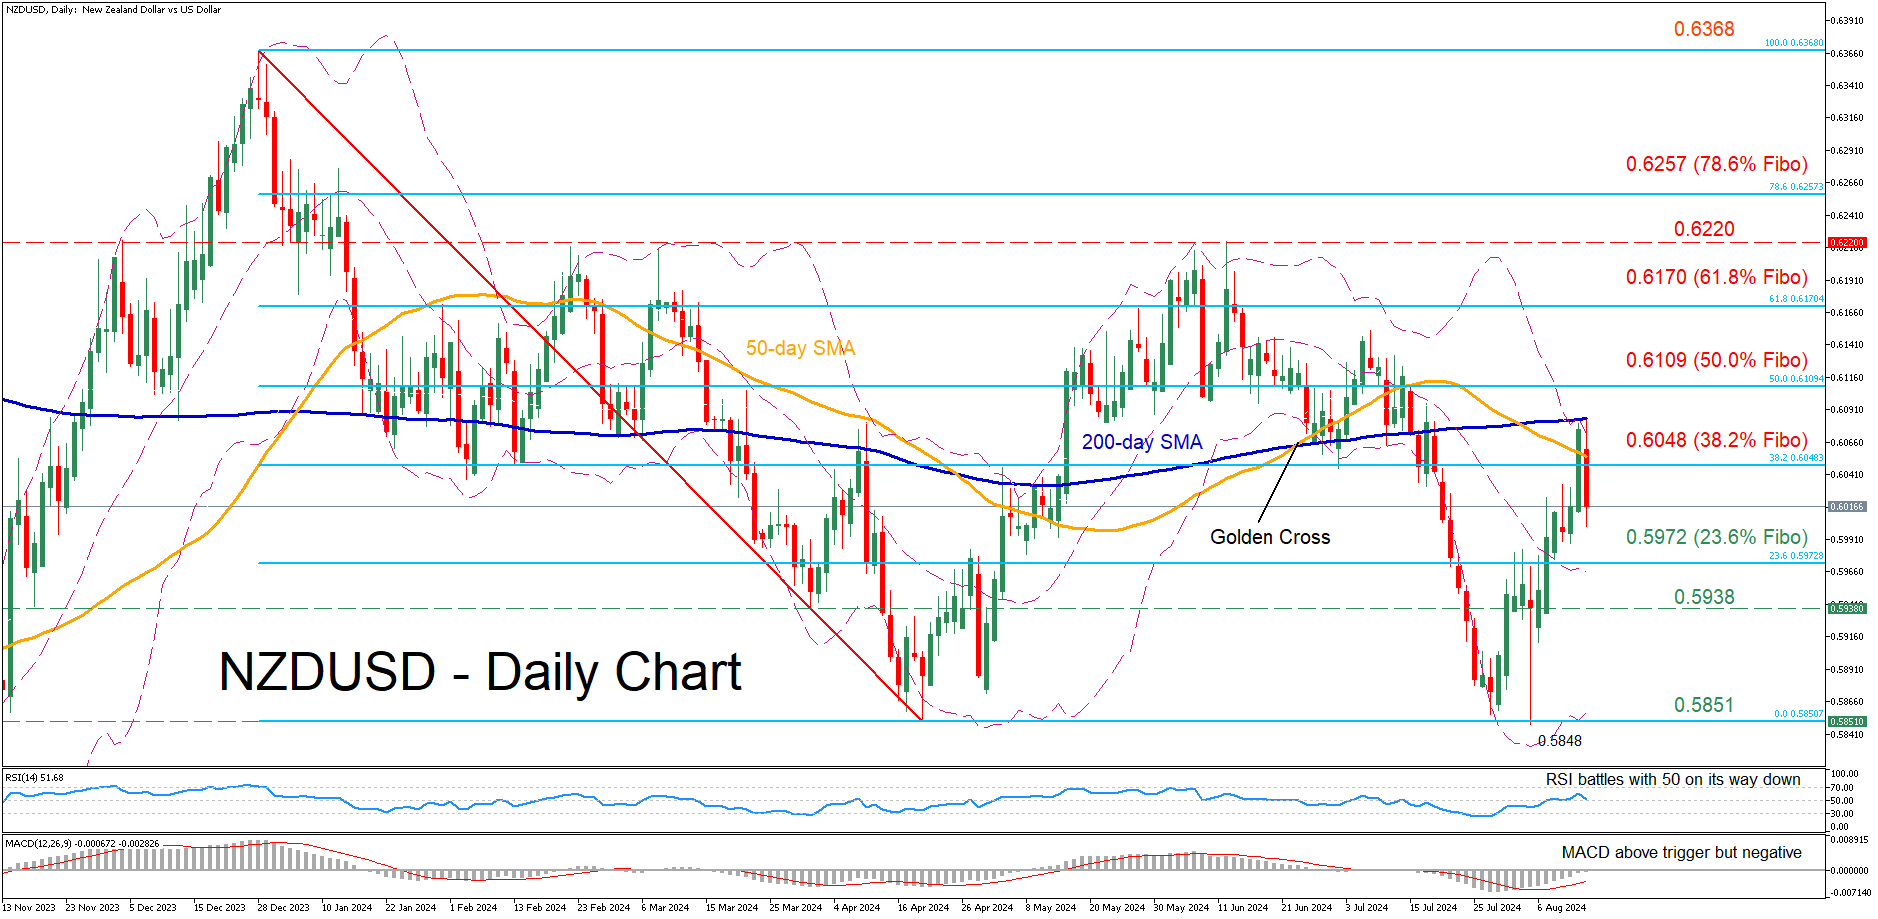
NZDUSD had been steadily regaining ground since the beginning of the month after finding its footing near the previous 2024 low of 0.5851 registered in April. However, the rebound paused at the 200-day simple moving average (SMA), with the bears getting aided by a dovish RBNZ rate decision on Tuesday.
Should the recent spike to the downside translate into a reversal, initial support could be found at 0.5972, which is the 23.6% Fibonacci retracement of the 0.6368-0.5851 downleg. Failing to halt there, the pair could descend towards the April support of 0.5938. A violation of that zone could pave the way for the 2024 bottom of 0.5848, a hurdle that held strong both in April and August.
Alternatively, bullish actions could send the price to test the 38.2% Fibo of 0.6048 ahead of its 50- and 200-day SMAs. Conquering the latter, the bulls may attack the 50.0% Fibo of 0.6109. Even higher, further advances could cease around the 61.8% Fibo of 0.6170.
In brief, the RBNZ cut rates by 25 basis points and communicated that they even considered a 50 bps reduction, applying the brakes on NZDUSD’s steep recovery. Hence, a decisive break above the 200-day SMA is needed for the bulls to regain confidence for a full-scale recovery.
USDJPY’s Sideways Trading Might End Abruptly
- USDJPY continues to hover around the 146 area
- Market participants are preparing for the US CPI release
- Momentum indicators remain mixed
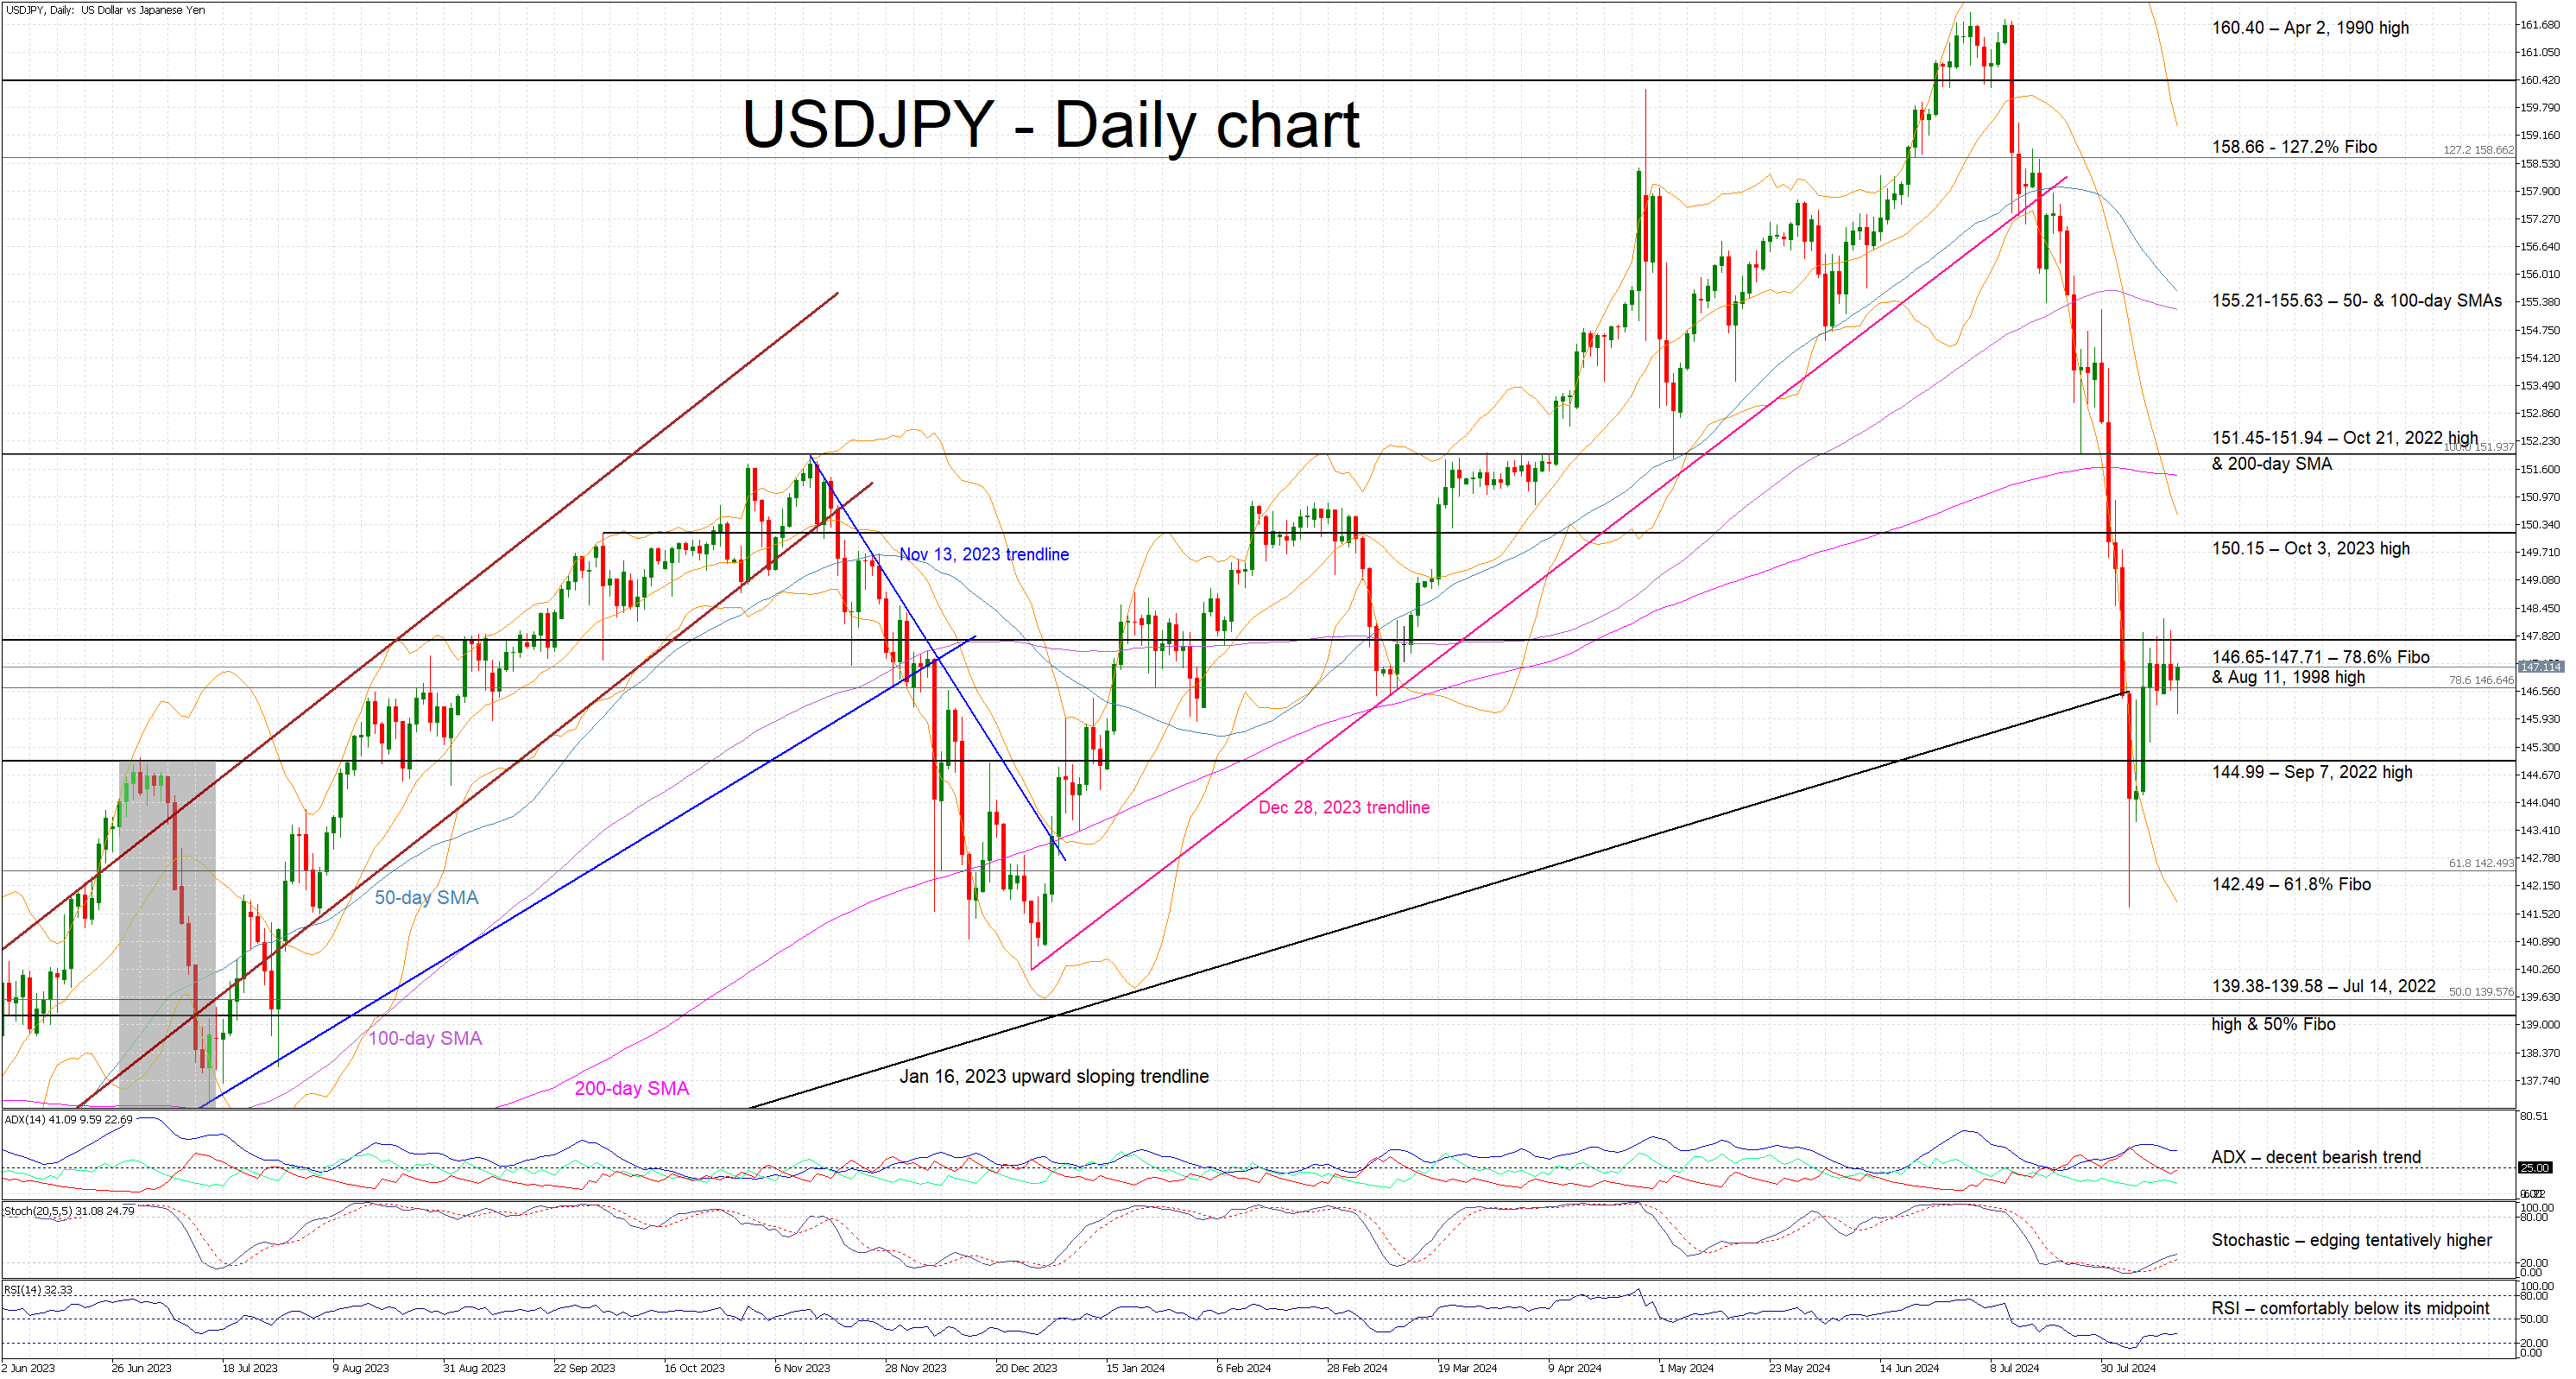
USDJPY continues to trade sideways, hovering around the 146.65-147.71 area for the fifth consecutive session. The bears are holding most of the gains of the sizeable correction from the early July high of 161.94, but have failed to take advantage of USD’s recent underperformance.
With traders digesting the overnight news of the Japanese PM Kichida’s resignation, the focus is gradually turning to today’s US CPI report. This data could play a key role in provoking a dovish shift from the Fed at the imminent Jackson Hole Symposium and thus confirm expectations for a rate cut in September.
In the meantime, the momentum indicators are mixed. Specifically, despite the recent small upleg in USDJPY, the RSI remains below its midpoint and thus reveals a decent bearish pressure in USDJPY. Interestingly, the Average Directional Movement Index (ADX) continues to hover above its 25 threshold, pointing to a muted bearish trend in USDJPY. More importantly, the stochastic oscillator has managed to climb above its overbought area (OB), but it has probably run out of fuel as it is now trading sideways.
Should the bears remain confident, they could firstly try to push USDJPY below the 146.65-147.17 area, which is populated but the 78.6% Fibonacci retracement of the October 21, 2022 - January 16, 2023 downtrend and the August 11, 1998 high. They could then stage another sell-off towards the 144.99 level and gradually prepare for a retest of the 61.8% Fibonacci retracement at 142.49.
On the flip side, the bulls are desperately looking for another small upleg above the 146.65-147.71 area. They could lead USDJPY higher towards the October 3, 2023 high at 150.15, with the next plausible target being the busy 151.45-151.94 area.
To sum up, the relative calmness in USDJPY might not last as the market is preparing for some key US data releases.
GBP/JPY Daily Outlook
Daily Pivots: (S1) 187.81; (P) 188.67; (R1) 189.74; More...
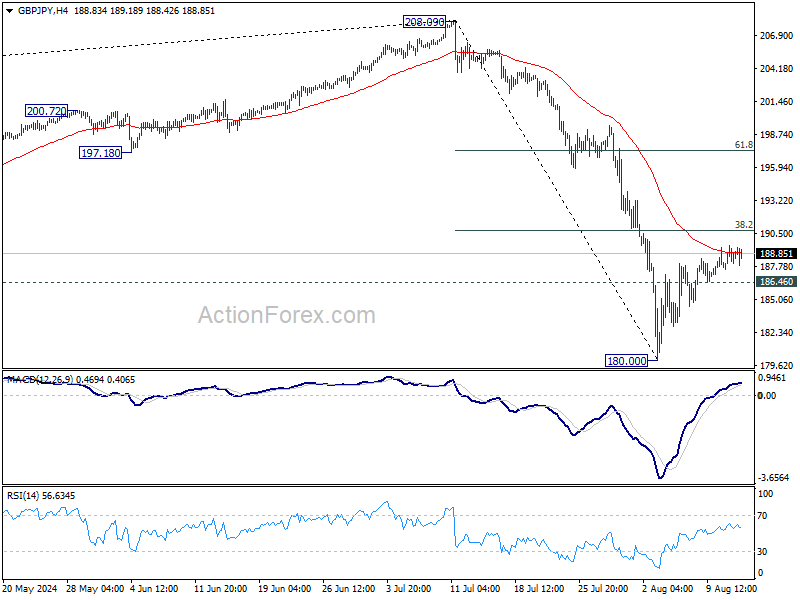
Intraday bias in GBP/JPY remains neutral for the moment. Outlook remains bearish with 38.2% retracement of 208.09 to 180.00 at 190.73 intact. On the downside, below 186.46 minor support will turn intraday bias back to the downside for retesting 180.00 low. Break there will resume the fall from 208.90 to 178.32 support next. However, firm break of 190.73 will extend the rebound to 61.8% retracement at 197.35, even as a corrective move.
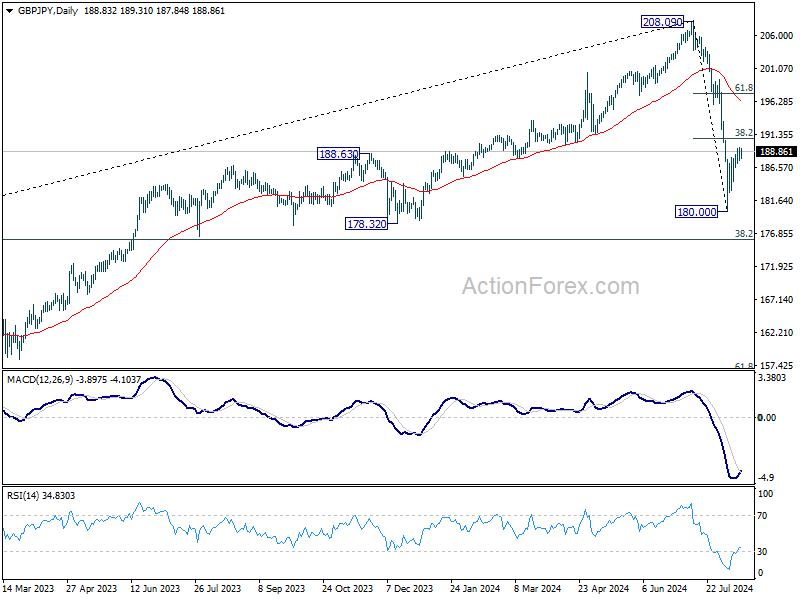
In the bigger picture, fall from 208.09 medium term top is seen as correcting the up trend from 123.94 (2020 low). Deeper decline is in favor as long as 55 W EMA (now at 189.18) holds. But strong support could emerge between 178.32 and 38.2% retracement of 123.94 to 208.09 at 175.94 to bring rebound. Meanwhile, sustained trading above 55 W EMA will suggest that the range for the medium term corrective pattern is already set.
EUR/JPY Daily Outlook
Daily Pivots: (S1) 160.79; (P) 161.29; (R1) 161.94; More...
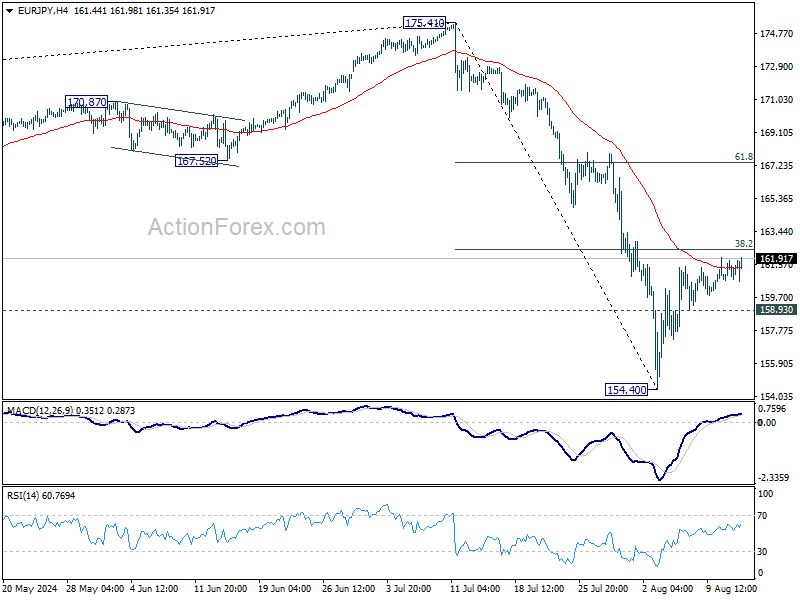
Intraday bias in EUR/JPY stays neutral at this point. Outlook stays bearish with 38.2% retracement of 175.41 to 154.40 at 162.42 intact. On the downside, below 157.71 minor support will bring retest of 154.40 first. Break there will resume the fall from 175.41 to 153.15 support next. However, sustained break of 162.42 will bring strong rise to 61.8% retracement at 167.38, even as a corrective move.
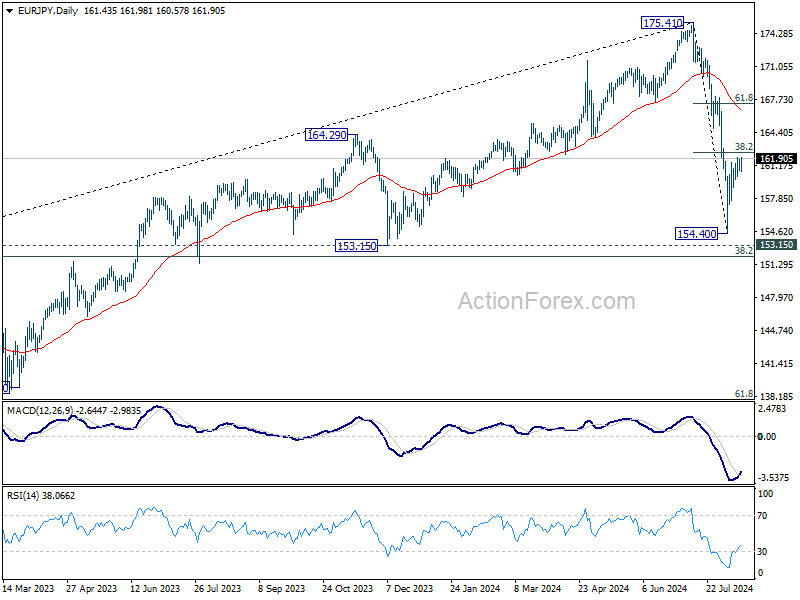
In the bigger picture, fall from 175.41 medium term top should be correcting the whole rise from 114.42 (2020 low). Deeper decline could be seen as long as 55 W EMA (now at 161.88) holds. But strong support should emerge between 153.15 and 38.2% retracement of 114.42 to 175.41 at 152.11 to bring rebound, at least on first attempt. Meanwhile, sustained trading above 55 W EMA will argue that the range of the medium term corrective pattern has already been set.
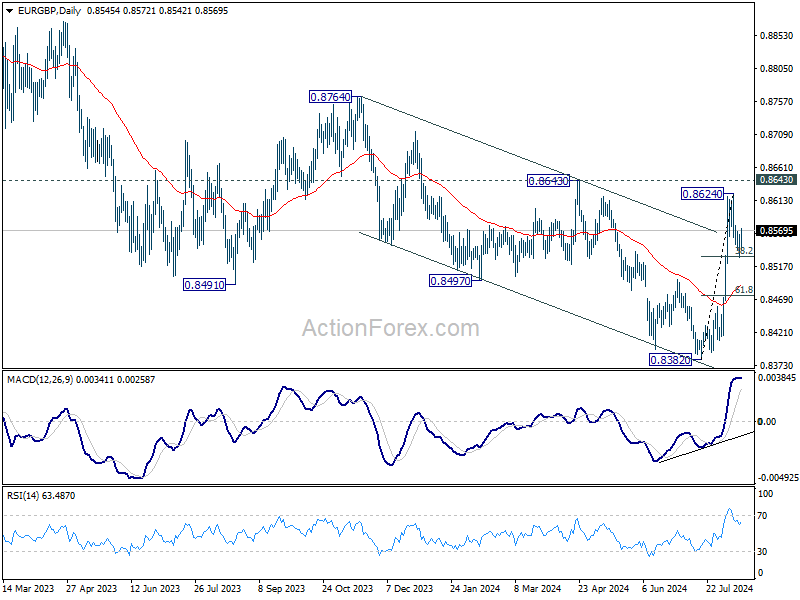
EUR/GBP Daily Outlook
Daily Pivots: (S1) 0.8529; (P) 0.8548; (R1) 0.8564; More....
EUR/GBP's break of 0.8567 suggests that corrective pullback from 0.8624 has completed at 0.8530, after hitting 38.2% retracement of 0.8382 to 0.8624 at 0.8532. Intraday bias is back on the upside for retesting 0.8624 first. Break there will resume the rally from 0.8382. However, decisive break of 0.8532 will bring deeper fall to 61.8% retracement at 0.8474.
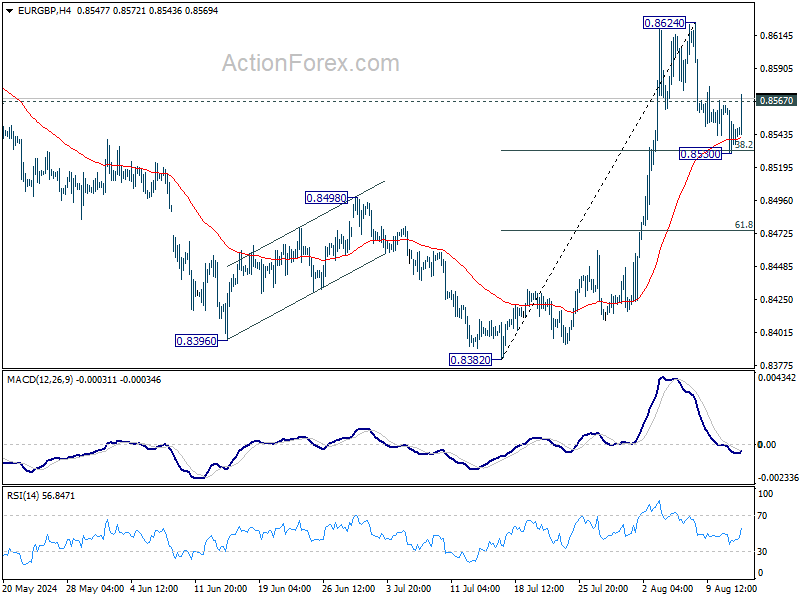
In the bigger picture, while the rebound from 0.8382 is strong, there is no confirmation of trend reversal yet. As long as 0.8643 resistance holds, down trend from 0.9267 could still resume through 0.8382 at a later stage. However, firm break of 0.8643 will indicate that such down trend has completed, and turn outlook bullish for 0.8764 resistance next.
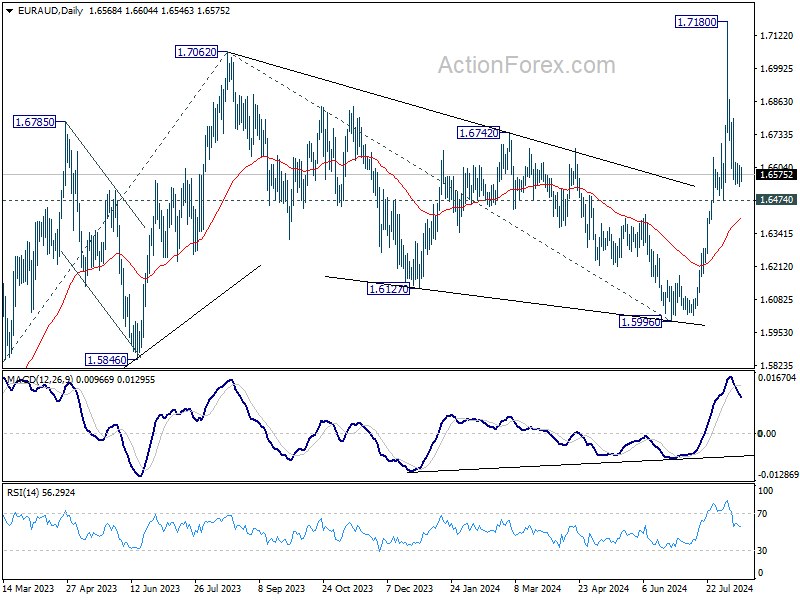
EUR/AUD Daily Outlook
Daily Pivots: (S1) 1.6531; (P) 1.6572; (R1) 1.6613; More...
Intraday bias in EUR/AUD remains neutral and outlook stays bullish with 1.6474 support intact. On the upside, above 1.6798 minor resistance will bring retest of 1.7180 resistance first. Firm break there will resume larger up trend to 1.7715 fibonacci projection level next. However, firm break of 1.6474 will dampen the bullish view and bring deeper pullback towards 1.5996 support.
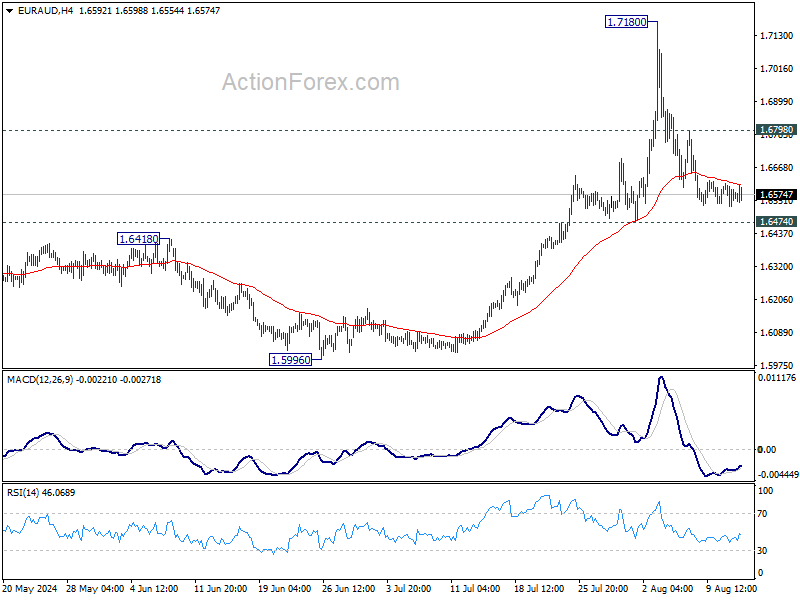
In the bigger picture, corrective fall from 1.7062 medium term top should have completed at 1.5996. Larger up trend from 1.4281 (2022 low) is resuming. Next target is 61.8% projection of 1.4281 to 1.7062 from 1.5996 at 1.7715. This will now remain the favored case as long as 1.6474 support holds.