
Sample Category Title
US: Inflationary Pressures Continue to Ease in July, Solidifying a September Rate Cut
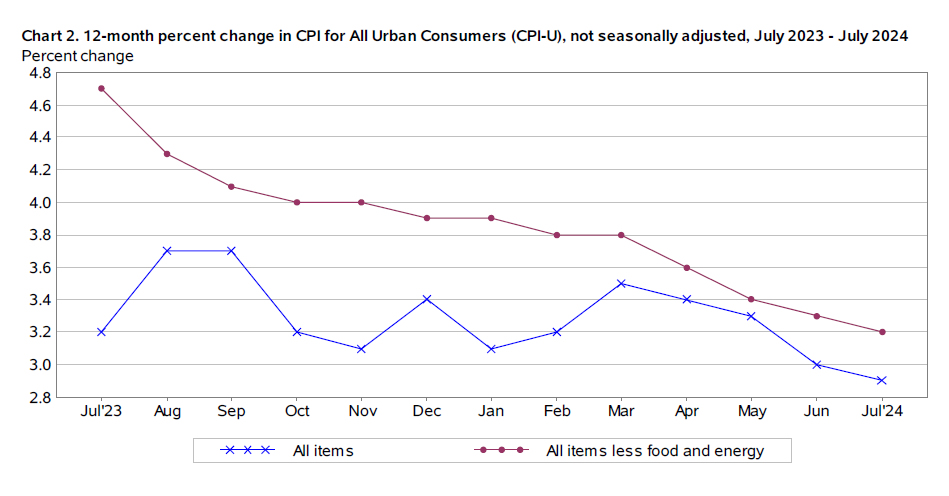
The Consumer Price Index (CPI) rose 0.2% month-on-month (m/m) in July, bang-on the consensus forecast. On a twelve-month basis, CPI fell to 2.9% (from 3.0% in June).
- After exerting a measurable drag in each of the two prior months, energy prices were largely flat in July. Food prices matched last month's gain, rising 0.2%.
Excluding food and energy, core prices rose 0.2% m/m, a modest acceleration from June's very soft monthly gain of 0.06%. The twelve-month change on core slipped by a tenth of a percentage point to 3.2% – the slowest pace of growth in over three years – while the three-month annualized rate of change fell to 1.6%.
Core services advanced a bit faster in July, rising by 0.3% m/m, and were entirely responsible for the uptick in headline inflation.
- Shelter costs ticked higher by 0.4%, or roughly double the pace of growth seen in June and accounted for 90% of the monthly gain in headline CPI. Last month's uptick in shelter costs were roughly in-line with the monthly gains averaged over the past twelve-months.
- Meanwhile, non-housing service inflation (aka 'supercore') rose by a soft 0.2% (0.15% unrounded) – an acceleration from last month's modest pullback – thanks to an uptick in motor vehicle insurance (+1.2%), recreational services (+0.4%) and 'other' personal services (+0.3%).
Core goods prices fell by 0.3% on the month, largely due to a further decline in new (-0.2%) and used vehicle prices (-2.3%). Goods prices have been flat or have registered a decline in each of the last 14 months.
Key Implications
Despite the uptick in monthly readings for both headline and core inflation, price pressures remained relatively subdued in July. Nearly all of last month's gain can be attributed to higher shelter costs, which carry a much smaller weight in core PCE inflation – the Fed's preferred inflation metric. Moreover, goods prices continued to edge lower, while the uptick in 'supercore' was relatively mild – rising at just half the clip averaged over the prior twelve-months. As a result, near-term trends on core inflation continued to edge lower, with the three-month annualized rate of change pushing below 2%.
With the labor market showing clear signs of cooling and inflationary pressures subsiding, the Federal Reserve can confidently start to dial back its policy rate in September. As noted in our recently published Q&A, we expect three quarter-point rate cuts from the Fed by year-end.
GBP/USD Shrugs as UK CPI Rises Less Than Expected
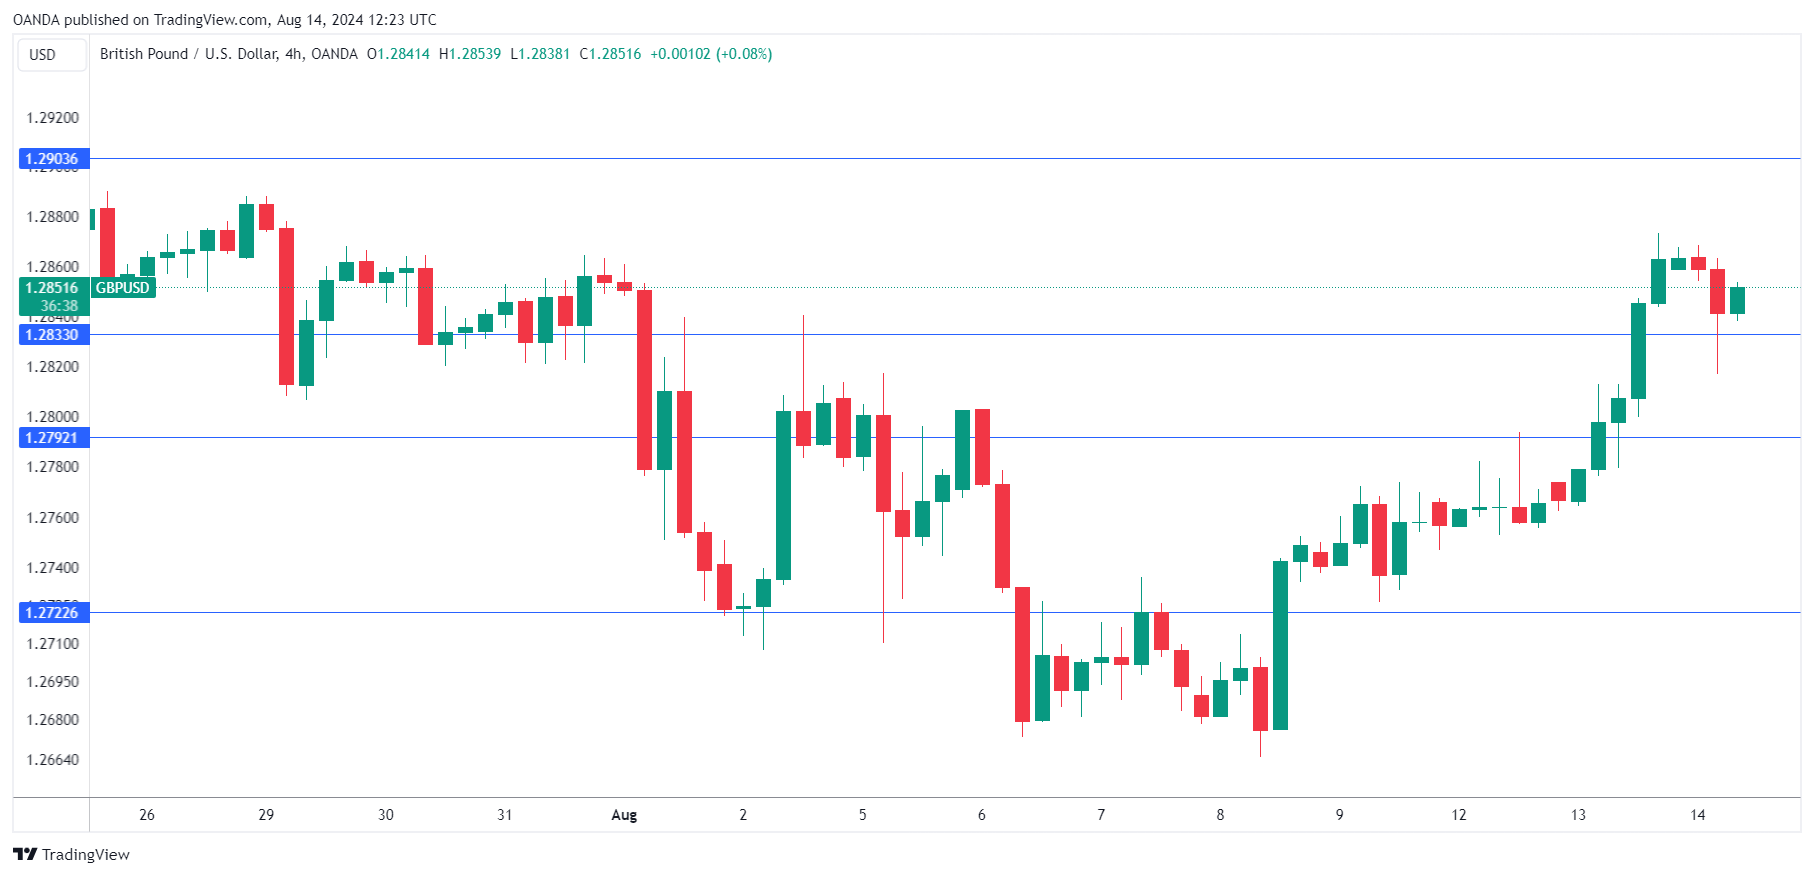
The British pound is showing limited movement on Wednesday. GBP/USD is trading at 1.2844 in the European session, down 0.15% on the day.
UK inflation report supports case for September rate cut
Headline inflation in the UK rose 2.2% y/y in July, up from 2% in June but below the market estimate of 2.3%. Perhaps most important for the Bank of England, services inflation slowed to 5.2%, the lowest since June 2022 and well below the BoE’s forecast of 5.6%. Monthly, inflation fell 0.2% in July, down from 0.1% in June and the first decline in six months. Core inflation fell from 3.5% y/y to 3.3% and monthly from 0.2% to 0.1%, also below expectations.
The soft inflation report supports the case for another rate cut in September, which the money markets have priced in at 45%. The BoE joined the new phase of the central banking cycle when it cut rates on August 1 by a quarter-point to 5%. The BoE meets next on September 19.
The UK released a mixed employment report on Tuesday. The unemployment rate dipped to 4.2% in the second quarter, down from 4.4% in Q1 and wage growth with bonuses slowed from a revised 5.8% y/y to 5.4%, its lowest level in two years. Still, this was much higher than the market estimate of 4.6% and is much higher than the inflation rate. Unemployment claims shot up to 135 thousand in July, blowing past the market estimate of revised 36.2 thousand and the market estimate of 4.6%.
GBP/USD Technical
- There is resistance at 1.2833 and 1.2903
- 1.2792 and 1.2722 are the next support levels
Market Analysis: AUD/USD Rallies While NZD/USD Trims Gains
AUD/USD is consolidating gains near the 0.6620 zone. NZD/USD is trimming gains and struggling to stay above the 0.6000 pivot zone.
Important Takeaways for AUD/USD and NZD/USD Analysis Today
- The Aussie Dollar started a downside correction from 0.6640 against the US Dollar.
- There is a key bullish trend line forming with support at 0.6610 on the hourly chart of AUD/USD at FXOpen.
- NZD/USD is declining from the 0.6080 resistance zone.
- There is a major bullish trend line forming with support at 0.6010 on the hourly chart of NZD/USD at FXOpen.
AUD/USD Technical Analysis
On the hourly chart of AUD/USD at FXOpen, the pair started a fresh increase from the 0.6500 support. The Aussie Dollar was able to clear the 0.6580 resistance to move into a positive zone against the US Dollar.
There was a close above the 0.6600 resistance and the 50-hour simple moving average. Finally, the pair tested the 0.6640 zone. A high was formed near 0.6642 and the pair is now correcting gains.
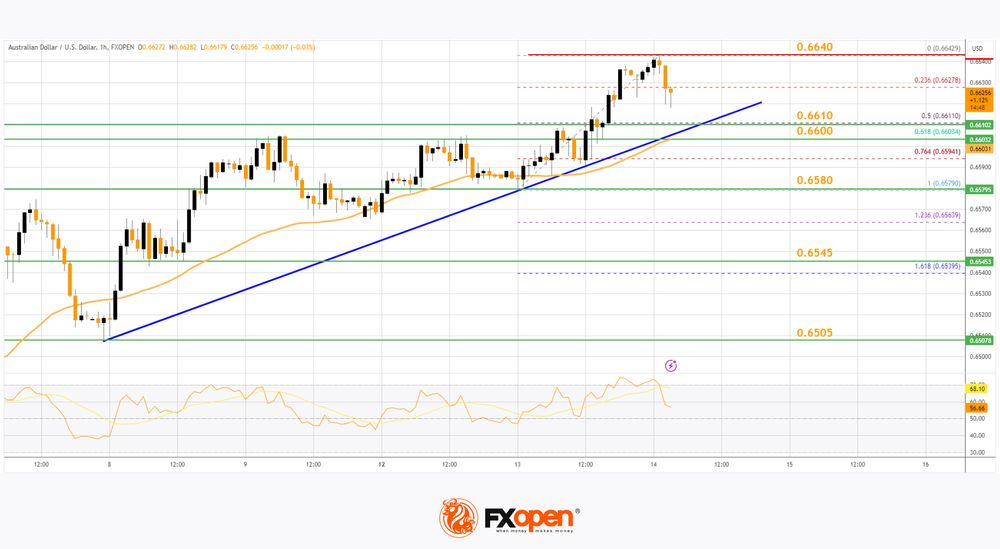
There was a move below the 0.6630 level. The pair declined below the 23.6% Fib retracement level of the upward move from the 0.6579 swing low to the 0.6642 high. On the downside, initial support is near a key bullish trend line at 0.6610.
The next major support is near the 61.8% Fib retracement level of the upward move from the 0.6579 swing low to the 0.6642 high at 0.6600.
If there is a downside break below the 0.6600 support, the pair could extend its decline toward the 0.6580 level. Any more losses might signal a move toward 0.6545.
On the upside, the AUD/USD chart indicates that the pair is now facing resistance near 0.6640. The first major resistance might be 0.6650. An upside break above the 0.6650 resistance might send the pair further higher.
The next major resistance is near the 0.6700 level. Any more gains could clear the path for a move toward the 0.6740 resistance zone.
NZD/USD Technical Analysis
On the hourly chart of NZD/USD on FXOpen, the pair started a steady increase from the 0.6000 zone. The New Zealand Dollar broke the 0.6035 resistance to start the recent increase against the US Dollar.
The pair climbed above 0.6060 and the 50-hour simple moving average. It tested the 0.6080 zone and is currently correcting gains. The pair corrected lower below the 0.6060 level. The pair also traded below the 50% Fib retracement level of the upward wave from the 0.5988 swing low to the 0.6081 high.
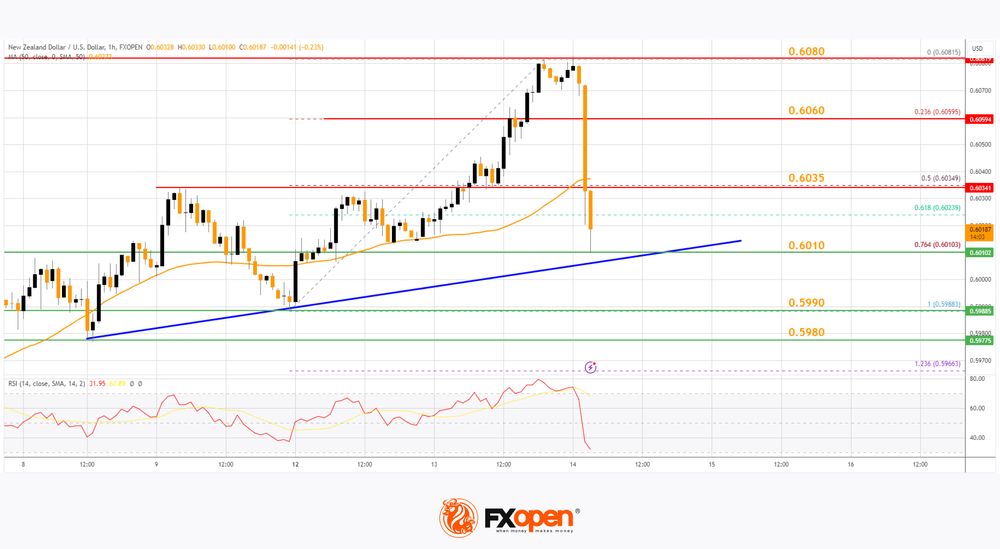
The NZD/USD chart suggests that the RSI is now well below 50 and signaling more downsides. On the downside, there is major support forming near 0.6010 and a trend line.
The trend line is close to the 76.4% Fib retracement level of the upward wave from the 0.5988 swing low to the 0.6081 high. The next major support is near the 0.5990 level.
If there is a downside break below the 0.5990 support, the pair might slide toward the 0.5980 support. Any more losses could lead NZD/USD in a bearish zone to 0.5950.
On the upside, the pair might struggle near 0.6035. The next major resistance is near the 0.6060 level. A clear move above the 0.6060 level might even push the pair toward the 0.6080 level. Any more gains might clear the path for a move toward the 0.6200 resistance zone in the coming days.
Trade over 50 forex markets 24 hours a day with FXOpen. Take advantage of low commissions, deep liquidity, and spreads from 0.0 pips. Open your FXOpen account now or learn more about trading forex with FXOpen.
This article represents the opinion of the Companies operating under the FXOpen brand only. It is not to be construed as an offer, solicitation, or recommendation with respect to products and services provided by the Companies operating under the FXOpen brand, nor is it to be considered financial advice.
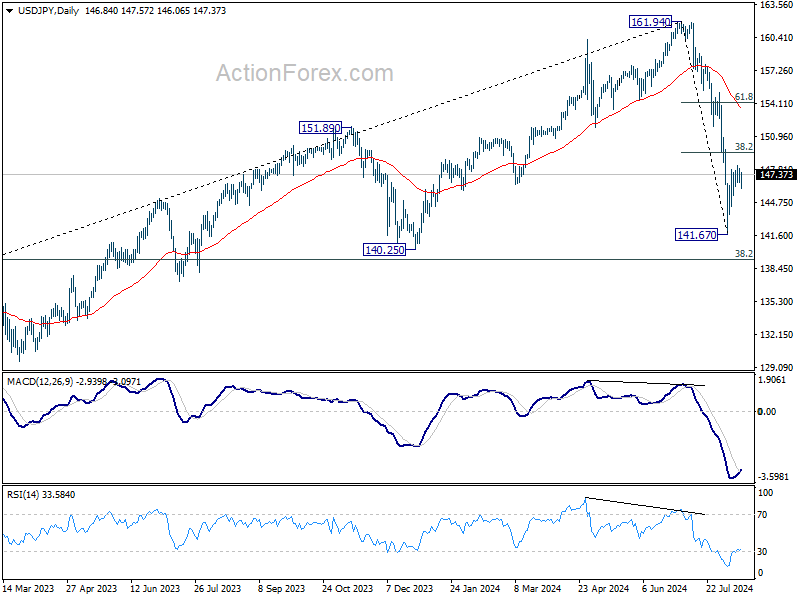
USD/JPY Mid-Day Outlook
Daily Pivots: (S1) 146.31; (P) 147.13; (R1) 147.66; More...
No change in USD/JPY's outlook and intraday bias stays neutral. Outlook stays bearish with 38.2% retracement of 161.94 to 141.67 at 149.41 intact and intraday bias stays neutral. Below 145.42 minor support will turn bias to the downside for 141.67. Break there will resume the fall from 161.94 to 140.25 support next. Nevertheless, decisive break of 149.41 will bring stronger rally to 61.8% retracement at 154.19, even as a corrective move.
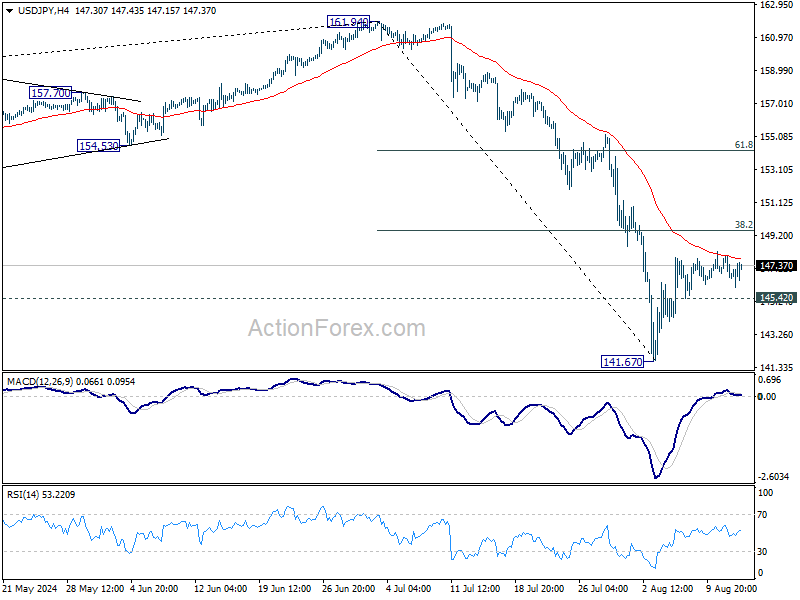
In the bigger picture, fall from 161.94 medium term is seen as correcting whole up trend from 102.58 (2021 low). Deeper decline could be seen to 38.2% retracement of 102.58 to 161.94 at 139.26, which is close to 140.25 support. In any case, risk will stay on the downside as long as 55 W EMA (now at 149.77) holds. Nevertheless, firm break of 55 W EMA will suggest that the range for medium term corrective pattern is already set.
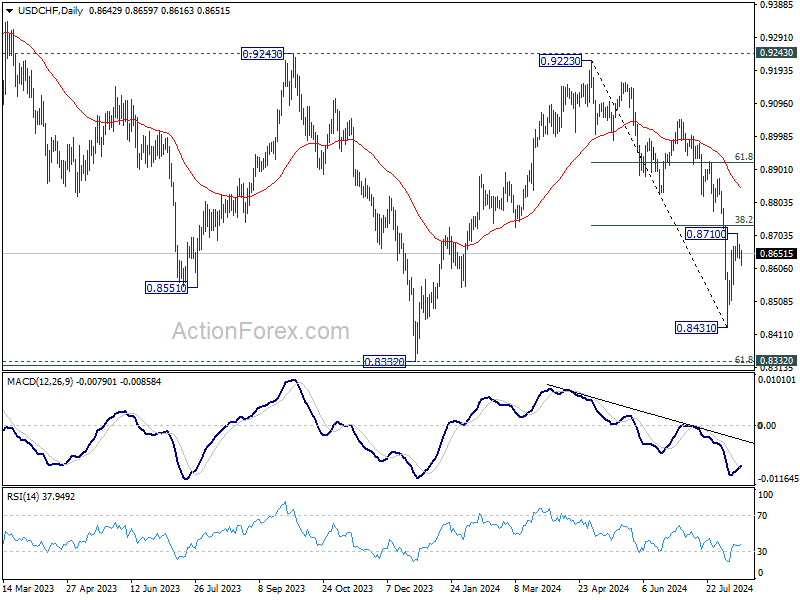
USD/CHF Mid-Day Outlook
Daily Pivots: (S1) 0.8630; (P) 0.8655; (R1) 0.8673; More….
Breach of 0.8631 minor support argues that USD/CHF's rebound from 0.8431 might have completed at 0.8701 already. Intraday bias is mildly on the downside for retesting 0.8431 low. On the upside, however, firm break of 38.2% retracement of 0.9223 to 0.8431 at 0.8734 will bring stronger rally to 61.8% retracement at 0.8920, even as a corrective move.
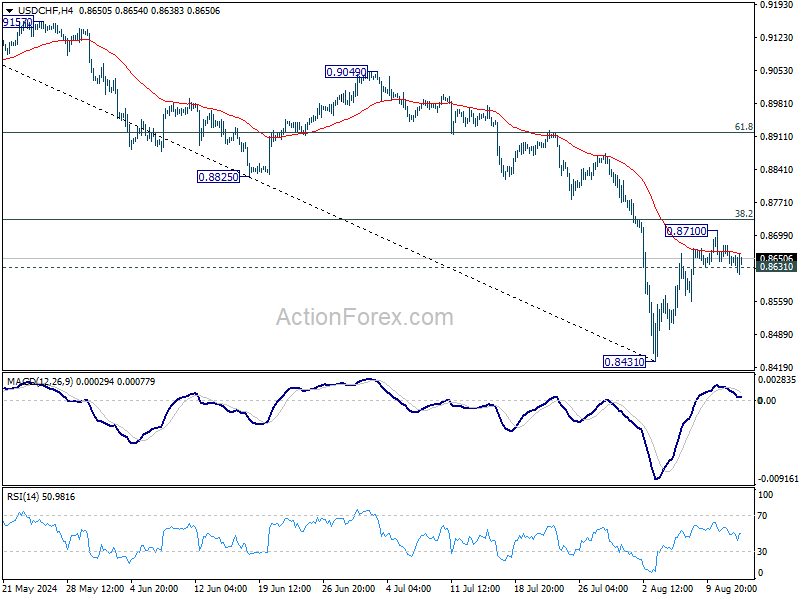
In the bigger picture, price actions from 0.8332 (2023 low) are currently seen as a medium term corrective pattern, with fall from 0.9223 as the second leg. Strong support could be seen from 0.8332 to bring rebound. Yet, overall outlook will continue to stay bearish as long as 0.9243 resistance holds. Firm break of 0.8332, however, will resume larger down trend from 1.0146 (2022 high).
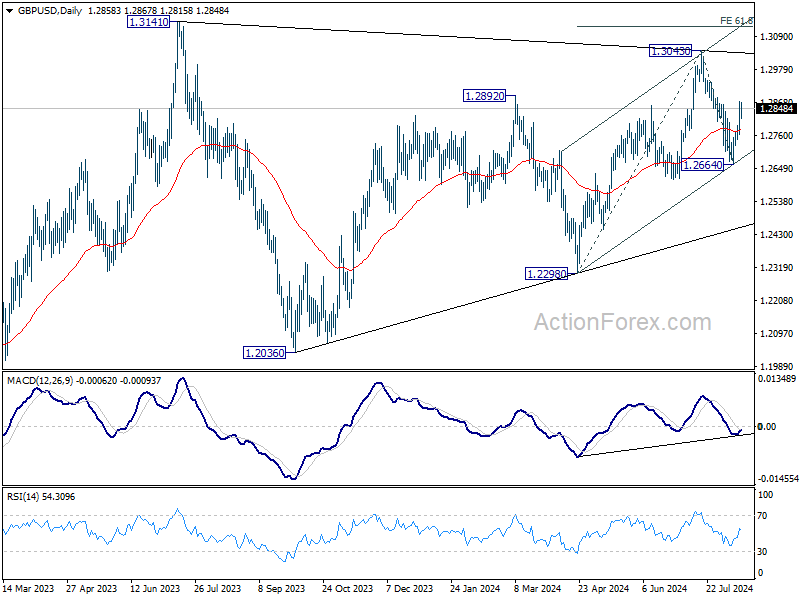
GBP/USD Mid-Day Outlook
Daily Pivots: (S1) 1.2792; (P) 1.2833; (R1) 1.2903; More...
Intraday bias in GBP/USD remains on the upside at this point. Pull back from 1.3043 could have completed at 1.2664 already. Further rise should be seen to retest 1.3043 resistance first. Firm break there will resume whole rally from 1.2998 to 61.8% projection of 1.2298 to 1.3043 from 1.2664 at 1.3124, which is close to 1.3141 high. On the downside, below 1.2754 minor support will turn intraday bias neutral first.
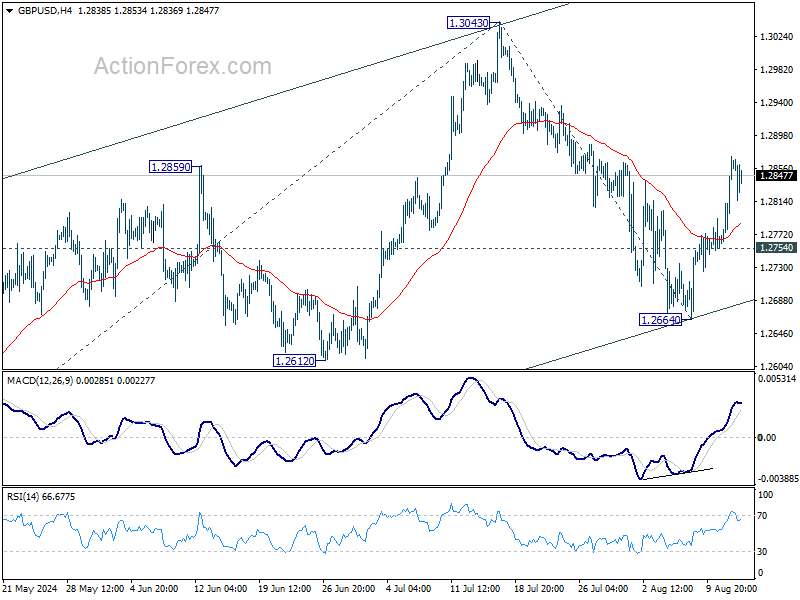
In the bigger picture, as long as 1.3141 resistance holds (2023 high), medium term corrective pattern from there could still extend with another falling leg. But even in that case, downside should be contained by 1.2036/2298 support zone. Meanwhile, decisive break of 1.3141 will confirm resumption of whole up trend from 1.0351 (2022 low).
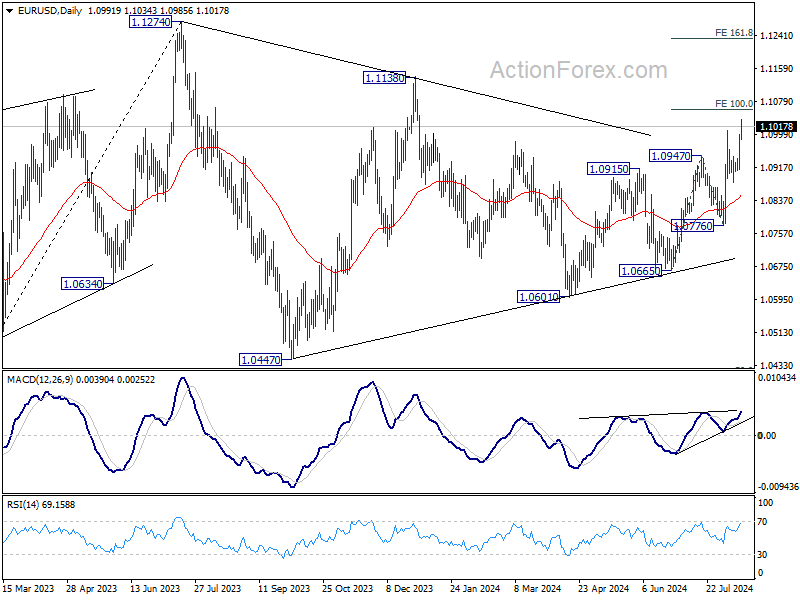
EUR/USD Mid-Day Outlook
Daily Pivots: (S1) 1.0938; (P) 1.0969; (R1) 1.1024; More.....
EUR/USD's break of 1.1007 confirms resumption of whole rally from 1.0665. Intraday bias is staying on the upside for 100% projection of 1.0665 to 1.0947 from 1.0776 at 1.1058. Decisive break there could prompt upside acceleration through 1.1138 resistance to 161.8% projection at 1.1232. On the downside, below 1.0985 minor support will turn intraday bias neutral first. But outlook will stay bullish as long as 1.0880 support holds.
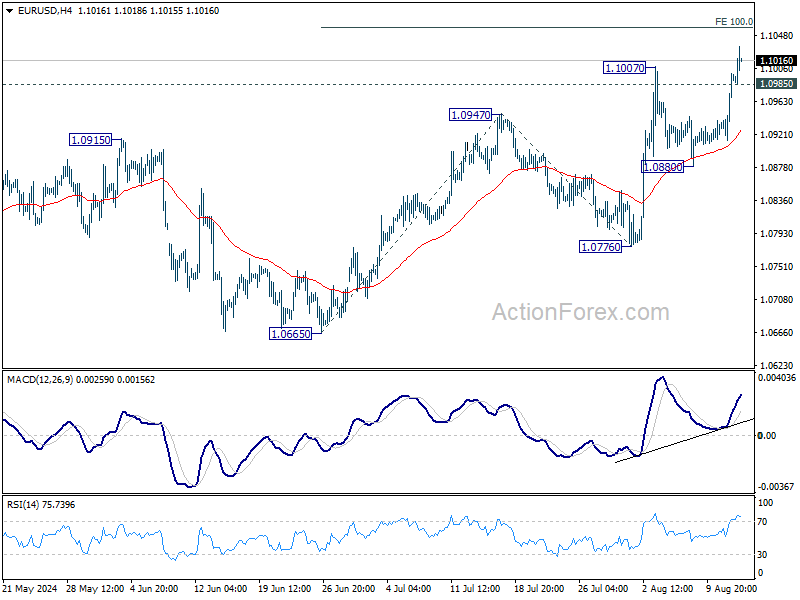
In the bigger picture, price actions from 1.1274 are viewed as a corrective pattern that's could still extend. Break of 1.1138 resistance will be the first signal that rise from 0.9534 (2022 low) is ready to resume through 1.1274 (2023 high). However, break of 1.0776 support will extend the correction with another falling leg back towards 1.0447 support.
Muted Reaction to US CPI, Euro Leads While Kiwi Struggles
The market's initial reaction to US CPI data has been relatively subdued. While both headline and core CPI readings slowed in July, they remain elevated. This ongoing disinflation is a positive sign for the Fed, but the pace is not rapid enough to justify a larger rate cut in September. As a result, US stock futures are treading water, and 10-year Treasury yield is ticking up slightly.
In the currency markets, Euro has emerged as the clear winner today, bolstered in part by its rebound against the British Pound. Sterling is losing momentum following lower-than-expected UK CPI data, which now makes a BoE rate cut in September a closer call. Dollar is the second strongest currency today, although it remains within a tight range against most majors, showing noticeable movement only against Euro and New Zealand Dollar.
On the other hand, Kiwi continues to be the worst performer, holding onto most of its losses from the RBNZ's surprise rate cut. With RBNZ beginning its easing cycle earlier than anticipated, there is room for one or even two more rate cuts this year. Yen, Australian Dollar, British Pound, Swiss Franc, and Canadian Dollar are mixed, trading without clear direction.
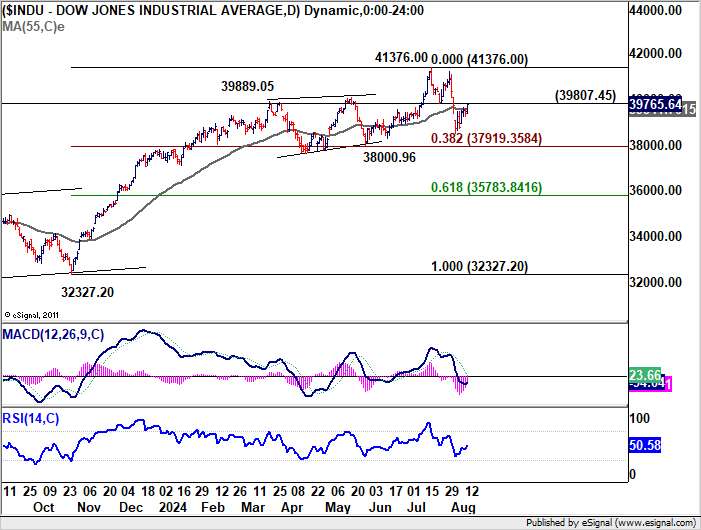
Technically, an immediate focus is on whether DOW could break through 39807.45 support turned resistance today. If realized, that would indicate that correction from 41376.00 has completed already. More importantly, successful defense of 38000.96 cluster support (38.2% retracement of 32327.20 to 41376 at 37979.35) would keep the near term up trend intact for upside breakout, sooner rather than later.
In Europe, at the time of writing, FTSE is up 0.17%. DAX is up 0.41%. CAC is up 0.40%. UK 10-year yield is down -0.0315 at 3.861. Germany 10-year yield is up 0.019 at 2.208. Earlier in Asia, Nikkei rose 0.58%. Hong Kong HSI fell -0.35%. China Shanghai SSE fell -0.60%. Singapore Strait Times rose 0.85%. Japan 10-year JGB yield fell -0.0337 to 0.814.
US CPI falls to 2.9% yoy in Jul, core CPI down to 3.2% yoy
US CPI rose 0.2% mom in July, matched expectations. CPI core (all items less food and energy) rose 0.2% mom, matched expectations. Energy prices were unchanged over the month while food prices increased 0.2% mom.
For the 12-month period, CPI slowed from 3.0% yoy to 2.9% yoy, below expectation of 3.0% yoy. Headline CPI reading was the lowest since March 2021. CPI core slowed from 3.3% yoy to 3.2% yoy, matched expectations. CPI core reading was the lowest since April 2021. Energy prices rose 1.1% yoy while food prices rose 2.2% yoy.
Eurozone industrial production falls -0.1% mom in Jun, EU down -0.1% mom
Eurozone industrial production fell -0.1% mom in June, much worse than expectation of 0.4% mom rise. Industrial production increased by 0.7% for intermediate goods, 1.9% for energy, 0.9% for capital goods, and 3.8% for durable consumer goods. Production decreased by -2.5% for non-durable consumer goods.
EU industrial production fell -0.1% mom. Among Member States for which data are available, the largest monthly decreases were recorded in Ireland (-7.8%), Belgium (-6.5%), Croatia and Portugal (both -3.7%). The highest increases were observed in Romania (+4.0%), Finland (+3.6%) and Slovakia (+2.1%).
UK CPI rises to 2.2% in Jul, core down to 3.3%, both below expectations
UK CPI rose from 2.0% yoy to 2.2% yoy in July, below expectation of 2.3% yoy. Core CPI (excluding energy, food, alcohol and tobacco) slowed from 3.5% yoy to 3.3% yoy, below expectation of 3.4% yoy. Core CPI reading was the lowest since September 2021.
CPI goods annual rate rose from -1.4% yoy to negative 0.6% yoy. CPI services annual rate fell from 5.7% yoy to 5.2% yoy.
On a monthly basis, CPI fell by -0.2% mom.
RBNZ surprises with rate cut, signals another reduction this year
In an unexpected move, RBNZ lowered its Official Cash Rate by 25bps to 5.25% today, catching markets off guard. The central bank also unveiled new economic projections, which indicate the possibility of another rate cut later this year, followed by a total of 100bps in cuts throughout 2025.
RBNZ emphasized that the "pace of further easing" will hinge on confidence that pricing behavior remains aligned with a low-inflation environment and that inflation expectations stay anchored around the 2% target.
The minutes of the meeting reveal that "recent indicators give confidence that inflation will return sustainably to target within a reasonable time frame." The Committee agreed that with headline CPI inflation expected to return to the target band by the September quarter and growing excess capacity supporting a continued decline in domestic inflation, there was room to "temper the extent of monetary policy restraint."
The new economic projections suggest that OCR could drop further to 4.9% by Q4 2024, 3.8% by the end of 2025, and eventually reach 3.0% by mid-2027. Annual CPI inflation is forecasted to hover between 2.2% and 2.4% before settling at 2.0% by Q2 2026.
EUR/USD Mid-Day Outlook
Daily Pivots: (S1) 1.0938; (P) 1.0969; (R1) 1.1024; More.....
EUR/USD's break of 1.1007 confirms resumption of whole rally from 1.0665. Intraday bias is staying on the upside for 100% projection of 1.0665 to 1.0947 from 1.0776 at 1.1058. Decisive break there could prompt upside acceleration through 1.1138 resistance to 161.8% projection at 1.1232. On the downside, below 1.0985 minor support will turn intraday bias neutral first. But outlook will stay bullish as long as 1.0880 support holds.
In the bigger picture, price actions from 1.1274 are viewed as a corrective pattern that's could still extend. Break of 1.1138 resistance will be the first signal that rise from 0.9534 (2022 low) is ready to resume through 1.1274 (2023 high). However, break of 1.0776 support will extend the correction with another falling leg back towards 1.0447 support.
Economic Indicators Update
| GMT | Ccy | Events | Actual | Forecast | Previous | Revised |
|---|---|---|---|---|---|---|
| 02:00 | NZD | RBNZ Rate Decision | 5.25% | 5.50% | 5.50% | |
| 03:00 | NZD | RBNZ Press Conference | ||||
| 06:00 | GBP | CPI M/M Jul | -0.20% | 0.10% | ||
| 06:00 | GBP | CPI Y/Y Jul | 2.20% | 2.30% | 2.00% | |
| 06:00 | GBP | Core CPI Y/Y Jul | 3.30% | 3.40% | 3.50% | |
| 06:00 | GBP | RPI M/M Jul | 0.10% | 0.20% | ||
| 06:00 | GBP | RPI Y/Y Jul | 3.60% | 3.30% | 2.90% | |
| 06:00 | GBP | PPI Input M/M Jul | -0.10% | -0.40% | -0.80% | -0.40% |
| 06:00 | GBP | PPI Input Y/Y Jul | 0.40% | -0.40% | 0.00% | |
| 06:00 | GBP | PPI Output M/M Jul | 0.00% | 0.20% | -0.30% | -0.70% |
| 06:00 | GBP | PPI Output Y/Y Jul | 0.80% | 1.20% | 1.40% | 1.00% |
| 06:00 | GBP | PPI Core Output M/M Jul | 0.00% | 0.10% | ||
| 06:00 | GBP | PPI Core Output Y/Y Jul | 1.00% | 1.10% | 1.10% | |
| 09:00 | EUR | Eurozone GDP Q/Q Q2 P | 0.30% | 0.30% | 0.30% | |
| 09:00 | EUR | Eurozone Employment Change Q/Q Q2 P | 0.20% | 0.20% | 0.30% | |
| 09:00 | EUR | Eurozone Industrial Production M/M Jun | -0.10% | 0.40% | -0.60% | |
| 12:30 | USD | CPI M/M Jul | 0.20% | 0.20% | -0.10% | |
| 12:30 | USD | CPI Y/Y Jul | 2.90% | 3.00% | 3.00% | |
| 12:30 | USD | CPI Core M/M Jul | 0.20% | 0.20% | 0.10% | |
| 12:30 | USD | CPI Core Y/Y Jul | 3.20% | 3.20% | 3.30% | |
| 14:30 | USD | Crude Oil Inventories | -1.9M | -3.7M |
US CPI falls to 2.9% yoy in Jul, core CPI down to 3.2% yoy
US CPI rose 0.2% mom in July, matched expectations. CPI core (all items less food and energy) rose 0.2% mom, matched expectations. Energy prices were unchanged over the month while food prices increased 0.2% mom.
For the 12-month period, CPI slowed from 3.0% yoy to 2.9% yoy, below expectation of 3.0% yoy. Headline CPI reading was the lowest since March 2021. CPI core slowed from 3.3% yoy to 3.2% yoy, matched expectations. CPI core reading was the lowest since April 2021. Energy prices rose 1.1% yoy while food prices rose 2.2% yoy.
Ethereum Gently Gaining Momentum
Market Picture
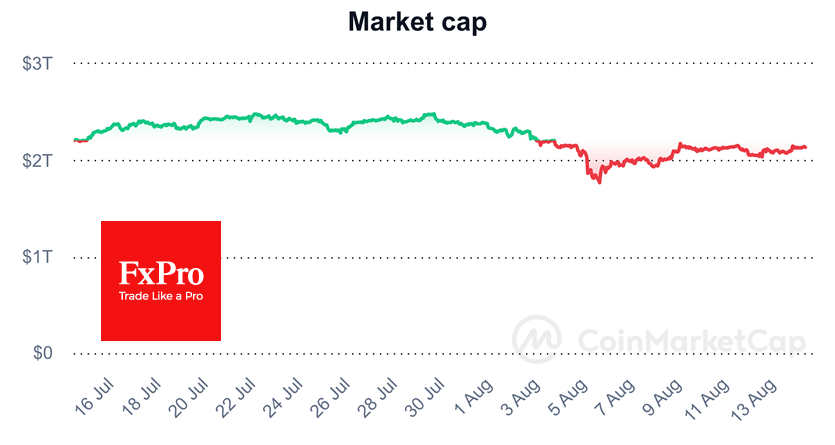
The cryptocurrency market added 2.2% in the last 24 hours to reach $2.14 trillion, a fresh attempt to climb into the upper half of last month’s trading range from where last week’s sell-off was intensified. Over the past 24 hours, the macroeconomic background has been favourable for risk appetite thanks to slowing producer prices and New Zealand’s key rate cut.
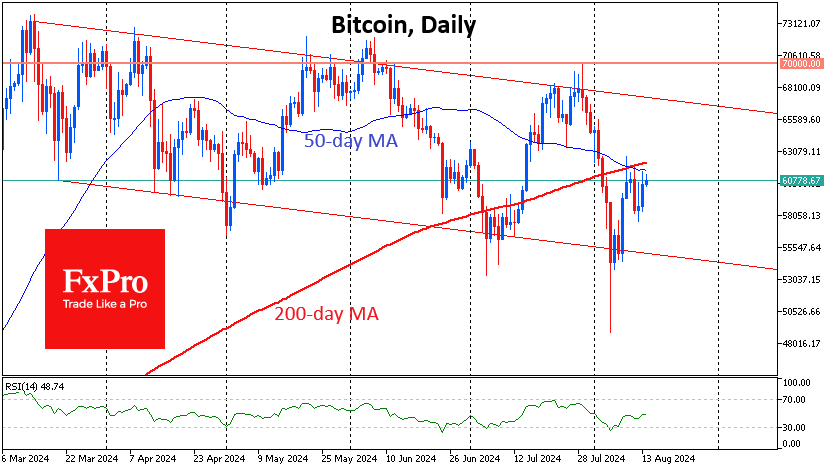
Bitcoin remains at arm’s length from the $61K level, continuing to test the 50-day moving average and adding 2.5% in 24 hours. We assume a high correlation between Bitcoin, the entire crypto market and the dynamics of the stock market. Data supporting the Fed’s imminent easing of monetary policy may encourage the bulls to overcome the short-term downtrend and give the green light to rise all the way to $66K. Nevertheless, a new sell-off momentum is still the prevailing scenario, with a potential pullback to $55K.
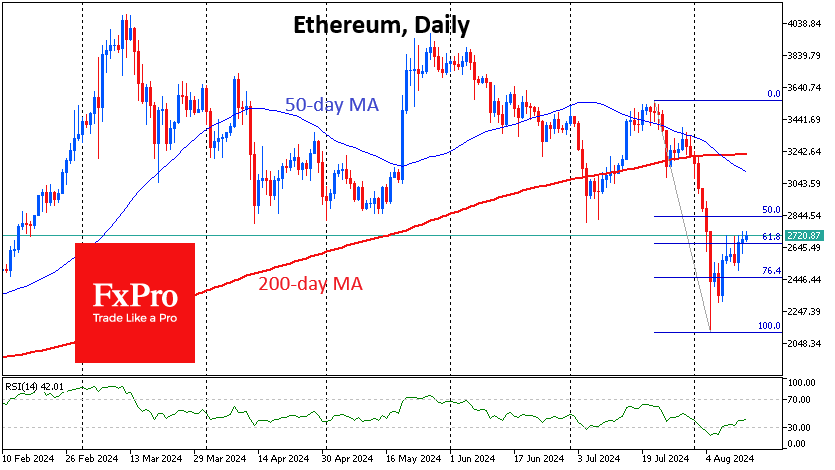
With Ethereum as an example, we can see how ETFs perform in the early stages. The coin is recovering better than other altcoins, adding 2.8% on the day to $2730. ETHUSD is vulnerable to equities sell-offs but benefits more from inclusion in portfolios of investment managers seeking broad diversification.
News Background
BRN is cautious about Bitcoin’s outlook and recommends using the pullback to increase positions gradually. Volatility will continue in August and September, with BTC fluctuating between $49K and $69K.
Bitcoin may leave the established corridor due to the upcoming Fed rate cut and the US election, FalconX believes. A sustained rally in altcoins will require improved liquidity narratives and trends, as well as the removal of potential selling pressure from early investors.
The US SEC accused NovaTech’s founders and promoters of organising a Ponzi scheme that raised more than $650 million in crypto assets from more than 200,000 investors worldwide.
Japanese public company Metaplanet announced the purchase of 57.1 BTC for 500 million yen (~$3.3 million), bringing the company’s total Bitcoin holdings to 303,095 BTC ($18 million).
As noted by Arkham, Custodian BitGo moved 33,140.4 BTC (~$1.97 billion) related to the collapsed Mt. Gox. It is the last of five platforms working with a trustee to distribute funds to creditors. The addresses of the collapsed platform still hold 46,164 BTC worth $2.75 billion.
The liquidators of cryptocurrency hedge fund Three Arrows Capital (3AC) have demanded at least $1.3 billion from Terraform Labs, the company behind the Terra ecosystem. One of the industry’s most prominent hedge funds collapsed shortly after Terra and several other major crypto companies collapsed in 2022.