Sample Category Title
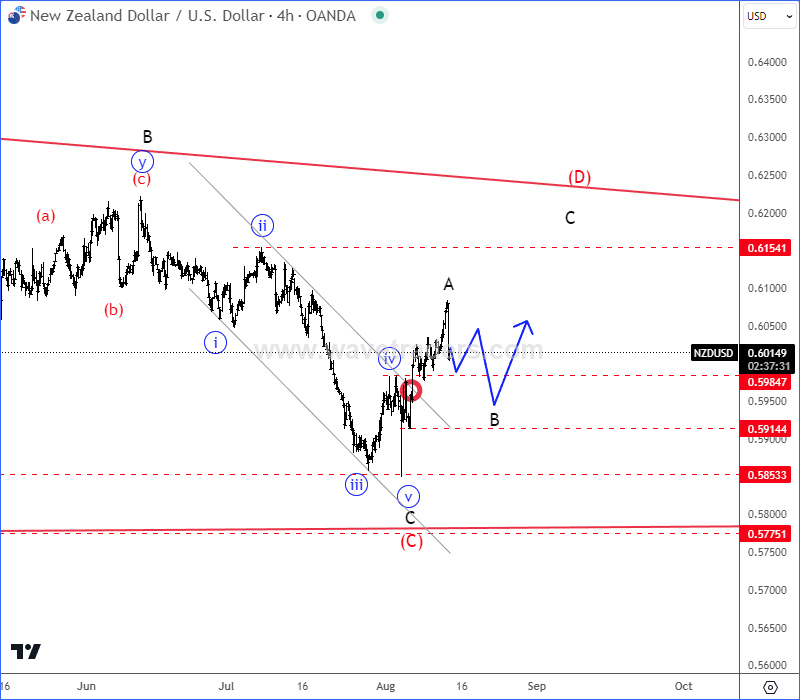
NZD/USD Looking for a Bigger Recovery
Looking at the 4-hour time frame of the Kiwi with ticker NZDUSD, we can see a strong rebound after a completed final subwave “v” of C of (C), as Zealand beat jobs data, so seems like a new three-wave A-B-C rally can be in play within higher degree wave (D) that can recover the price back to the upper triangle line. Wave A looks to be finished after RNBZ delivers surprise 25 BPS rate cut to 5.25%, so seems like it’s now making a pullback in wave B that can retest 0,59x support area before a continuation higher for wave C towards 0,61 – 0,62 resistance zone.
GBP/USD Analysis: Rate Steady After Key Data Releases
Yesterday, important U.S. inflation data was released, as reported by ForexFactory:
→ Core CPI (MoM): actual = 0.2%, forecast = 0.2%; previous = 0.1%;
→ CPI (YoY): actual = 2.9%, forecast = 3.0%; previous = 3.0%.
Today, market participants learned about the change in the UK’s monthly GDP: actual = 0.0%, forecast = 0.0%; previous = 0.4%.
However, these news releases had little impact on the GBP/USD exchange rate, likely because the actual figures were in line with expectations.
Today's technical analysis of the GBP/USD chart shows that the price is consolidating within a narrowing triangle (marked in green). The upper line of this triangle aligns with a fan line that has been expanding downwards, with price action tracing the fan's contours since the second half of July.
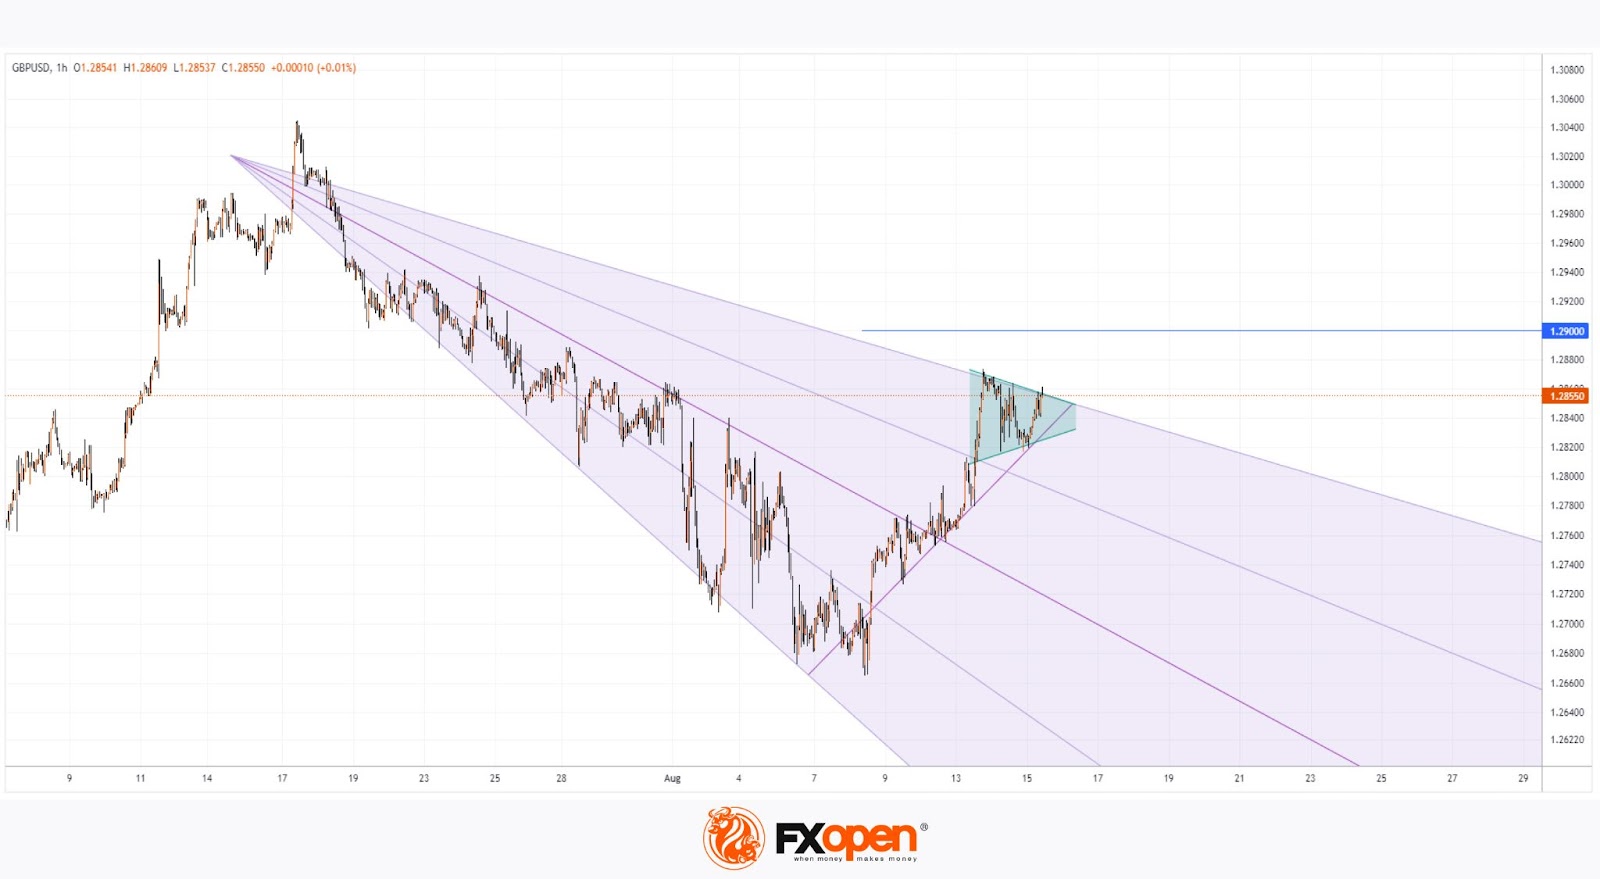
Which Way Will the Triangle Break?
If the bulls take the initiative and attempt to break upwards out of the triangle, they may quickly encounter resistance around the 1.2900 level—this is not only a round psychological number but also the 50% retracement level of the bearish impulse from the July 17 peak to the August 8 low (A→B).
Today, data on U.S. retail sales and the labour market will be released at 15:30 (GMT+3). There’s a possibility these reports could surprise the market, leading to sharp movements in GBP/USD and disrupting the current state of temporary stability.
Trade over 50 forex markets 24 hours a day with FXOpen. Take advantage of low commissions, deep liquidity, and spreads from 0.0 pips. Open your FXOpen account now or learn more about trading forex with FXOpen.
This article represents the opinion of the Companies operating under the FXOpen brand only. It is not to be construed as an offer, solicitation, or recommendation with respect to products and services provided by the Companies operating under the FXOpen brand, nor is it to be considered financial advice.
A New Downturn in the Crypto Market
Market Picture
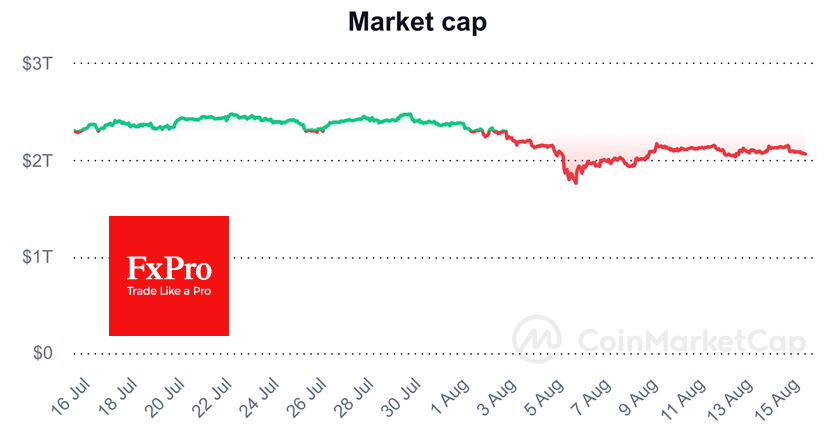
The cryptocurrency market retreated 2.9% over the past 24 hours to $2.08 trillion from levels near $2.15 trillion, which had been resistance for the past ten days. Despite moderate optimism in equities following the inflation data, cryptocurrencies failed to find sufficient demand. The negative performance of cryptocurrencies could herald another round of outflows from risk assets, especially ahead of the weekend.
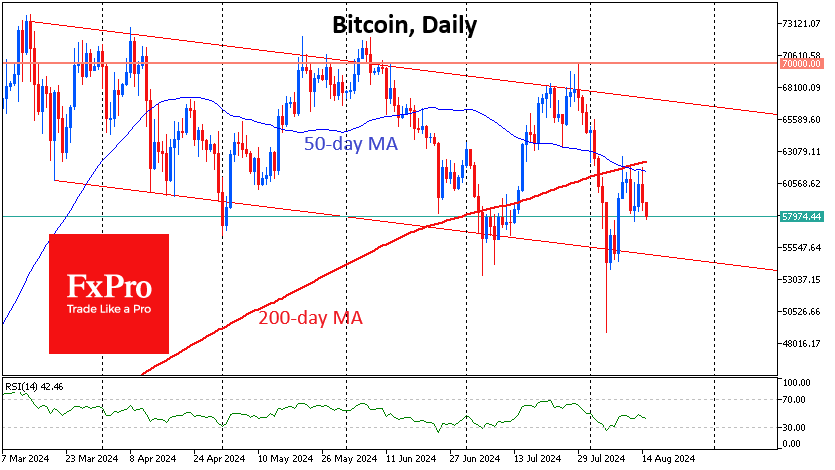
Bitcoin fell to $58K, a loss of 4.5% in 24 hours. The sell-off started with the crossing of the 50- and 200-day moving averages. According to statistics, when a ‘death cross’ is formed, it takes an average of one month to recover to the starting point.
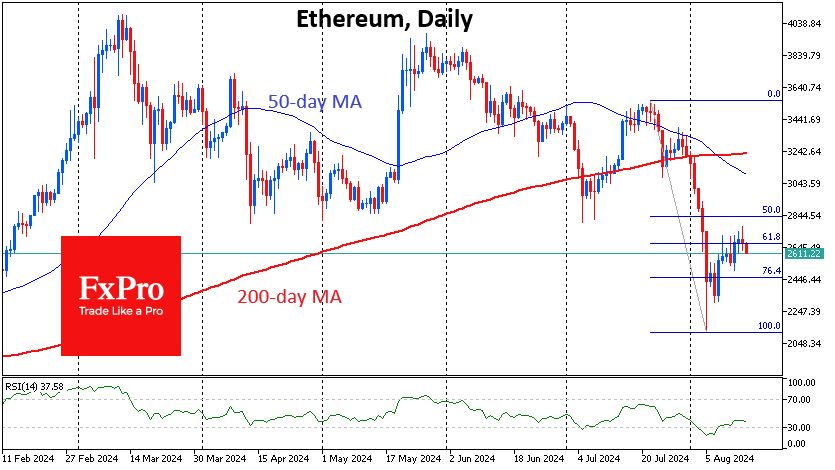
Ethereum, which rolled back to $2620, experienced a similar drop. The rally lost momentum near the 61.8% level of the initial decline, creating the risk of another $500 pullback.
News Background
Cointelegraph writes that Solana’s (SOL) rise to $190 looks more realistic than $300-1000 due to competition from L2 for Ethereum and the risks of waning hype around meme coins. The journalists called SOL overvalued compared to L2 tokens for Ethereum.
Former employees of the TON Foundation have set up a venture capital firm, TON Ventures, and raised an initial investment of $40 million. The project will support startups on The Open Network (TON). The TON cryptocurrency hit new highs in more than three weeks, climbing above $7 intraday.
Rising stablecoin issuance could be the key to Bitcoin’s continued rally, according to 10x Research. The issuers of the largest stablecoins, Tether and Circle, issued nearly $2.8 billion worth of assets last week, indicating that some institutional investors are injecting fresh capital into the crypto market.
According to SEC filings, investment bank Goldman Sachs and trading firm DRW Holdings own crypto ETFs worth $418.7 million and $238.6 million, respectively.
According to Growthepie, the daily number of transactions in Ethereum-based Layer 2 (L2) solutions has reached a record 12.5 million, up more than 140% since the beginning of the year. The Coinbase-backed Base blockchain has largely driven the growth. At the same time, the number of active addresses in the L2 segment began to decline, peaking in mid-July.
According to Token Terminal, BlackRock is preparing to launch its blockchain, which will be an analogue of Coinbase’s L2 network.
GBP/JPY Daily Outlook
Daily Pivots: (S1) 188.05; (P) 188.74; (R1) 189.62; More...
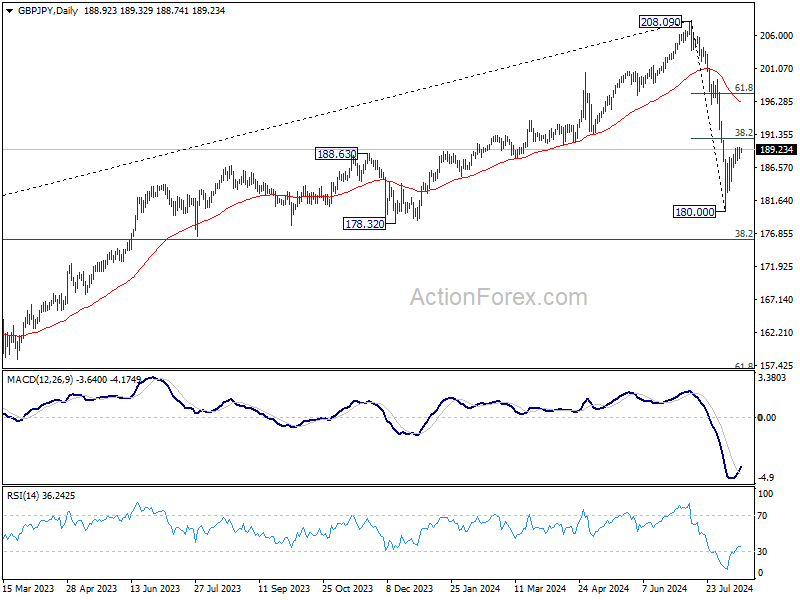
Intraday bias in GBP/JPY stays neutral and outlook remains bearish with 38.2% retracement of 208.09 to 180.00 at 190.73 intact. On the downside, below 186.46 minor support will turn intraday bias back to the downside for retesting 180.00 low. Break there will resume the fall from 208.90 to 178.32 support next. However, firm break of 190.73 will extend the rebound to 61.8% retracement at 197.35, even as a corrective move.
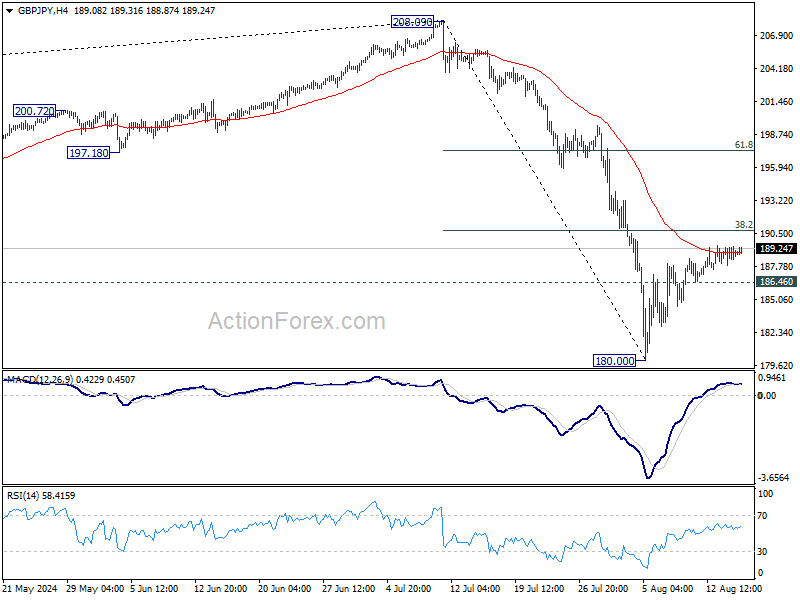
In the bigger picture, fall from 208.09 medium term top is seen as correcting the up trend from 123.94 (2020 low). Deeper decline is in favor as long as 55 W EMA (now at 189.18) holds. But strong support could emerge between 178.32 and 38.2% retracement of 123.94 to 208.09 at 175.94 to bring rebound. Meanwhile, sustained trading above 55 W EMA will suggest that the range for the medium term corrective pattern is already set.
EUR/JPY Daily Outlook
Daily Pivots: (S1) 161.02; (P) 161.81; (R1) 163.02; More...
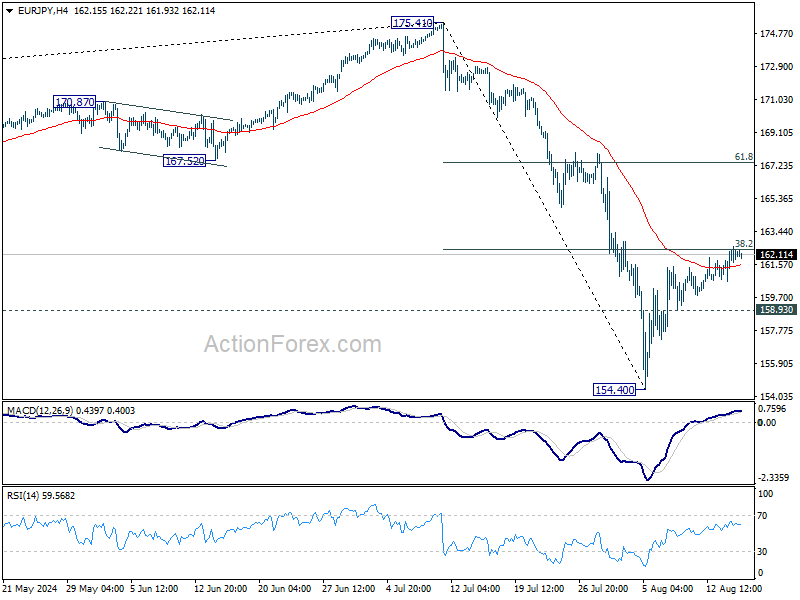
Intraday bias in EUR/JPY stays neutral and outlook remains bearish with 38.2% retracement of 175.41 to 154.40 at 162.42 intact. On the downside, below 157.71 minor support will bring retest of 154.40 first. Break there will resume the fall from 175.41 to 153.15 support next. However, sustained break of 162.42 will bring strong rise to 61.8% retracement at 167.38, even as a corrective move.
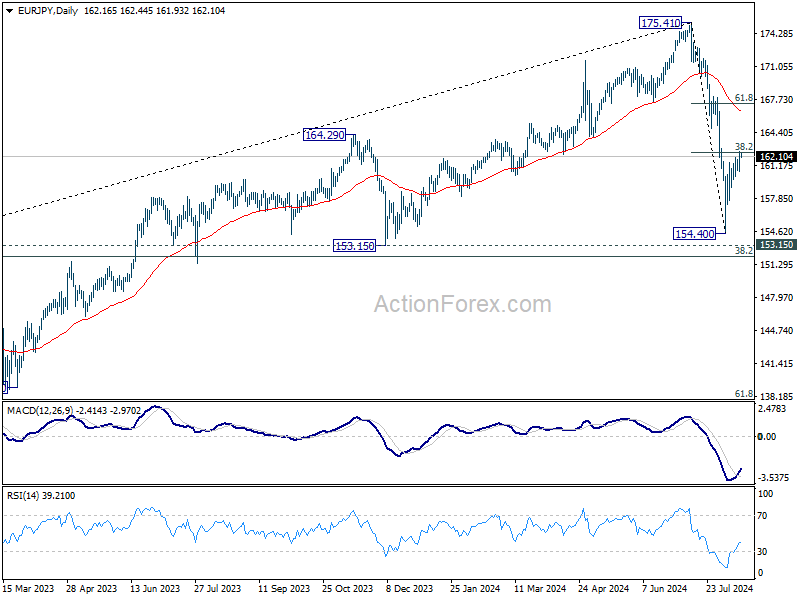
In the bigger picture, fall from 175.41 medium term top should be correcting the whole rise from 114.42 (2020 low). Deeper decline could be seen as long as 55 W EMA (now at 161.88) holds. But strong support should emerge between 153.15 and 38.2% retracement of 114.42 to 175.41 at 152.11 to bring rebound, at least on first attempt. Meanwhile, sustained trading above 55 W EMA will argue that the range of the medium term corrective pattern has already been set.
EUR/GBP Daily Outlook
Daily Pivots: (S1) 0.8554; (P) 0.8573; (R1) 0.8605; More....
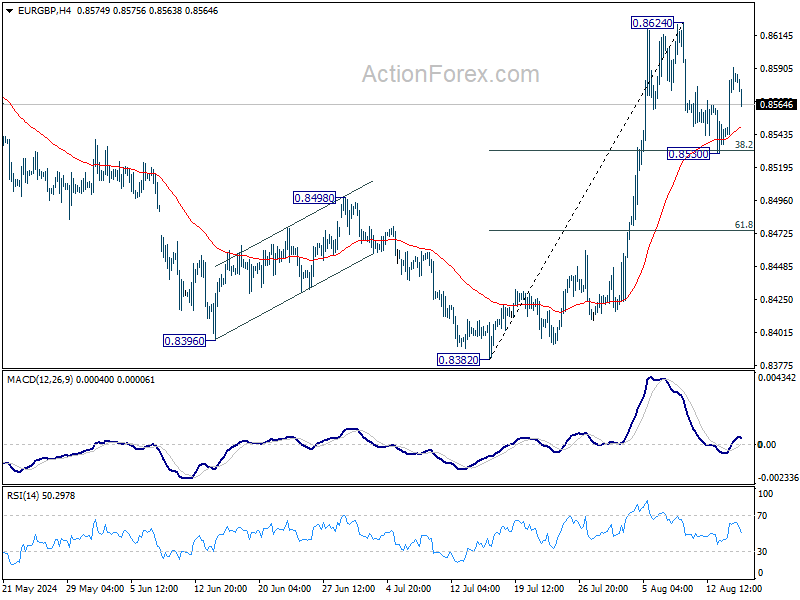
Intraday bias in EUR/GBP is turned neutral first with current retreat, and more consolidations could be seen below 0.8624. But outlook stays bullish as long as 38.2% retracement of 0.8382 to 0.8624 at 0.8532 holds. Firm break of 0.8624 will resume the rally from 0.8382. However, decisive break of 0.8532 will bring deeper fall to 61.8% retracement at 0.8474.
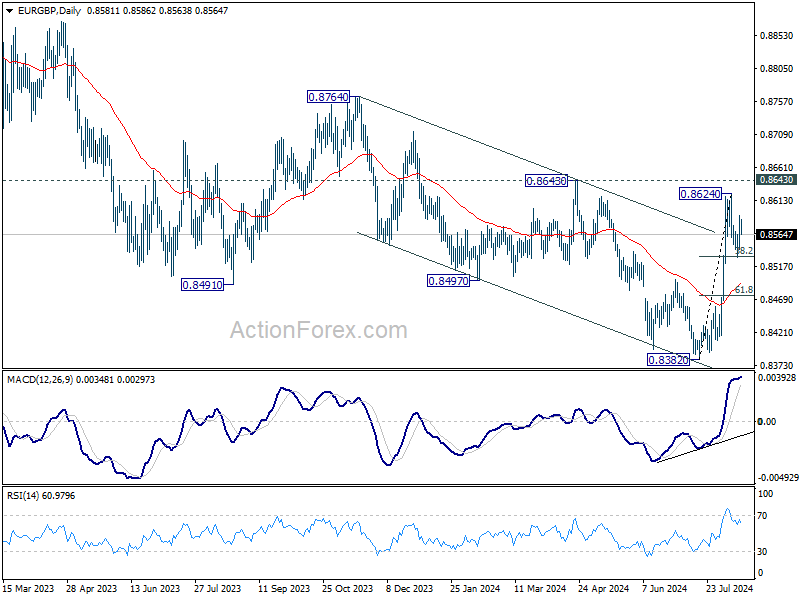
In the bigger picture, while the rebound from 0.8382 is strong, there is no confirmation of trend reversal yet. As long as 0.8643 resistance holds, down trend from 0.9267 could still resume through 0.8382 at a later stage. However, firm break of 0.8643 will indicate that such down trend has completed, and turn outlook bullish for 0.8764 resistance next.
EUR/AUD Daily Outlook
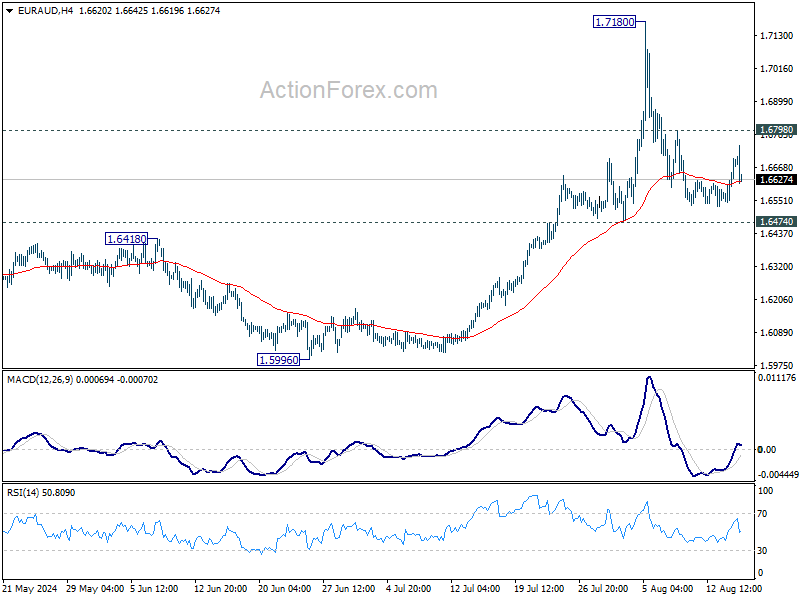
Daily Pivots: (S1) 1.6596; (P) 1.6648; (R1) 1.6748; More...
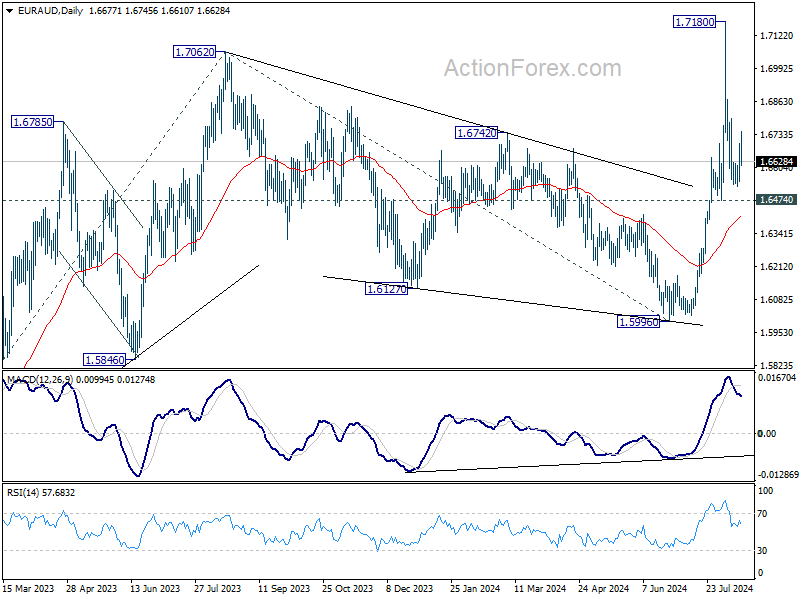
Intraday bias in EUR/AUD remains neutral as range trading continues. Outlook stays bullish with 1.6474 support intact. On the upside, above 1.6798 minor resistance will bring retest of 1.7180 resistance first. Firm break there will resume larger up trend to 1.7715 fibonacci projection level next. However, firm break of 1.6474 will dampen the bullish view and bring deeper pullback towards 1.5996 support.
In the bigger picture, corrective fall from 1.7062 medium term top should have completed at 1.5996. Larger up trend from 1.4281 (2022 low) is resuming. Next target is 61.8% projection of 1.4281 to 1.7062 from 1.5996 at 1.7715. This will now remain the favored case as long as 1.6474 support holds.
EUR/CHF Daily Outlook
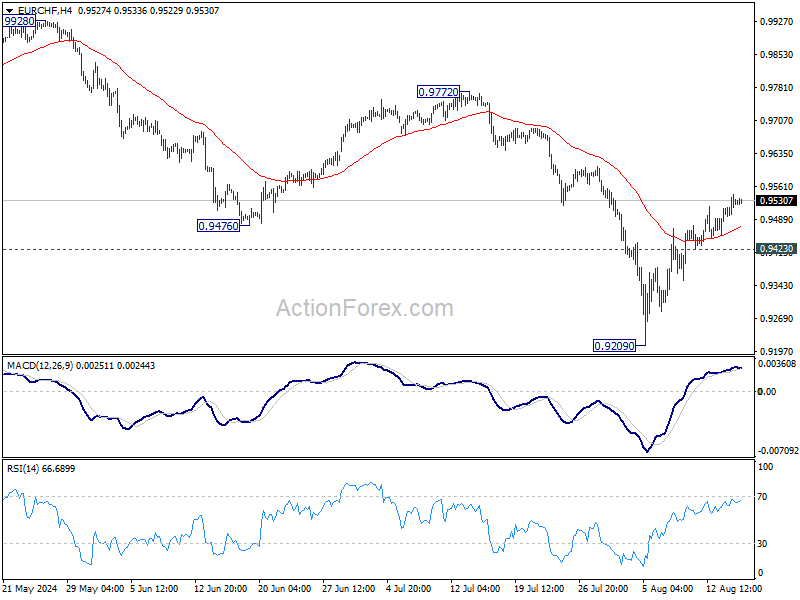
Daily Pivots: (S1) 0.9496; (P) 0.9521; (R1) 0.9521; More....
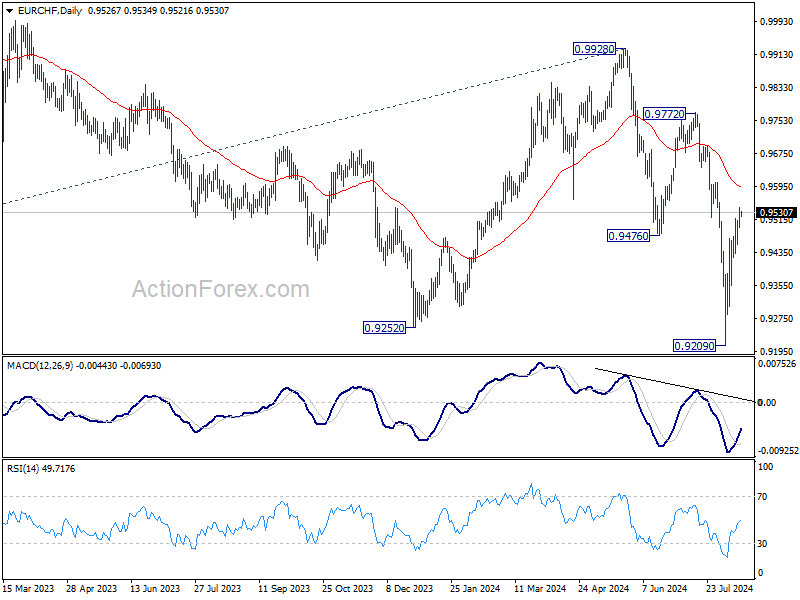
EUR/CHF's rebound from 0.9209 short term bottom is still in progress. Intraday bias stays on the upside for 55 D EMA (now at 0.9592). On the downside, below 0.9423 minor support will turn intraday bias neutral first.
In the bigger picture, medium term corrective pattern from 0.9407 (2022 low) might have completed with three waves to 0.9928. Decisive break of 0.9252 (2023 low) will confirm long term down trend resumption. Next target will be 61.8% projection of 1.1149 to 0.9407 from 0.9928 at 0.8851. For now, outlook will stay bearish as long as 0.9928 resistance holds, even in case of strong rebound.
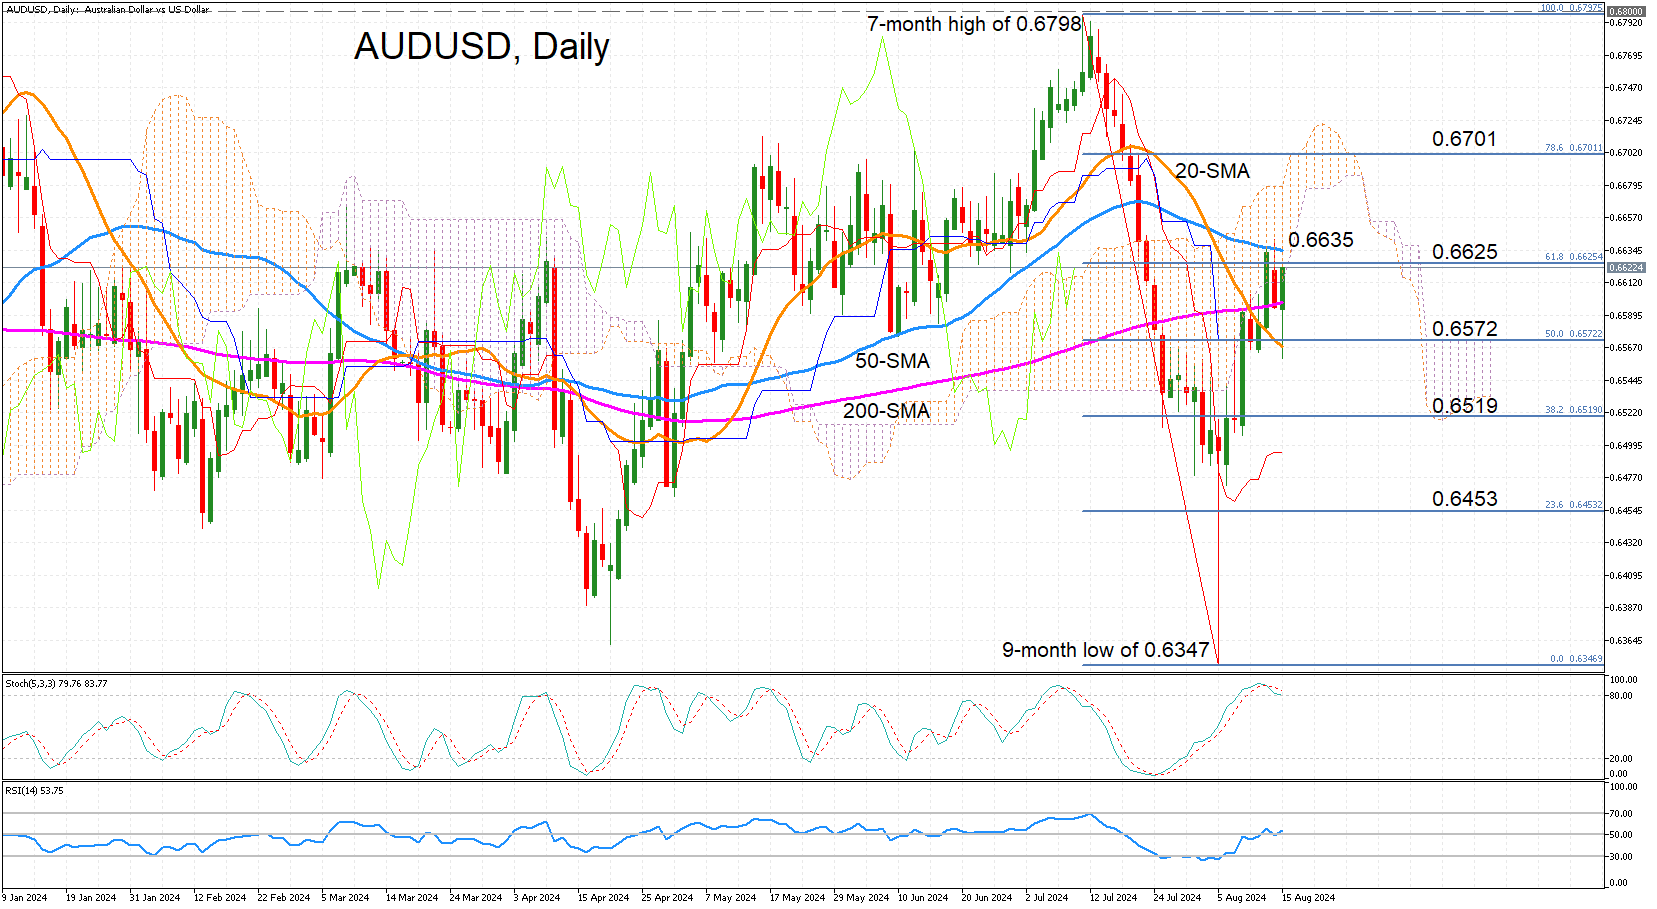
AUDUSD Rebound Gets Blocked by 50-Day SMA
- AUDUSD retraces 61.8% of the July-August selloff
- But meets tough resistance at 50-day SMA
AUDUSD has surged by around 4.5% from the August 5 low of 0.6347 but the recovery has hit a snag at the 50-day simple moving average (SMA) in the 0.6635 region. After two days of unsuccessful attempts to overcome this barrier, the price has now slipped below the 61.8% Fibonacci retracement of the July-August slump at 0.6625.
The technical indicators remain positive but are sending mixed signals about the near-term price action. The stochastic oscillator is in the overbought region and trending lower, suggesting some losses could be on the cards. But the RSI is ticking up just above 50, signalling that the recovery has more to go.
If the bulls manage to clear the 50-day SMA, the next key hurdle is likely to be the 0.6700 level, which corresponds with the 78.6% Fibonacci. Surpassing this would turn the focus to July’s seven-month high of 0.6798 when it came just shy of the 0.6800 mark.
However, if the upswing runs out of steam, there’s likely to be some support at the 20-day SMA, which is slightly below the 50% Fibonacci of 0.6572. Slipping below this level could accelerate the declines towards the 38.2% Fibonacci of 0.6519.
All in all, AUDUSD’s rebound seems secure for now, but a climb above the 50-day SMA is needed to shift the short-to-medium-term outlook to bullish, while a drop below the 20-day SMA could switch the pair back to bearish mode.
EUR/USD Daily Outlook
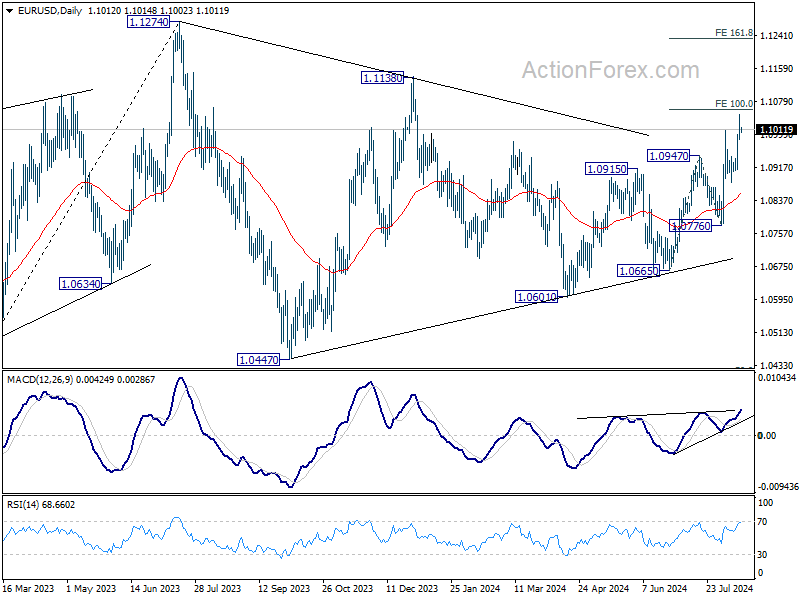
Daily Pivots: (S1) 1.0981; (P) 1.1014; (R1) 1.1046; More.....
Intraday bias in EUR/USD remains on the upside for the moment. Current rise from 1.0665 in in progress for 100% projection of 1.0665 to 1.0947 from 1.0776 at 1.1058. Decisive break there could prompt upside acceleration through 1.1138 resistance to 161.8% projection at 1.1232. On the downside, below 1.0985 minor support will turn intraday bias neutral first. But outlook will stay bullish as long as 1.0880 support holds.
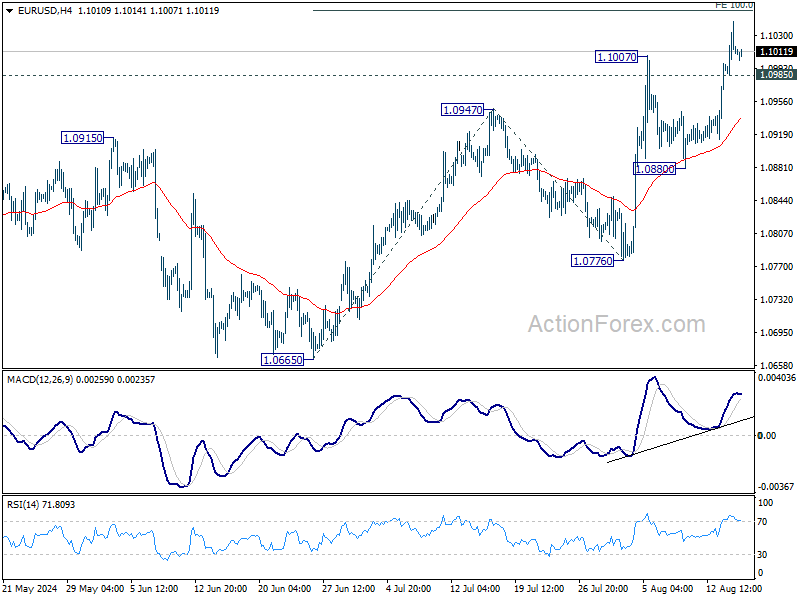
In the bigger picture, price actions from 1.1274 are viewed as a corrective pattern that's could still extend. Break of 1.1138 resistance will be the first signal that rise from 0.9534 (2022 low) is ready to resume through 1.1274 (2023 high). However, break of 1.0776 support will extend the correction with another falling leg back towards 1.0447 support.