
Sample Category Title
USD/JPY Mid-Day Outlook
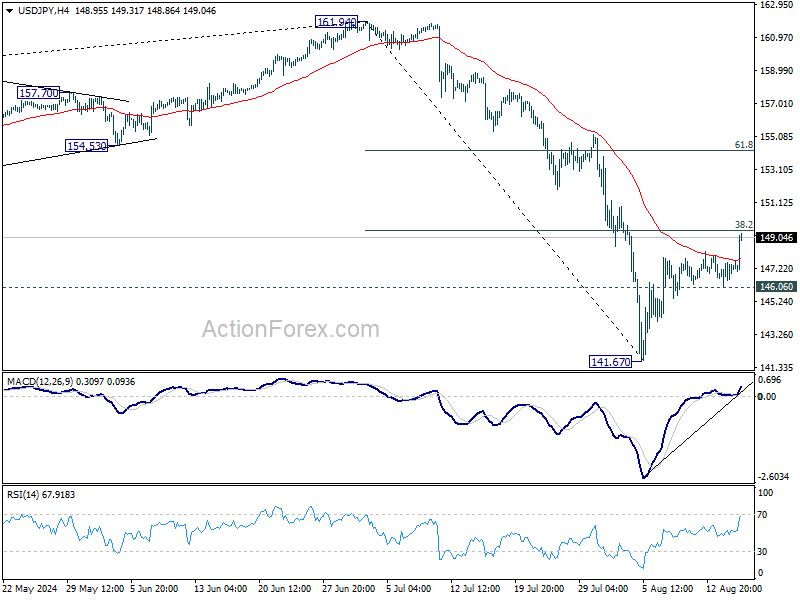
Daily Pivots: (S1) 146.40; (P) 147.00; (R1) 147.91; More...
Immediate focus is now on 38.2% retracement of 161.94 to 141.67 at 149.41 as USD/JPY's rebound from 141.67 extends. Decisive break there will bring stronger rally to 61.8% retracement at 154.19, even as a corrective move. On the downside, break of 146.06 minor support will suggest rejection by 149.91, and turn intraday bias back to the downside for retesting 141.67 low instead.
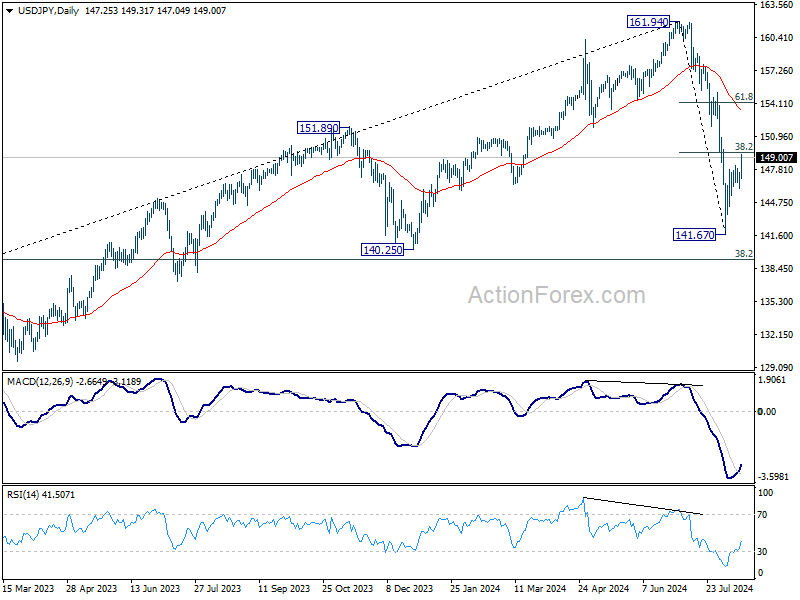
In the bigger picture, fall from 161.94 medium term is seen as correcting whole up trend from 102.58 (2021 low). Deeper decline could be seen to 38.2% retracement of 102.58 to 161.94 at 139.26, which is close to 140.25 support. In any case, risk will stay on the downside as long as 55 W EMA (now at 149.77) holds. Nevertheless, firm break of 55 W EMA will suggest that the range for medium term corrective pattern is already set.
USD/CHF Mid-Day Outlook
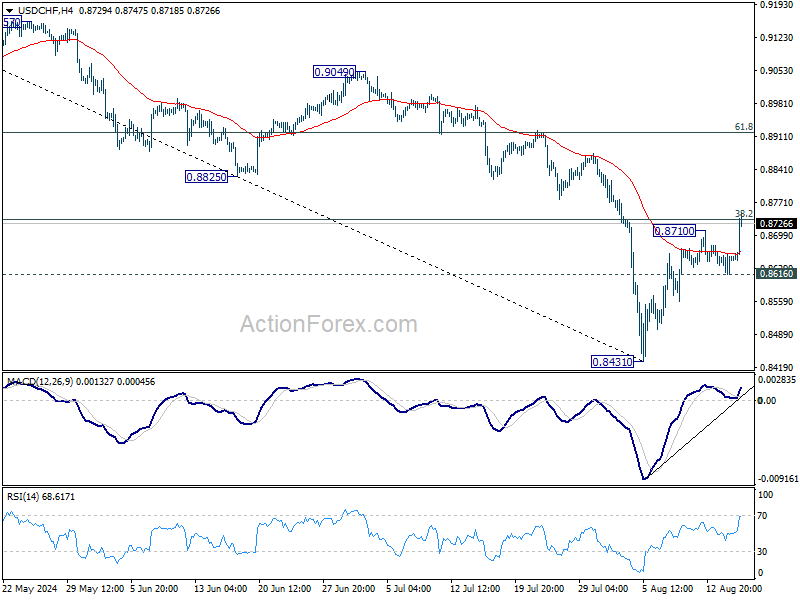
Daily Pivots: (S1) 0.8625; (P) 0.8643; (R1) 0.8669; More….
Intraday bias in USD/CHF is back on the upside as rise from 0.8413 resumed by breaking through 0.8710. Focus is now on 38.2% retracement of 0.9223 to 0.8431 at 0.8734. Sustained break there will bring stronger rally to 61.8% retracement at 0.8920, even as a corrective move. On the downside, break of 0.8616 will turn bias back to the downside for retesting 0.8431 low.
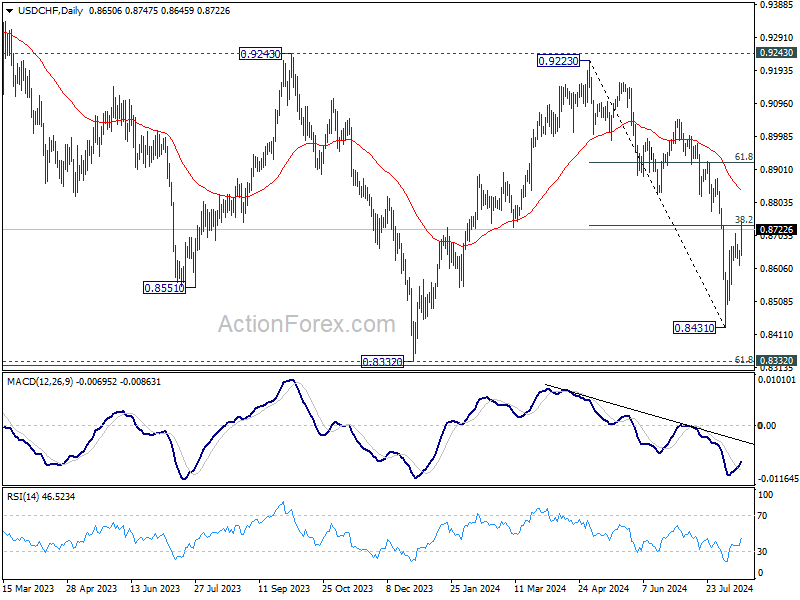
In the bigger picture, price actions from 0.8332 (2023 low) are currently seen as a medium term corrective pattern, with fall from 0.9223 as the second leg. Strong support could be seen from 0.8332 to bring rebound. Yet, overall outlook will continue to stay bearish as long as 0.9243 resistance holds. Firm break of 0.8332, however, will resume larger down trend from 1.0146 (2022 high).
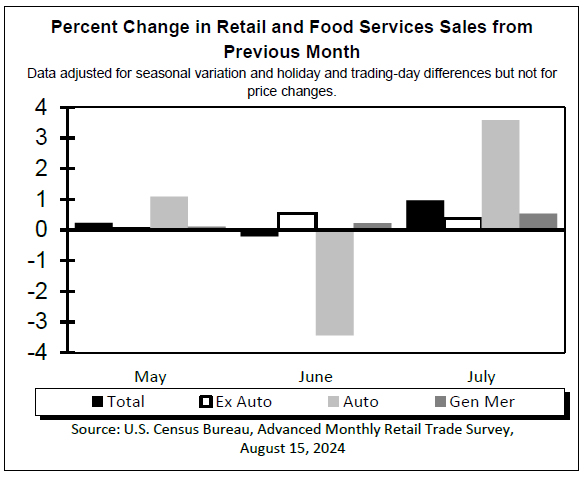
U.S. retail sales starts third quarter on an upbeat note
Retail sales rose 1.0% for the month of July. That was much higher than the consensus forecast calling for a more moderate increase of 0.4%. However, June's figure was revised downward to -0.2% month/month (previously flat).
Trade in the auto sector was up 3.6% m/m, as the increase at motor vehicle dealers (4.0%) was partially offset by the decline at automotive parts and accessory stores (-0.8%).
Sales at gasoline stations rose a marginal 0.1% m/m, breaking two consecutive months of sizeable declines. The building materials and equipment category rose by 0.9% m/m.
Sales in the retail sales "control group", which excludes the volatile components above (autos, building materials and gas) and is used to estimate personal consumption expenditures (PCE), rose 0.3% on the month after rising by 0.9% m/m in June.
- Among the control group, the largest positive contributions came from food and beverage stores (0.9% m/m), health and personal care stores (0.8%) and department stores (0.5% m/m).
- The largest declines were at miscellaneous stores retailers (-2.5% m/m) and sporting goods and hobby stores (-0.7% m/m).
Food services & drinking places – the only services category in the retail sales report –rose 0.3% m/m. June's data was also revised down to 0.1% (reported as 0.3% previously).
Key Implications
Retail sales opened up the third quarter on a better footing than it closed the second. The rebound suggests that despite mounting pressures on consumers' balance sheets (as savings dwindle and wage growth slows), the US consumer is not out yet. That said, consumer spending is still expected to slow as 2024 draws to a close.
The rebound in spending in July is unlikely to materially alter the outlook for a September rate cut. With employment continuing to slow and inflation more well-behaved in recent reports, it would take a much larger jolt form retail sales to alter the calculus for a cut. As such, for the remainder of the year we continue to expect three quarter-point rate cuts from the Fed (see Q&A).
GBP/USD Mid-Day Outlook
Daily Pivots: (S1) 1.2806; (P) 1.2838; (R1) 1.2857; More...
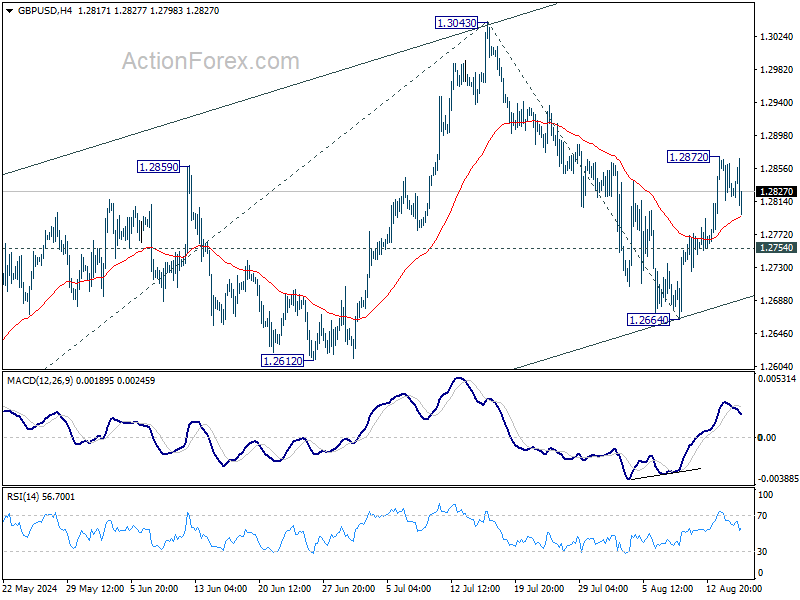
Intraday bias in GBP/USD is turned neutral with current retreat and some consolidations would be seen below 1.2872 temporary top. But further rise is in favor as long as 1.2754 minor support holds. As noted before, pullback from 1.3043 could have completed at 1.2664 already. Above 1.2872 will target a retest on 1.3043 resistance first. However, break of 1.2754 will turn bias back to the downside for 1.2664 support instead.
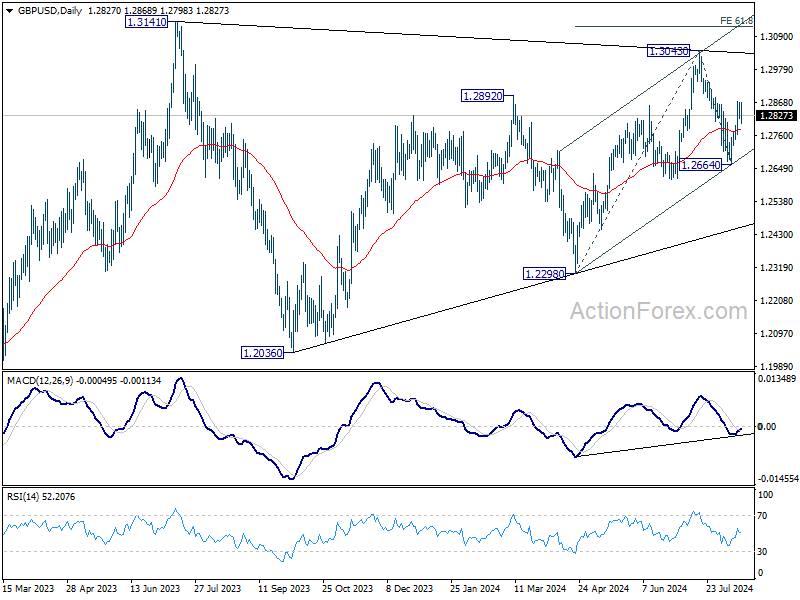
In the bigger picture, as long as 1.3141 resistance holds (2023 high), medium term corrective pattern from there could still extend with another falling leg. But even in that case, downside should be contained by 1.2036/2298 support zone. Meanwhile, decisive break of 1.3141 will confirm resumption of whole up trend from 1.0351 (2022 low).
EUR/USD Mid-Day Outlook
Daily Pivots: (S1) 1.0981; (P) 1.1014; (R1) 1.1046; More.....
Intraday bias in EUR/USD is turned neutral with current steep retreat. Some consolidations would be seen first. But another rally is in favor as long as 1.0880 support holds. Firm break of 100% projection of 1.0665 to 1.0947 from 1.0776 at 1.1058 could prompt upside acceleration through 1.1138 resistance to 161.8% projection at 1.1232. However, considering bearish divergence condition in 4H MACD, break of 1.0880 will suggest near term reversal and turn bias to the downside for 1.0776 support and below.
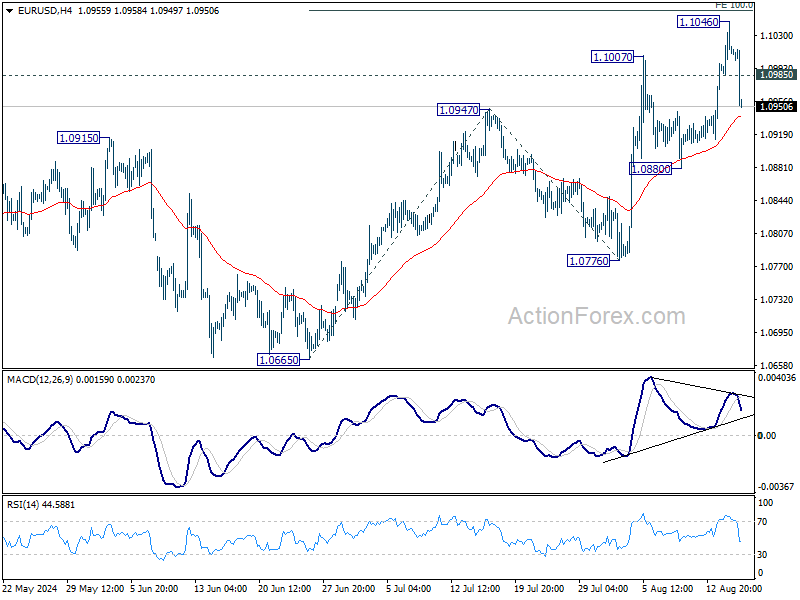
In the bigger picture, price actions from 1.1274 are viewed as a corrective pattern that's could still extend. Break of 1.1138 resistance will be the first signal that rise from 0.9534 (2022 low) is ready to resume through 1.1274 (2023 high). However, break of 1.0776 support will extend the correction with another falling leg back towards 1.0447 support.

Retail Sales Strength Sparks US Market Surge, Recession Fears Subside
The US markets reacted positively today to stronger-than-expected retail sales data, which posted its fastest growth in a year and a half. Additionally, better-than-expected jobless claims numbers helped alleviate concerns about weaknesses in the employment market. The robust rally in US futures, along with rising yields and a stronger Dollar, suggests that traders have temporarily set aside recession fears.
Following yesterday's CPI data, which met expectations, Fed remains on course to cut interest rates in September. However, the likelihood of a large rate cut has diminished. Fed fund futures are now pricing in only a 25% chance of a 50 basis point cut, down from over 50% just a few days ago.
In the currency markets, Australian Dollar stands out as the strongest performer of the day, buoyed by much stronger-than-expected employment data. However, despite the initial surge, there is no clear follow-through momentum yet. Dollar is the second strongest, supported by positive economic data in the early US session.
Conversely, the Japanese Yen is among the weakest, as its near-term pullback seems to be evolving into a broader reversal amid rising US and European benchmark yields. Swiss Franc also weakened, pressured by a shift to risk-on sentiment. Euro, British Pound, and Canadian Dollar are trading in a more neutral position.
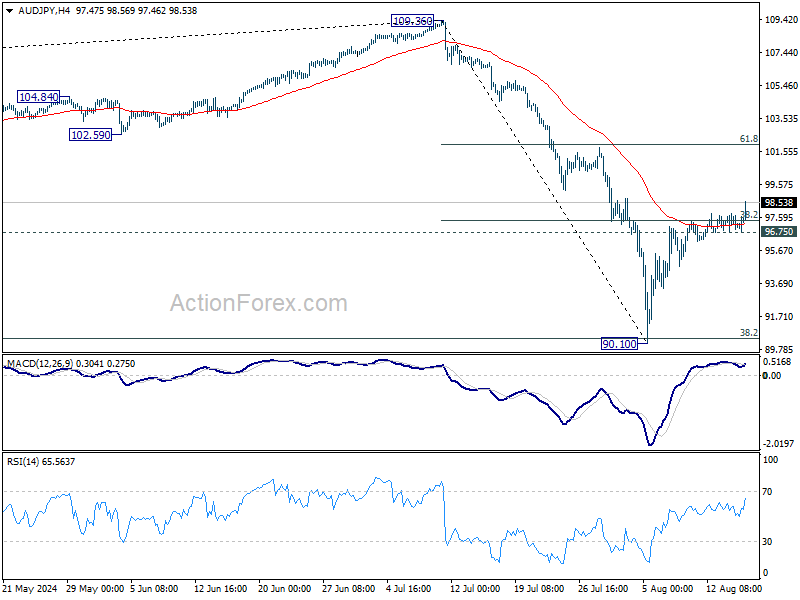
Technically, AUD/JPY is currently the biggest mover today, up more than 1%. The strong break of 38.2% retracement of 109.36 to 90.10 at 97.45 suggests that fall from 109.36 has completed at 90.10 already. Rebound from there is seen as the second leg of the medium term corrective pattern from 109.36. Further rise is now in favor as long as 96.75 minor support holds, to 61.8% retracement at 102.00 and possibly above.
In Europe, at the time of writing, FTSE is up 0.53%. DAX is up 1.11%. CAC is up 0.87%. UK 10-year yield is up 0.0845 at 3.913. Germany 10-year yield is up 0.055 at 2.240. Earlier in Asia, Nikkei rose 0.78%. Hong Kong HSI fell -0.02%. China Shanghai SSE rose 0.94%. Singapore Strait Times rose 0.90%. Japan 10-year JGB yield rose 0.0247 to 0.838.
US retail sales rose 1% mom in Jul, ex-auto sales up 0.4% mom
US retail sales rose 1.0% mom to USD 709.7B in July, above expectation of 0.3% mom. Ex-auto sales rose 0.4% mom to USD 576.1B, above expectation of 0.1% mom. Ex-gasoline sales rose 1.0% mom to USD 657.1B. Ex-auto& gasoline sales rose 0.4% mom to USD 523.4B.
Total sales for the May through July period rose 2.4% from the same period a year ago.
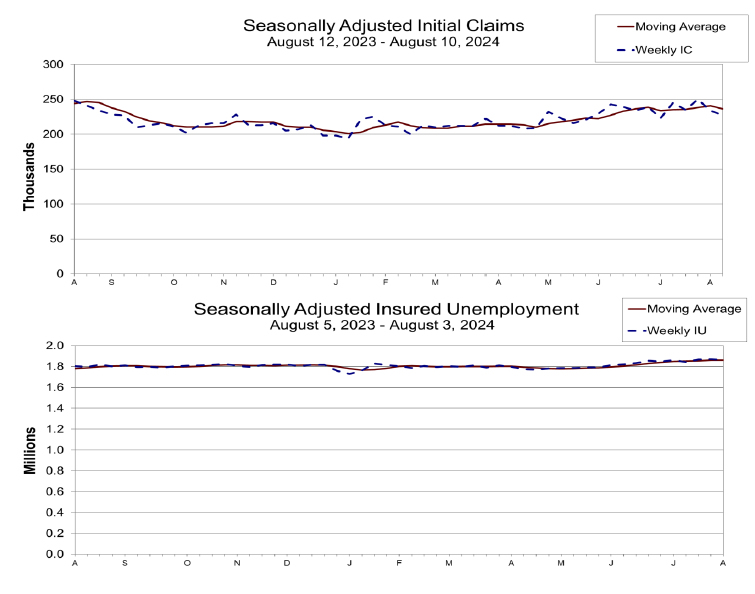
US initial jobless claims fall to 227k, vs exp 239k
US initial jobless claims fell -7k to 227k in the week ending August 10, lower than expectation of 239k. Four-week moving average of initial claims fell -4.5k to 236.5k.
Continuing claims fell -7k to 1864k in the week ending August 3. Four-week moving average of continuing claims rose 1k to 1862k, highest since November 27, 2021.
UK GDP flat in June, up 0.6% qoq in Q2
UK GDP showed no growth in June, matched expectations. Services output fell by -0.1% mom after five consecutive monthly increases. Production grew by 0.8% mom. Construction grew by 0.5% mom.
For Q2, GDP grew 0.6% qoq, matched expectations. Services grew by 0.8% qoq. Production fell -0.1% qoq. Construction also fell -0.1% qoq.
Japan's Q2 GDP grows 0.8% qoq on strong consumption and capital spending
Japan's economy showed stronger-than-expected growth in Q2, with real GDP rising by 0.8% qoq, surpassing the anticipated 0.6% qoq increase. On an annualized basis, GDP surged by 3.1%, well above the expected 2.1%. This marks a significant rebound after the sharp contraction experienced in Q1, and it is the first increase in two quarters.
The recovery was largely driven by a notable rise in private consumption, which increased by 1.0%. This is particularly significant as it follows four consecutive quarters of decline, a losing streak not seen since the aftermath of the 2008 financial crisis. Additionally, capital spending grew by 0.9%, marking its first gain in two quarters.
On a nominal basis, GDP increased by 1.8% in Q2, translating to an annualized rate of 7.4%. This growth pushed Japan's GDP above JPY 600T for the first time, a milestone attributed to the ongoing inflationary pressures driven by the weakening Yen.
Australia's employment surges 58.2k while unemployment rate ticks up
Australia's labor market showed robust growth in July, with employment rising by 58.2k, significantly surpassing expectations of 26.5k. This increase was driven by a strong gain in full-time employment, which rose by 60.5k, while part-time employment saw a slight decline of -2.3k.
Unemployment rate ticked up from 4.1% to 4.2%, slightly higher than the expected 4.1% and marking the highest level since November 2021. This increase in the unemployment rate comes alongside a rise in the participation rate, which climbed from 66.9% to a record high of 67.1%. Additionally, the employment-to-population ratio edged up by 0.1% to 64.3%, just shy of the historical high of 64.4% set in November of last year. Monthly hours worked also increased by 0.4% mom.
Kate Lamb, ABS head of labour statistics, noted that while the unemployment rate has increased by 0.1 percentage point in each of the past two months, the record high participation rate and near-record employment-to-population ratio indicate that "there continues to be a high number of people in jobs, and looking for and finding jobs."
RBNZ's Orr signals careful and measured rate reductions
RBNZ Governor Adrian Orr outlined the central bank's approach to its recent monetary policy shift in an interview with Bloomberg TV today. Following the unexpected rate cut that initiated the easing cycle yesterday, Orr emphasized that RBNZ intends to lower interest rates toward a more neutral setting at a "careful and measured pace." This strategy is aimed at ensuring that inflation expectations remain firmly anchored at the 2% target, which Orr stated is the central bank's "single focus."
Orr expressed confidence in the central bank's course of action, noting that key indicators of inflation pressures are moving in the right direction. RBNZ has been closely monitoring "price-setting behavior," "inflation expectations," and "domestic homegrown inflation components." According to Orr, all these factors are now aligned with the goal of restoring "low and stable inflation" over the next couple of years.
Furthermore, Orr highlighted that various economic indicators are pointing toward a positive outlook for growth. "We see positive economic growth coming and we can be easing interest rates," he said, expressing optimism that New Zealand could achieve "growth without the inflation."
China's industrial production slows while retail sales beat expectations
China's economic data for July revealed a mixed picture, with industrial production growth continuing to decelerate while retail sales showed unexpected strength. Industrial production rose by 5.1% yoy, down from 5.3% in June and missing the expected 5.2%. This also marks the third consecutive month of slowing growth.
On a more positive note, retail sales increased by 2.7% yoy, accelerating from the previous month's 2.0% and exceeding expectations of 2.6%.
However, fixed asset investment growth also disappointed, rising by 3.6% year-to-date compared to the same period last year, below the anticipated 3.9%.
EUR/USD Mid-Day Outlook
Daily Pivots: (S1) 1.0981; (P) 1.1014; (R1) 1.1046; More.....
Intraday bias in EUR/USD is turned neutral with current steep retreat. Some consolidations would be seen first. But another rally is in favor as long as 1.0880 support holds. Firm break of 100% projection of 1.0665 to 1.0947 from 1.0776 at 1.1058 could prompt upside acceleration through 1.1138 resistance to 161.8% projection at 1.1232. However, considering bearish divergence condition in 4H MACD, break of 1.0880 will suggest near term reversal and turn bias to the downside for 1.0776 support and below.
In the bigger picture, price actions from 1.1274 are viewed as a corrective pattern that's could still extend. Break of 1.1138 resistance will be the first signal that rise from 0.9534 (2022 low) is ready to resume through 1.1274 (2023 high). However, break of 1.0776 support will extend the correction with another falling leg back towards 1.0447 support.
Economic Indicators Update
| GMT | Ccy | Events | Actual | Forecast | Previous | Revised |
|---|---|---|---|---|---|---|
| 23:50 | JPY | GDP Q/Q Q2 P | 0.80% | 0.60% | -0.50% | |
| 23:50 | JPY | GDP Deflator Y/Y Q2 P | 3.00% | 2.60% | 3.40% | |
| 01:00 | AUD | Consumer Inflation Expectations Aug | 4.50% | 4.30% | ||
| 01:30 | AUD | Employment Change Jul | 58.2K | 26.5K | 50.2K | 52.3K |
| 01:30 | AUD | Unemployment Rate Jul | 4.20% | 4.10% | 4.10% | |
| 02:00 | CNY | Industrial Production Y/Y Jul | 5.10% | 5.20% | 5.30% | |
| 02:00 | CNY | Retail Sales Y/Y Jul | 2.70% | 2.60% | 2.00% | |
| 02:00 | CNY | Fixed Asset Investment YTD Y/Y Jul | 3.60% | 3.90% | 3.90% | |
| 04:30 | JPY | Industrial Production M/M Jun F | -4.20% | -3.60% | -3.60% | |
| 06:00 | GBP | GDP M/M Jun | 0.00% | 0.00% | 0.40% | |
| 06:00 | GBP | GDP Q/Q Q2 P | 0.60% | 0.60% | 0.70% | |
| 06:00 | GBP | Industrial Production M/M Jun | 0.80% | 0.10% | 0.20% | 0.30% |
| 06:00 | GBP | Industrial Production Y/Y Jun | -1.40% | -2.10% | 0.40% | |
| 06:00 | GBP | Manufacturing Production M/M Jun | 1.10% | 0.10% | 0.40% | 0.30% |
| 06:00 | GBP | Manufacturing Production Y/Y Jun | -1.50% | -2.40% | 0.60% | 0.40% |
| 06:00 | GBP | Goods Trade Balance (GBP) Jun | -18.9B | -16.0B | -17.9B | -18.6B |
| 06:30 | CHF | Producer and Import Prices M/M Jul | 0.00% | 0.20% | 0.00% | |
| 06:30 | CHF | Producer and Import Prices Y/Y Jul | -1.70% | -1.70% | -1.90% | |
| 12:30 | CAD | Wholesale Sales M/M Jun | -0.60% | -0.60% | -0.80% | -1.20% |
| 12:30 | USD | Initial Jobless Claims (Aug 9) | 227K | 239K | 233K | 234K |
| 12:30 | USD | Retail Sales M/M Jul | 1.00% | 0.30% | 0.00% | |
| 12:30 | USD | Retail Sales ex Autos M/M Jul | 0.40% | 0.10% | 0.40% | |
| 12:30 | USD | Import Price Index M/M Jul | 0.10% | 0.00% | 0.00% | |
| 12:30 | USD | Empire State Manufacturing Index Aug | -4.7 | -5.9 | -6.6 | |
| 12:30 | USD | Philadelphia Fed Survey Aug | -7 | 6.6 | 13.9 | |
| 13:15 | USD | Industrial Production M/M Jul | 0.10% | 0.60% | ||
| 13:15 | USD | Capacity Utilization Jul | 78.60% | 78.80% | ||
| 14:00 | USD | Business Inventories Jun | 0.30% | 0.50% | ||
| 14:00 | USD | NAHB Housing Market Index Aug | 43 | 42 | ||
| 14:30 | USD | Natural Gas Storage | 43B | 21B |
US initial jobless claims fall to 227k, vs exp 239k
US initial jobless claims fell -7k to 227k in the week ending August 10, lower than expectation of 239k. Four-week moving average of initial claims fell -4.5k to 236.5k.
Continuing claims fell -7k to 1864k in the week ending August 3. Four-week moving average of continuing claims rose 1k to 1862k, highest since November 27, 2021.
US retail sales rose 1% mom in Jul, ex-auto sales up 0.4% mom
US retail sales rose 1.0% mom to USD 709.7B in July, above expectation of 0.3% mom. Ex-auto sales rose 0.4% mom to USD 576.1B, above expectation of 0.1% mom. Ex-gasoline sales rose 1.0% mom to USD 657.1B. Ex-auto& gasoline sales rose 0.4% mom to USD 523.4B.
Total sales for the May through July period rose 2.4% from the same period a year ago.
Nasdaq 100: Bears May Still Be Lurking Around the Corner
- The market seems to be focused now on growth-related macro data rather than inflation risk.
- Another softer US retail sales may spark another recession aka hard-landing fear.
- The rise of the VVIX / VIX ratio may see another potential spike in the VIX.
- Watch the 19,230 key short-term resistance on the Nasdaq 100.
In July, the Nasdaq 100 was the worst-performing benchmark US stock indices where it recorded a monthly loss of -1.6% versus the S&P 500 (+1.1%), Dow Jones Industrial Average (+4.4%), and Russell 2000 (+10%).
In addition, the global synchronized risk-off behaviour that took shape in the past three weeks led to a larger drawdown in the Nasdaq 100 versus other US stock indices as it plummeted by -16% from its July high to 5 August 2024 low as momentum-driven strategies trimmed their long positions on US mega-cap technology stocks that have a significant combined weightage in the Nasdaq 100.
Since the climatic sell-off seen in global stock indices on Monday, 5 August, the implied volatility of the S&P 500, the VIX has declined from a 52-week high of 65.73 to 16.20 on Wednesday, 14 August has led to a return of risk appetite; the Nasdaq 100 rebounded by 9% so far from its 5 August low.
However, at least in the short term, three factors may pause the current rally seen in the Nasdaq 100.
The hard landing scenario alarm bell may ring again if US retail sales disappoint
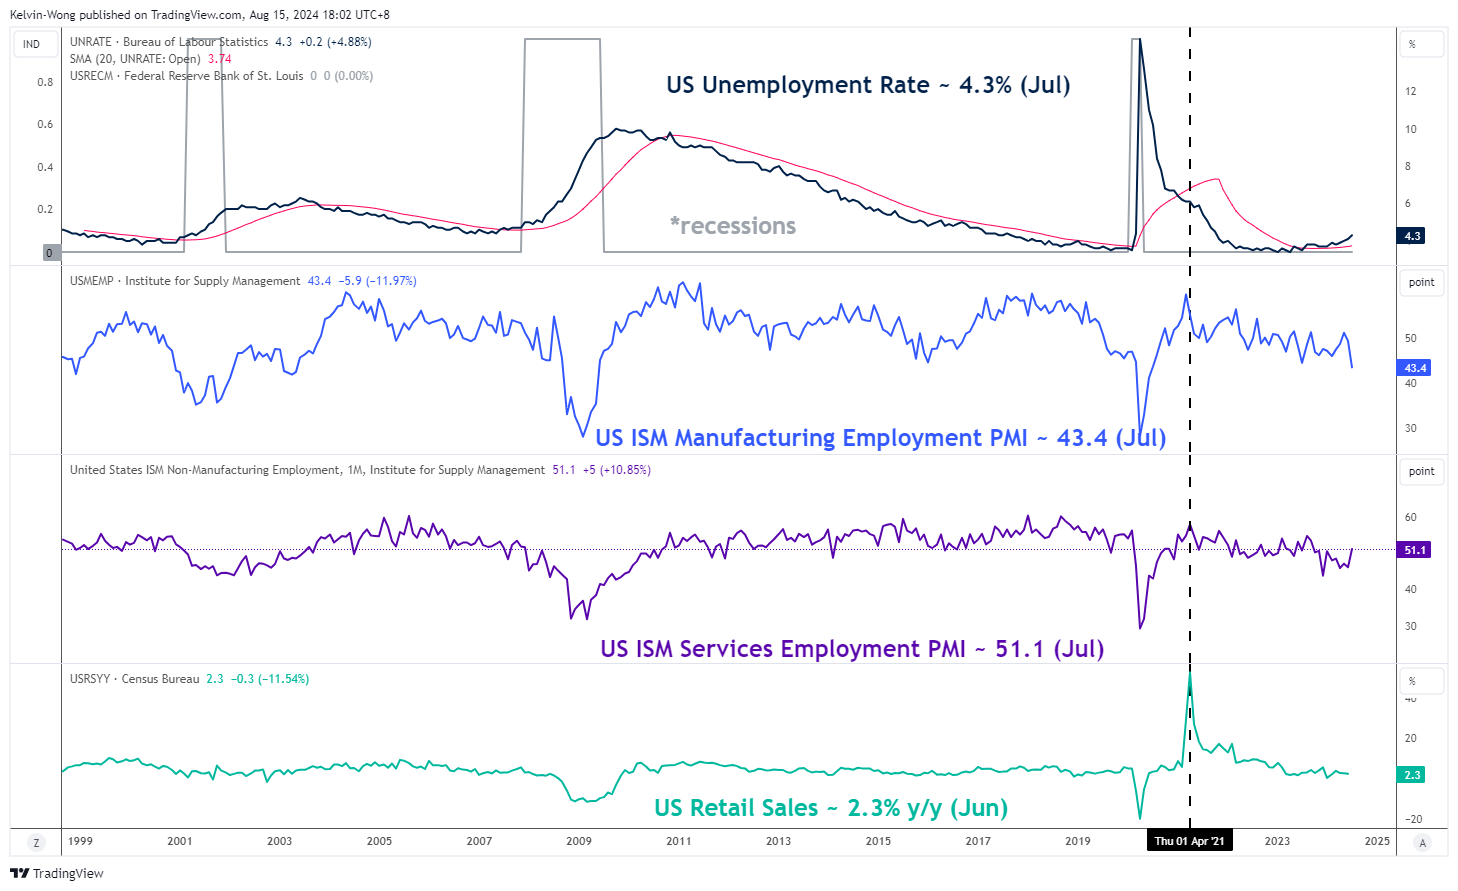
Fig 1: US Unemployment Rate, ISM Manufacturing/Services Employment PMI & Retail Sales trends (Source: Trading View, click to enlarge chart)
Despite a soft July US CPI print released on Wednesday, 15 August that indicated the inflationary trend in the US continued its deceleration path, it did not yield its prior positive impact on the Nasdaq 100 as the Nasdaq 100 underperformed (almost unchanged) versus the S&P 500 (+0.38%).
Hence, the market seems to be more focused on economic growth-related macro data now rather than inflation risk due to the fear of a US recession or hard-landing scenario that may be already in motion with the US Federal Reserve being late on embarking its interest rate cut cycle.
The next key US growth-focused data will be retail sales for July which is out later today; so far it has been on a path of slower growth since the March print of 3.6%, if the July number comes in lower than the 2.3% y/y recorded in June, it will be the fourth consecutive month of a growth slowdown in consumer spending which may bring the recession aka hard-landing scenario in the US back to the forefront again.
The volatility of implied volatility (VVIX) is falling at a slower pace
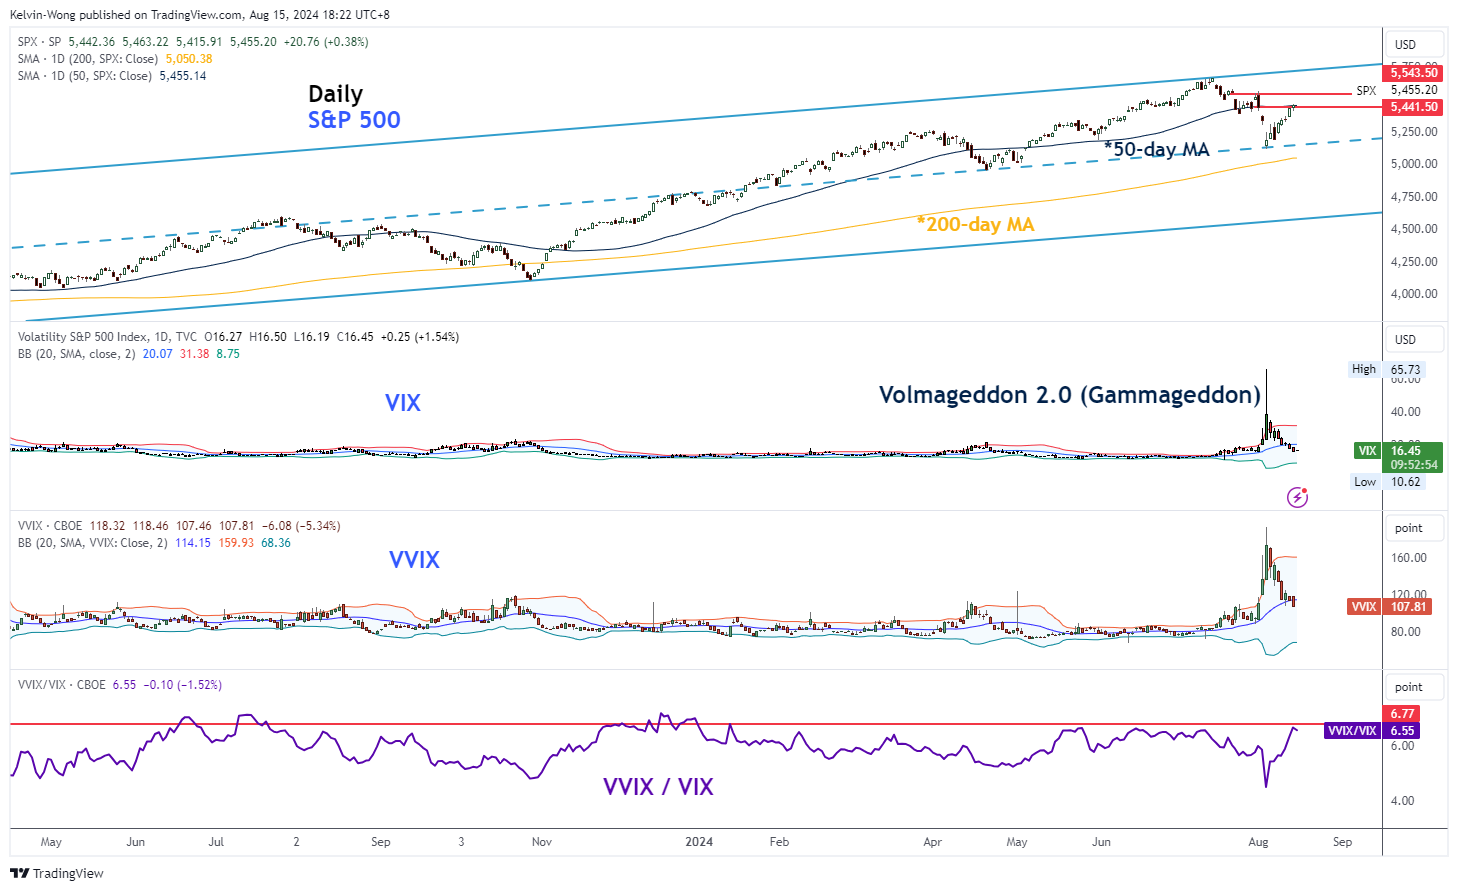
Fig 2: VVIX & VIX medium-term trends as of 15 Aug 2024 (Source: Trading View, click to enlarge chart)
In the past two weeks since 5 August, the implied volatility of the S&P 500 (VIX) has fallen but the pace of the higher-order implied volatility of the VIX (VVIX) has declined at a slower pace than the VIX.
Therefore, the VVIX / VIX ratio has increased since 5 August which suggests that there is still a degree of uncertainty in the US stock market. Right now, the VVIX / VIX ratio is at 6.59 at this time of the writing, just a whisker away from a significantly high level of 6.77 that led to past multi-week and multi-month corrective decline sequences in the S&P 500; for example, from 27 Jul 2023 to 27 October 2023.
Hence, the risk of another spike in the VIX cannot be ruled out.
Short-term bullish momentum has waned in the Nasdaq 100
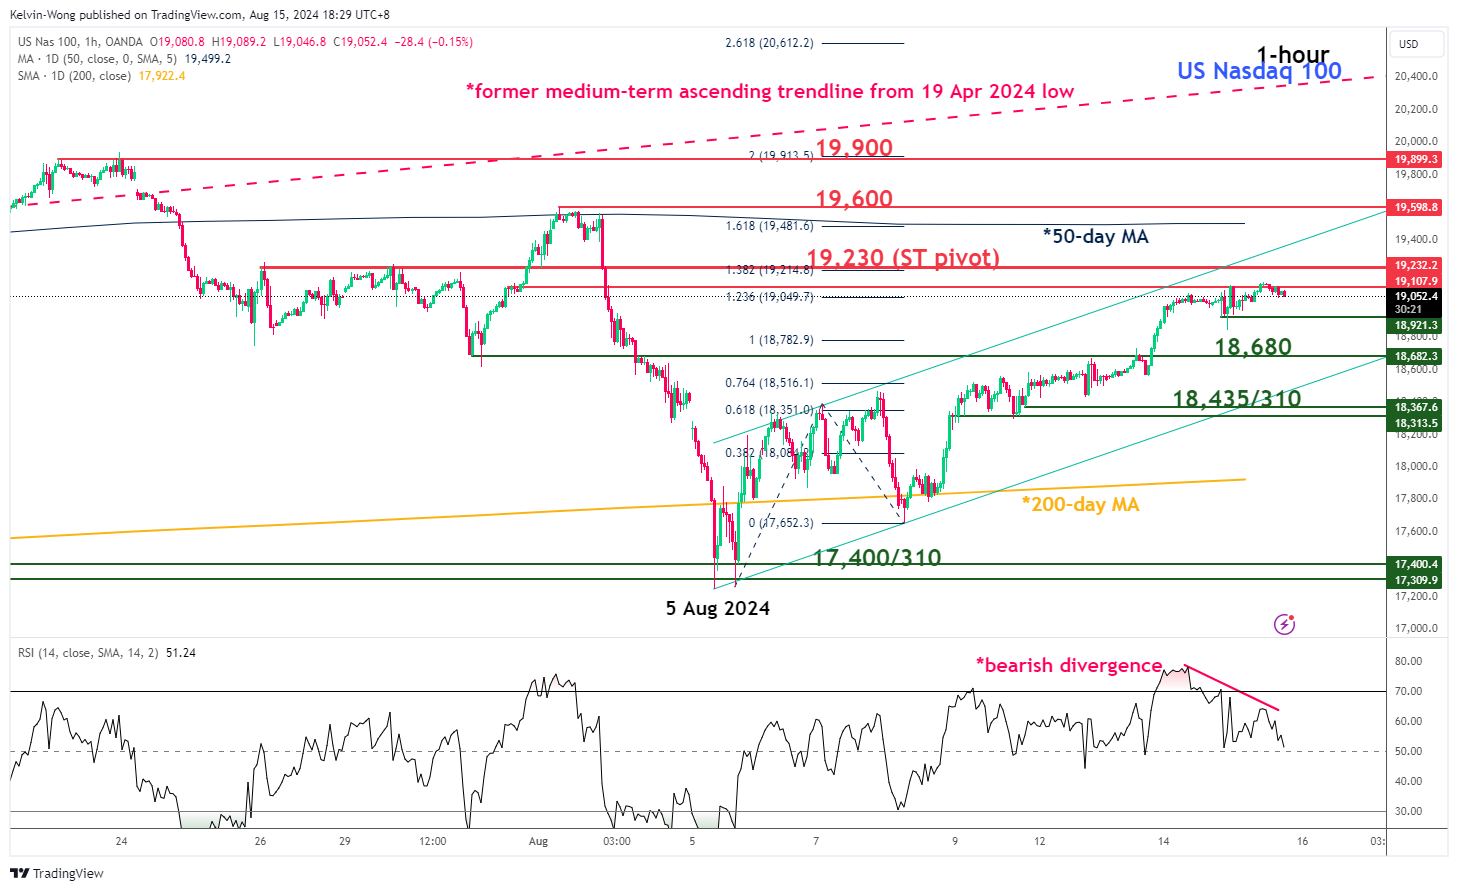
Fig 3: Nasdaq 100 CFD short-term trend as of 15 Aug 2024 (Source: Trading View, click to enlarge chart)
In the lens of technical analysis, the short-term bullish momentum of the minor uptrend phase for the Nasdaq 100 CFD (a proxy of Nasdaq 100 E-mini futures) has started to show signs of exhaustion via the recent bearish divergence condition flashed out by the hourly RSI momentum indicator at its overbought region.
If the 19,230 short-term pivotal resistance is not surpassed to the upside, the Nasdaq 100 CFD faces the risk of a near-term corrective decline to expose the intermediate supports of 18,680 and 18,435/310.
On the flip side, a clearance above 19,230 invalidates the bearish scenario for the continuation of the uptrend phase for the next intermediate resistances to come in at 19,600 and 19,900.
Gold (XAU/USD) Bounces Back After US CPI, DXY Faces Challenges
- Gold prices rebounded after a post-CPI selloff, aided by a struggling US Dollar Index.
- A sustained move above $2500/oz for gold may require an additional catalyst, like geopolitical risks.
- The DXY faces challenges and is likely to remain subdued, with technical indicators suggesting a potential retracement. Will it Materialize?
Gold prices rebounded after a post-CPI selloff that pushed the precious metal down to around $2438/oz. The US Dollar Index (DXY) struggles aided gold’s recovery in the latter part of the US session, a trend that has persisted into the London open.
Yesterday’s selloff was somewhat unexpected, given that US CPI figures were below expectations. Market participants reduced their rate cut expectations, which may have contributed to the dip in gold prices.
It’s likely that a portion of the anticipated interest rate cuts has already been factored in by the market. However, the extent of this pricing remains uncertain, and market participants are expected to stay cautious as gold approaches the $2500/oz mark.
While rate cuts generally benefit the non-yielding precious metal, a sustained move above the $2500/oz level may require an additional catalyst, such as geopolitical risks. Even then, the move might not be sustainable.
US Dollar Index (DXY)
The US Dollar Index (DXY) remains muted in early trading, persistently hovering below the 102.64 resistance level. Market participants appear satisfied with current inflation figures, shifting the focus to whether the Federal Reserve will implement a 25 or 50 basis point cut in September.
The DXY is grappling to recover some of its recent losses, and this struggle seems likely to persist. Technically, the DXY shows potential for a retracement, but the dominating influence of fundamental factors may limit any significant recovery.
US Dollar Index Daily Chat, August 15, 2024
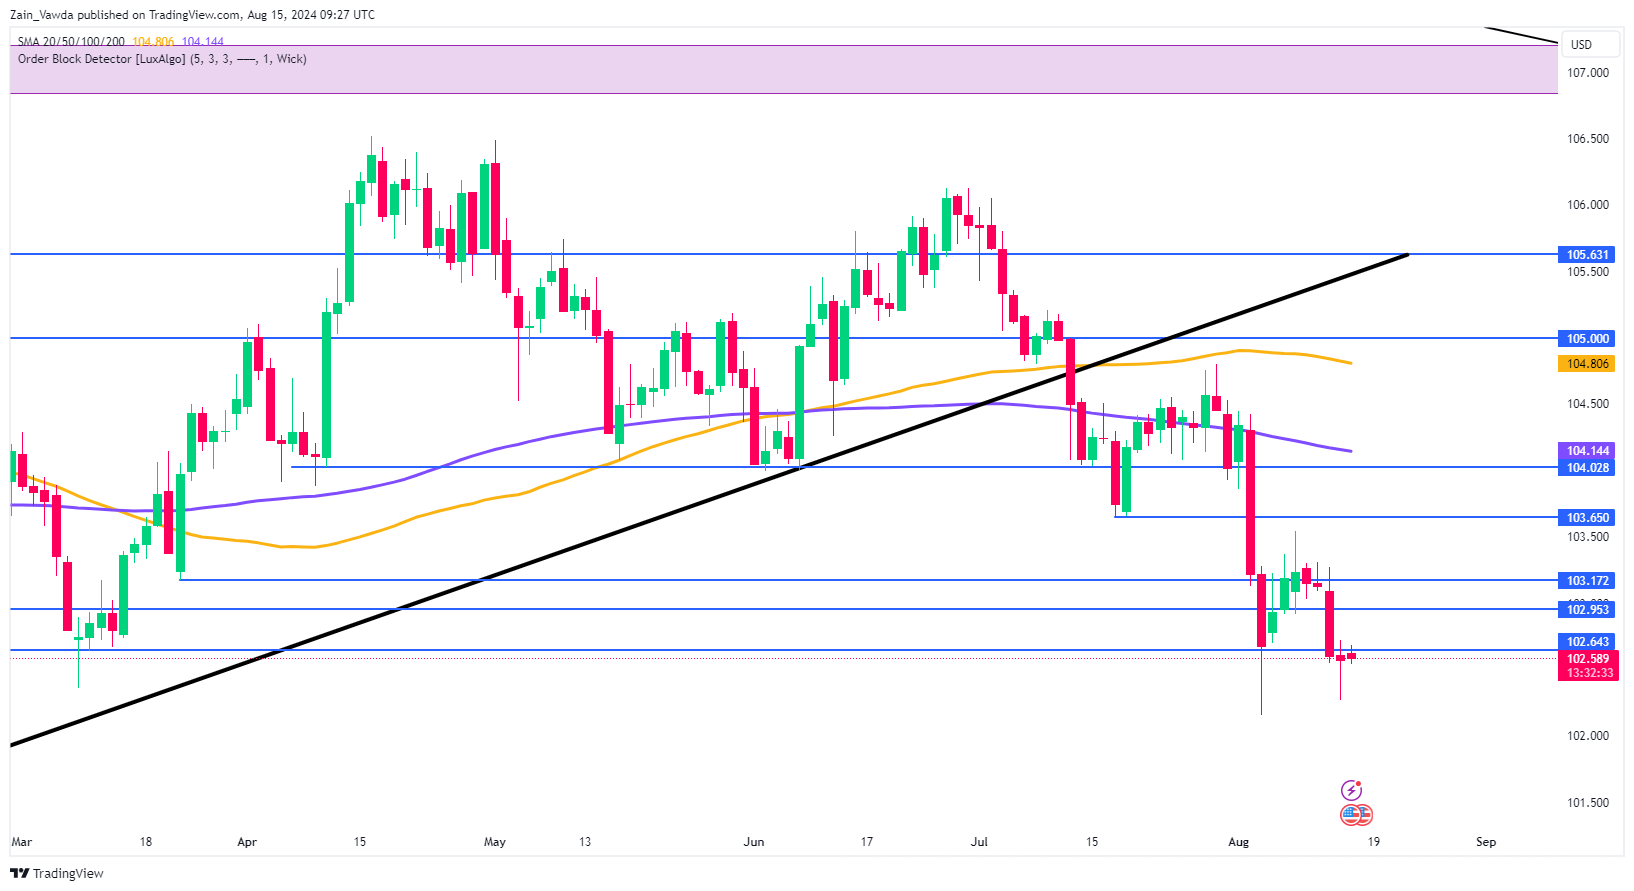
Source:TradingView.com
Support
- 102.40
- 101.20
- 100.26 (200-day MA)
Resistance
- 103.00
- 103.65
- 104.00
Economic Data Ahead
Several significant data releases this week could affect the US Dollar, and consequently, gold prices. Today, we expect the US industrial production data, followed by tomorrow’s US housing starts and the preliminary University of Michigan Sentiment data.
Additionally, some Federal Reserve policymakers are scheduled to speak, although these events are unlikely to cause any substantial shifts in the US Dollar regardless of the outcomes.
Technical Analysis Gold (XAU/USD)
From a technical perspective, gold aims to recover from consecutive losing days. Despite closing in the red yesterday, the precious metal reached a fresh high of 2480.00 before the selloff commenced.
Examining the daily chart, we observe a pattern of higher lows and higher highs, although breaking above 2480 has been challenging. The price range of 2350 to 2500, established since early July, is likely to persist until the Federal Reserve’s September meeting.
On an intraday basis, key resistance levels are at 2472 and 2480, while crucial support levels to watch are at 2450 and yesterday’s low of 2438. Keep in mind that with upcoming US data, any move above the 2480 level is unlikely to be sustained, as buying pressure for the precious metal remains strong.
GOLD (XAU/USD) Daily Chart, August 15, 2024
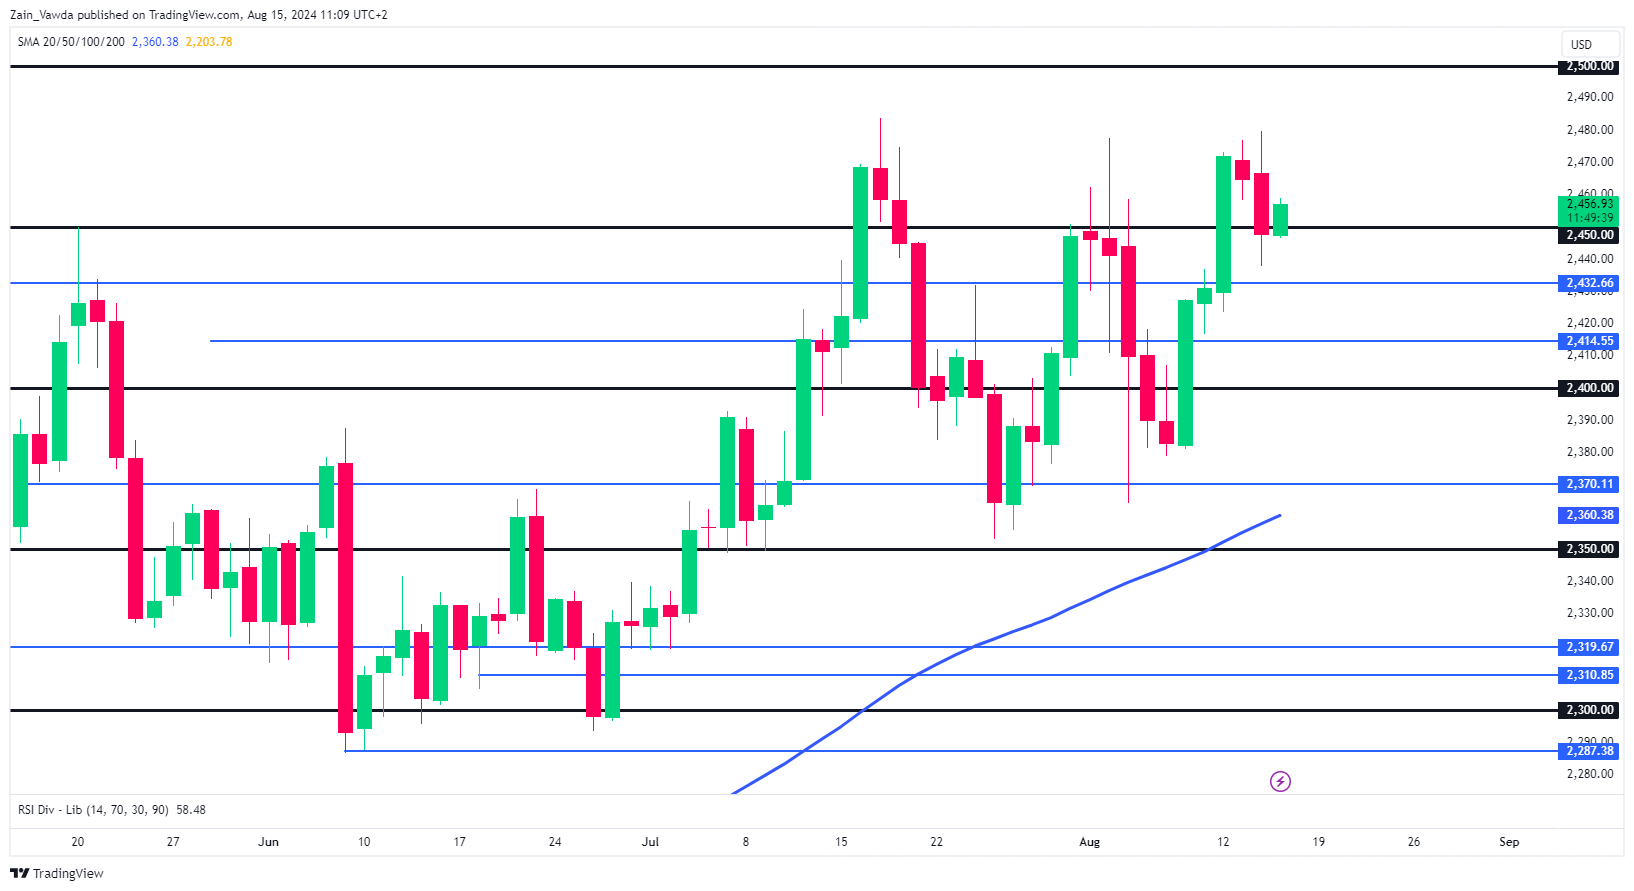
Source: TradingView (click to enlarge)
Support
- 2450
- 2438
- 2432
Resistance
- 2472
- 2480
- 2500