Sample Category Title
New Zealand BNZ manufacturing rises to 44, 17th month of contraction
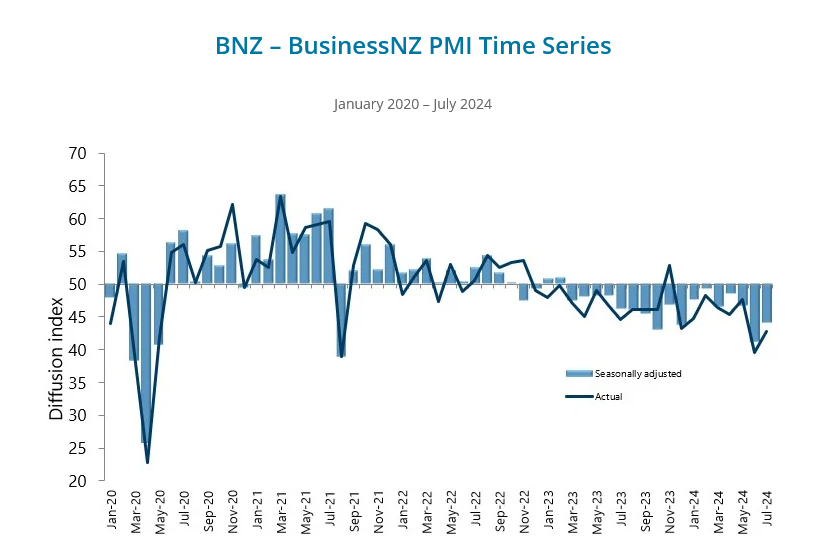
New Zealand's manufacturing sector showed a slight improvement in July, with the BusinessNZ Performance of Manufacturing Index rising from 41.2 to 44.0. Despite this rebound, the sector remains deeply entrenched in contraction, marking its 17th consecutive month below the expansion threshold. The current level is still significantly below the long-term average of 52.6.
Breaking down the data, production saw an uptick, increasing from 35.7 to 43.4, while new orders also rose, moving from 39.0 to 42.5. However, employment in the sector continued to decline, slipping from 44.0 to 43.1. Finished stocks decreased from 47.7 to 46.5, and deliveries fell slightly from 44.8 to 44.3.
Despite the relative improvement in activity, the proportion of negative comments from respondents remained high, though it eased slightly to 71.1% in July from 76.3% in June. Businesses cited ongoing issues such as a lack of orders, customers, and sales, which have been persistent concerns in recent months.
BNZ's Senior Economist Doug Steel commented that "manufacturing activity will turn when the broader economy turns." He added that easing monetary conditions, including a lower OCR, could help stimulate a general pick-up in sales, but emphasized that this recovery would take time.
Skating to Where the Puck Used to Be
Data revisions have partly undercut the RBA's narrative of lower aggregate supply than expected. The RBA will need to skate to where the labour market is going to go, not where it used to be.
Recent events have not materially changed our view about the outlook for the Australian economy. Recent communication from the RBA has, however, changed our minds about how the RBA is seeing things and how it will respond to the data. While it is still possible that the RBA Board will change its mind, RBNZ-style, and pivot sooner than our current base-case expectation, we suspect that fast backflips are not in the RBA’s breakdancing repertoire.
Recall our earlier observation that the RBA had concluded that the labour market was tighter than it had previously thought, even though all bar one of the indicators in its labour market dashboard eased between May and August.
Deputy Governor Hauser’s speech earlier in the week addressed this to some extent. The upshot of the speech is that, because inflation has recently overshot the RBA’s earlier forecasts, it must be that demand is stronger than it thought, or supply is weaker, or a combination of the two. As Westpac Economics colleague Senior Economist Pat Bustamante and I noted earlier this week (PDF 427KB), though, the net surprise on the June quarter 2024 trimmed mean inflation forecasts since the RBA’s November forecast round was in fact roughly zero. In some respects, the RBA is seeking to explain the forecast miss for the September quarter 2023. We are now halfway through the September quarter 2024.
We are reminded of the famous quote from ice hockey legend Wayne Gretsky, to ‘skate to where the puck is going, not to where it has been’. Inferring a lower level of aggregate supply currently from a forecast miss that mainly happened a year ago feels a bit like skating to where the puck used to be quite a while ago.
Yesterday’s labour force results highlighted how quickly that puck can move. As Westpac Economics colleague Economist Ryan Wells reported, the labour force participation rate in July was the highest recorded in more than a century. This represents a significant boost to labour supply.
In addition, following up on a key point of Pat’s and my note, the re-benchmarking of quarterly hours worked reported in the July labour force release also works against the RBA’s thesis of weak productivity dragging on supply. Recall that the RBA revised down its forecast for year-ended productivity growth in the June quarter by a full percentage point between its May and August forecast rounds. As far as we can tell, this was largely because of an outsized reading for June quarter hours worked.
The re-benchmarking changed the story considerably. Growth in total hours worked was previously reported as 0.4% over the year to the June quarter (0.2% for non-farm hours, which is more relevant to the measure of productivity in the RBA forecasts). Each of the quarters in that year has been revised down at least a little. Hours worked are now reported to have been essentially flat compared with a year previously (and –0.2% for non-farm).
This 0.4 percentage point revision in hours worked over the year eliminates a considerable fraction of the rationale for the RBA’s downward revision to its forecast for productivity growth. Even a small upside surprise on June quarter GDP growth, or revisions to recent history, would close the gap further.
Flat hours worked in the face of a strong rise in the number of people participating in the workforce does look a lot like growth in labour supply outstripping labour demand and building up some spare capacity.
It is no surprise that labour supply has been so strong. With the cost of living having risen so much, people need the extra work to earn more money. A separate (and more lagged) ABS release, the Labour Accounts, shows that the share of people with a second job has risen to new highs. This is an example of what economists call an ‘income effect’, where labour supply rises when real hourly wages fall. It stands in contrast to the ‘substitution effect’ of people working more when their hourly wage rises, because working is then more attractive relative to leisure.
If strong labour supply does indeed reflect people seeking more income, we might also see unusual labour market dynamics as this effect unwinds. Normally when labour demand softens, we see some combination of higher unemployment and higher underemployment. Over recent decades, the underemployment adjustment has become stronger relative to that in unemployment. Employers are increasingly using the ‘hours margin’ to adjust their labour demand, rather than laying people off entirely. The RBA knows this, and indeed the key paper describing this effect was co-authored by the newly appointed head of the RBA’s Economic Analysis department.
If the income effect has been the dominant driver of the recent rise in labour supply, then as inflation subsides and real incomes recover, we may see an ongoing softening in hours worked, with neither unemployment nor underemployment rising very much. If people no longer need the extra hours or the second job, they will not report themselves as seeking more hours, and so underemployed.
The implication is that it will be all too easy to misinterpret an easing labour market as still tight. In principle, the RBA’s full employment checklist should help guard against such misinterpretation. But seeing how one quarterly outcome for hours worked seems to have changed the RBA’s view on supply capacity, and so the inflation outlook, it is hard to be confident of this.
The RBA will need to skate to where the labour market is going to go, not where it used to be.
EURJPY Wave Analysis
- EURJPY broke resistance area
- Likely to rise to resistance level 164.90
EURJPY currency pair just broke the resistance area located between the resistance level 162.50 and the 61.8% Fibonacci correction of the earlier sharp downward impulse (c) from the end of July.
The breakout of this resistance area is aligned with the clear multi-month uptrend visible on the weekly EURJPY charts.
Given the strengthening of the bearish yen sentiment, EURJPY currency pair can be expected to rise further toward the next resistance level 164.90 (former low of wave (a) from the end of July).
S&P 500 index Wave Analysis
- S&P 500 index rising inside impulse wave 3
- Likely to test resistance level 5570.00
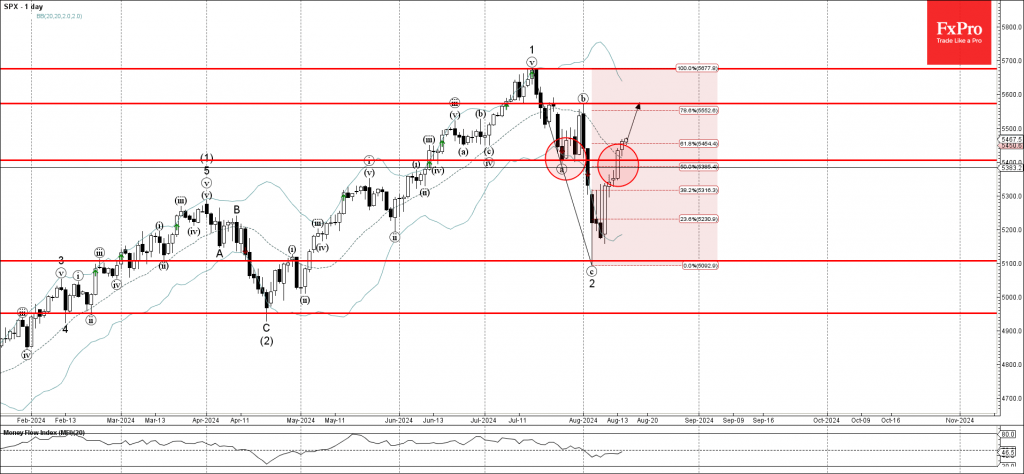
S&P 500 index recently continues to rise inside the impulse wave 3 which previously broke the resistance area located between the strong resistance level 5400.00 (former strong support from the end of July) and the 50% Fibonacci correction of the downward ABC correction 2 from last month.
The active short-term impulse wave 3 is a part of the longer-term upward impulse sequence (3) from the middle of April.
Given clear daily uptrend, S&P 500 index can be expected to rise further toward the next resistance level 5570.00 (top of wave (b) from the end of July).
GBP/JPY Mid-Day Outlook
Daily Pivots: (S1) 188.05; (P) 188.74; (R1) 189.62; More...
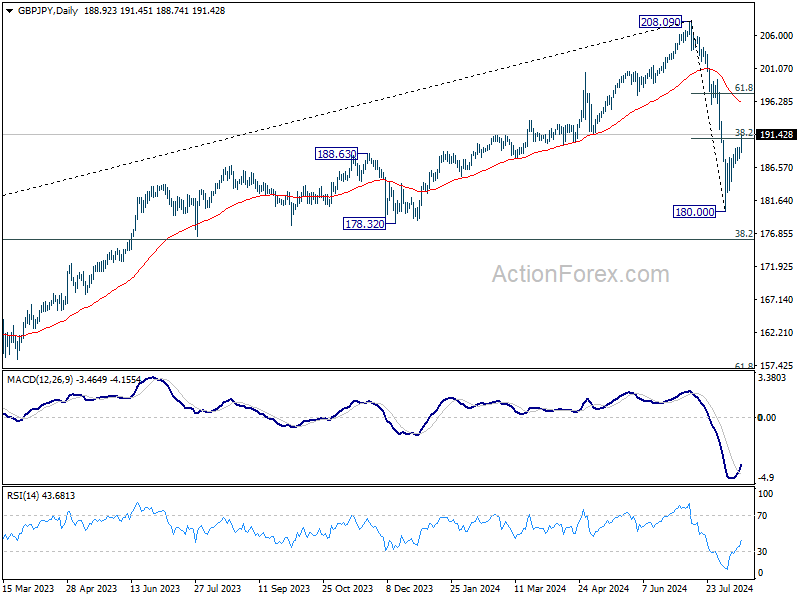
GBP/JPY's break of 38.2% retracement of 208.09 to 180.00 at 190.73 argues that the decline from 208.09 has completed at 180.00 already. Rise from there is now seen as the second leg of the corrective pattern from 208.09. Intraday bias is on the upside for 61.8% retracement at 197.35. On the downside, however, break of 187.84 minor support will turn bias back to the downside for retesting 180.00 instead.
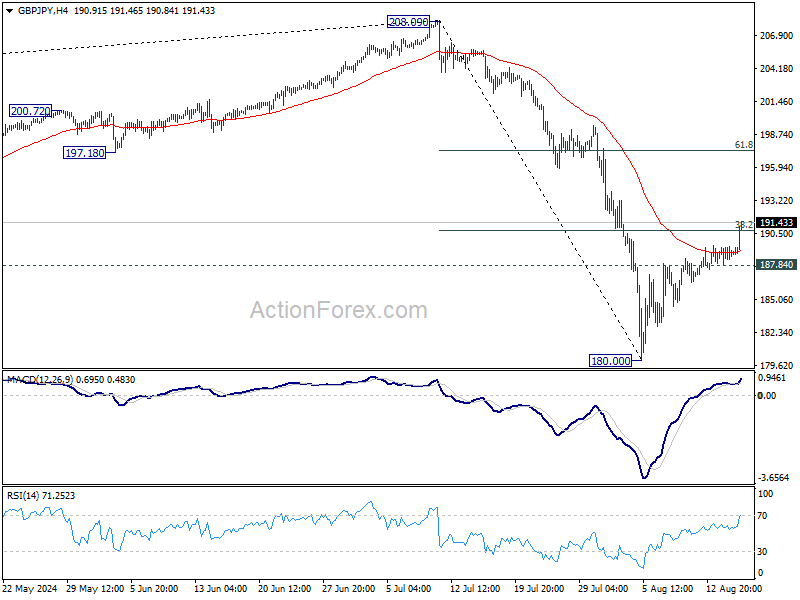
In the bigger picture, price actions from 208.09 are seen as a correction to whole rally from 123.94 (2020 low). Current development suggests that the first leg has completed and the range of medium term consolidation should be set between 38.2% retracement of 123.94 to 208.09 at 175.94 and 208.09.
Fed’s Musalem: Time may be nearing for policy adjustment
St. Louis Fed President Alberto Musalem indicated today that the balance of risks between inflation and unemployment has shifted, becoming "more balanced". Speaking at an event, Musalem expressed increased confidence in the inflation outlook, noting that recent data has reinforced this view. He highlighted that the labor market is "no longer overheated," although services and shelter inflation remain "a little sticky."
Musalem suggested that, barring any further economic shocks, inflation appears to be returning to a path consistent with Fed's 2% target over time. He also hinted that "the time may be nearing" for Fed to consider adjusting its policy stance to a moderately restrictive level.
Retail Sales Is Counterprogramming the Job Report
Summary
In the month of July retailers saw a sales increase of $6.8 billion, or 25% of the total gain from the prior two years in a single month. While most of that was an autos bounce after an ugly June, gains were broadly based and thus at odds with reports of a more cautious consumer.
They Might Be Choosy, But Consumers Are Still Spending
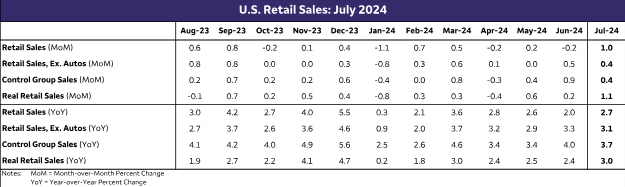
Retailers increased sales more than twice as fast as the consensus had estimated in July. That is true whether describing headline retail sales (+1.0% vs. 0.4% expectation) or the measure that excludes autos and gas (+0.4% vs. 0.2% expectation). Perhaps the most remarkable development though is that control group sales, a favored tool for predicting PCE spending in the GDP report, increased 0.3% in July. Coming on the heels of a 0.9% gain in the prior month, the upshot is more solid goods spending than most forecasters, ourselves included, had expected.
Less than two weeks ago, broad-based weakness in the July jobs report sent global financial markets into a tailspin and re-ignited fears of U.S. recession. In our August forecast update, we described how despite it being somewhat counter-intuitive, recent consumer spending numbers have come in stronger even as labor market indicators have come in weaker. Today's retail sales report is the latest development on this theme. That spending momentum in July positions spending for a solid third quarter.
Prior to this release we had already been expecting a decent outturn for Q3 spending and forecast total real PCE was set to rise at a 2.3% annualized clip in Q3, essentially matching the Q2 pace. Sales leaped $7 billion in July, which equates to about a quarter of the gain we've seen over the past two years for retail in a single month. To say July sales popped is somewhat of an understatement, and it easily sets us up for stronger growth in Q3 than we had been anticipating previously even with some potential payback in August.
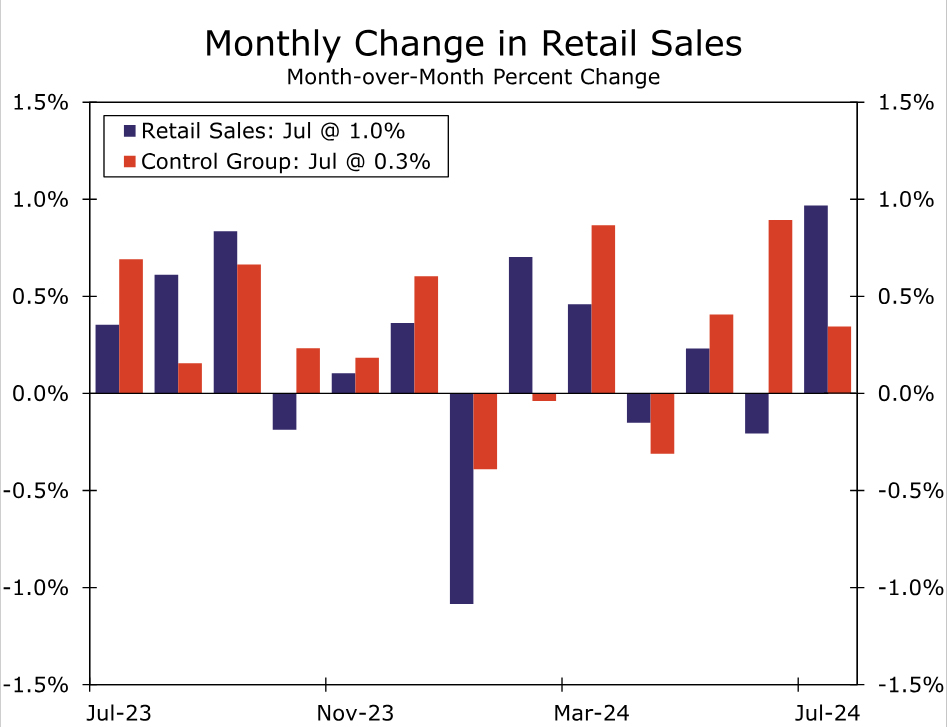
Source: U.S. Department of Commerce and Wells Fargo Economics
As was widely expected, the place where sales picked up the most was the largest category: auto dealers. A slump in June set up July for a solid gain of 3.6%. This is made somewhat more impressive by the fact that the CPI report showed auto prices are actually down over the past year. Some old familiar friends have returned to auto dealerships to help move inventory including more attractive financing terms, manufacturer rebates and dealer incentives.
Elsewhere, stores reported broad-based gains across most store types. The only categories that were down were clothing, sporting goods and miscellaneous. If one were to judge only from consumer company earning announcements, little of this makes sense.
The CEO of a major retailer in the building materials and garden equipment space earlier this week noted a “deferral mindset” among their shoppers. While a leading general merchandise retailer today described shoppers at their stores as being “discerning, choiceful, value-seeking.”
Labor market data have grown in importance as the Fed has shifted its focus back to the jobs market, and by extension the health of the consumer matters. Even though inflation and employment are the sole mandates, the Fed cannot afford to look past consumer behavior.
Source: U.S. Department of Commerce and Wells Fargo Economics
We've long held the view that continued consumer resilience depends on income growth as savings are no longer in excess and access to affordable credit has dwindled. With retail sales having held up through July, it somewhat walks back the urgency for an aggressive Fed pivot. Yet retail sales are limited in their growth signal as they mostly cover goods consumption and are subject to large monthly revisions. The more comprehensive personal income and spending report out later this month will be key to gauging consumer resilience, but the July retail report was a positive economic development. It's the latest reminder that its tough to bet against the US consumer.
Australian Dollar Rises on Strong Job Growth
The Australian dollar is in positive territory on Thursday. AUD/USD is trading at 0.6607 in the European session, up 0.16% on the day at the time of writing. Earlier, the Aussie rose as high as 0.6633 (0.48%) before retracting.
Australian job growth jumps but unemployment rises
The Australian employment report for July was an interesting mix. Job growth remained strong as the economy added 58.2 thousand jobs, up from a revised 52.2 thousand in June and crushing the estimate of 20 thousand. Full-time employment rose by an impressive 60.5 thousand as part-time jobs dipped by 2.3 thousand.
At the same time, the unemployment rate nudged higher to 4.2%, up from 4.1% in June which was also the market estimate. This marked the highest unemployment rate since January 2022, but the increase was reflective of a higher worker participation rate.
Overall, the employment report was positive and supports the Reserve Bank’s hawkish stance on rate policy. Last week, RBA Governor Bullock said that a rate cut was unlikely for the next sixth months. The markets are more dovish and anticipate a rate cut before the end of the year. Still, the markets have pared the likelihood of a November rate cut to 45%, down from 55% prior to the employment release.
On the inflation front, consumer inflation expectations rose to 4.5% in August, up from 4.3% in July and the highest level since April. This release also supports the case for the RBA to continue its rate policy of “higher for lower” until inflation data move closer to the target band of 2% to 3%. The RBA holds its next policy meeting on September 24.
AUD/USD Technical
- AUD/USD is testing resistance at 0.6612. Above, 0.6628 is a weak resistance line, followed by 0.6659
- 0.6581 and 0.6566 are the next support levels
EUR/JPY Mid-Day Outlook
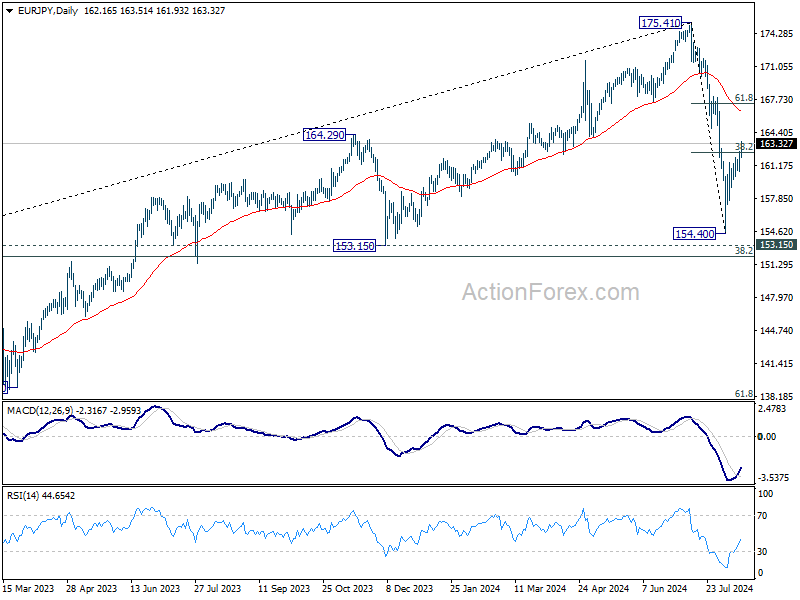
Daily Pivots: (S1) 161.02; (P) 161.81; (R1) 163.02; More...
EUR/JPY's break of 38.2% retracement of 175.41 to 154.40 at 162.42 suggests that fall from 175.41 has completed at 154.40. Rise from there is now seen as the second leg of the corrective pattern from 175.41. Intraday bias is on the upside or 61.8% retracement at 167.38 next. On the downside, below 160.57 minor support will turn bias back to the downside for 154.40 instead.
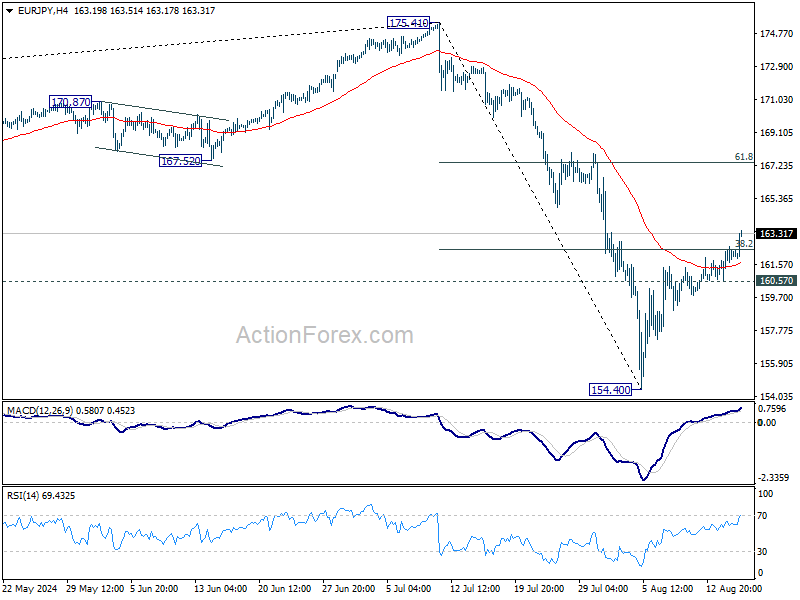
In the bigger picture, price actions from 175.41 are seen as correction to rally from 114.42 (2020 low). Current development suggests that the first leg has completed. The range of consolidation should be set between 38.2% retracement of 114.42 to 175.41 at 152.11 and 175.41 high.