Sample Category Title
Oil Price Update: Brent Holds Critical Support Amid US Inventory Decline
- Oil prices have declined over the past four days, but Brent oil remains at a crucial support level.
- The Chinese government has cut rates to stimulate economic growth following disappointing data. Will this help keep oil demand strong in H2?
- US GDP, PMI and PCE data could play a role in Oil price moving ahead while the Geopolitical situation needs to be monitored as well.
Oil prices have been on a four-day losing streak, but Brent is holding at a crucial support level following data showing declining US inventories. Ongoing uncertainty surrounding China continues to fuel demand concerns.
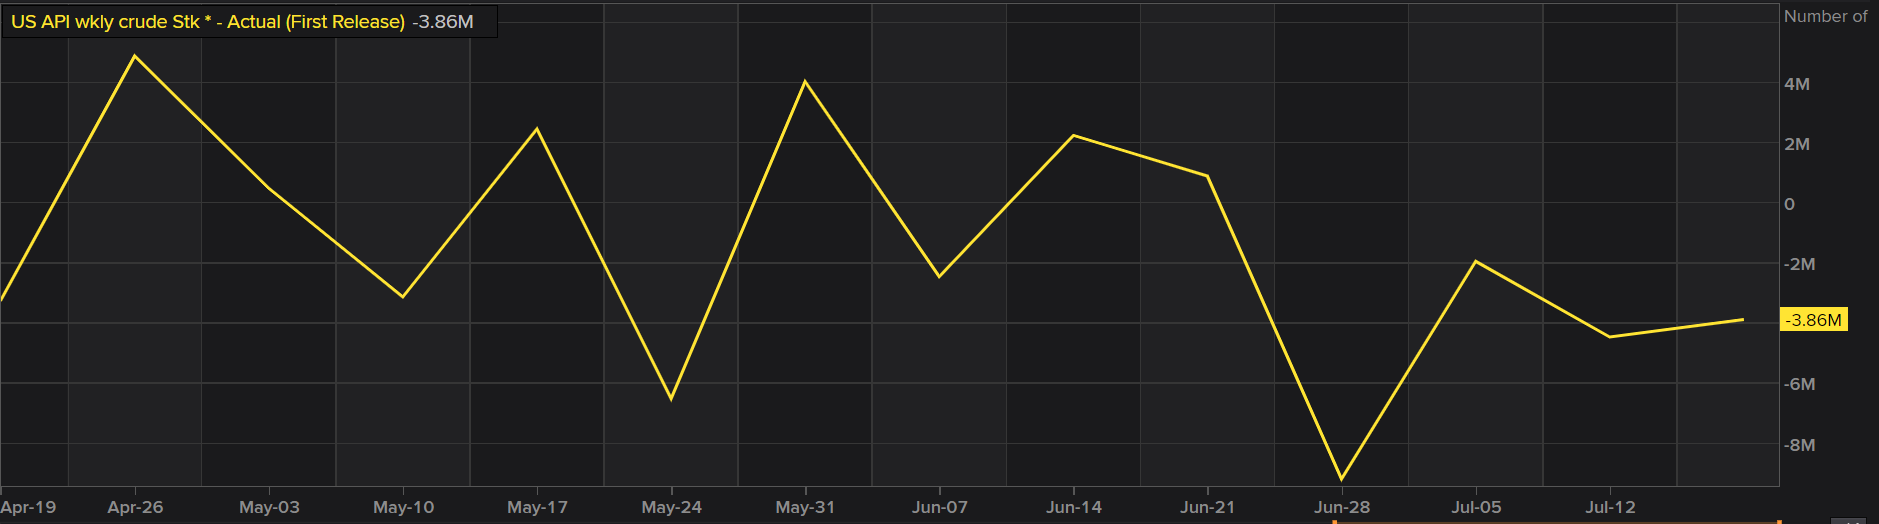
The American Petroleum Institute (API) reported a week-on-week decline in inventories, with crude oil stocks dropping by 3.9 million barrels, more than the anticipated 2.47 million barrels which was expected given the mid-summer period.
API Numbers Weekly
*The numbers show the stark decline as the summer months, highlighting the spike in demand experienced during US summers.
Source: LSEG
Oil bulls are also keeping an eye on wildfires in Canada, which threaten supply as some producers have already reduced production. Analysts note that a significant amount of supply is at risk, which could be a concern for market participants.
This outlook aligns with recent comments from OPEC+ members, who indicated that a change in output is unlikely in the near future. However, OPEC faces challenges from member states, as a July Reuters survey revealed that they have exceeded agreed targets for a second consecutive month. This could pose a challenge for OPEC as it aims to keep oil prices stable at or above $80 per barrel.
In the medium term, I anticipate an increase in oil prices as the summer months in Europe and the US come to an end. A supply deficit is likely toward the end of Q3 and the beginning of Q4.
China Cuts Rates to Support Growth
The Chinese Government and the Peoples Bank of China (PBoC) announced its first major monetary policy move since February. PBOC Governor Pan Gongsheng announced at the Lujiazui forum that the 7-day reverse repo rate will gradually become the main policy rate, while other policy rates will “soften their role” over time. It remains to be seen if other policy rates, such as the MLF, will follow today’s rate cut in the coming weeks. If they do, it could indicate that the PBOC is signaling the 7-day reverse repo rate’s new status as the primary policy rate.
This is seen as a move to achieve the economic targets following lackluster data last week which raised concerns about Chinese growth in H2 2024. It will be interesting to gauge developments moving forward and whether this move will have the desired effect.
The Week Ahead
US data dominates the back-end of the week with PMI, GDP and of course PCE inflation releases. US Dollar strength or weakness is always a factor to consider when evaluating oil prices but unless the data leads to a significant shift in rate cut probability and timing, any moves are likely to be short-lived.
The EIA data will be released later today and of course the Baker Hughes US Oil Rig Count will be out on Friday. Geopolitics as always still remains a concern and any developments there need to be monitored.

Technical Analysis
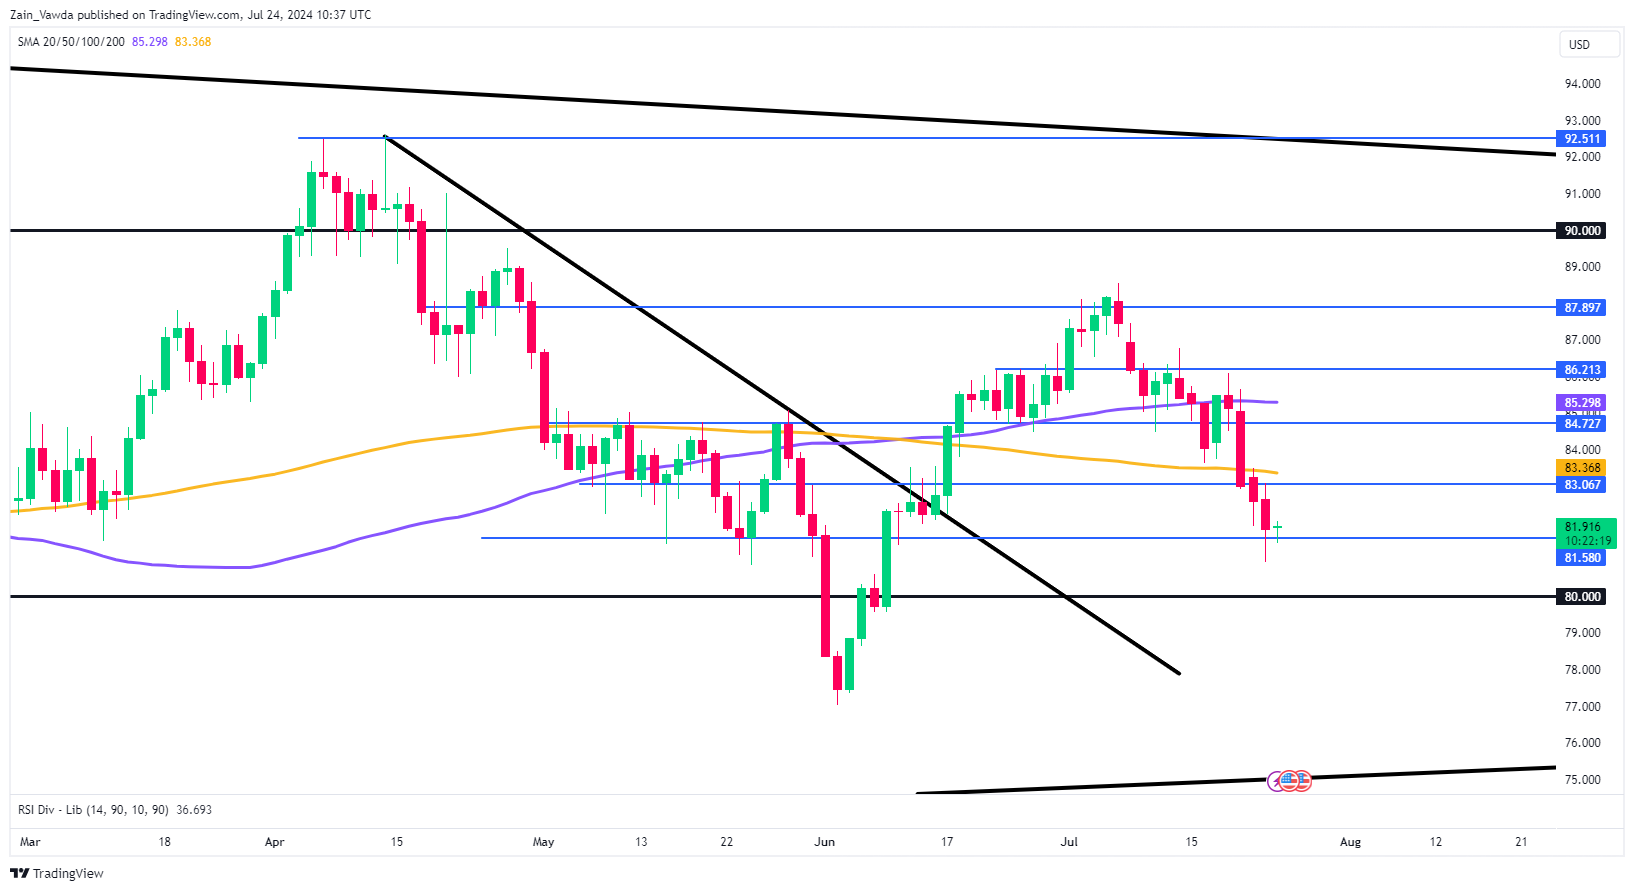
Oil prices have been steadily declining over the past few days but encountered a significant support level yesterday. Although oil briefly dipped below this support region, it quickly recovered as US inventory data was released.
During the European session, oil has edged higher; however, with upcoming US data this afternoon, the markets are showing limited volatility. Immediate support is at 81.58, and a break below this level could lead to a retest of the psychological 80.00 mark.
Conversely, a move higher from the current levels would face resistance around the 83.00 handle, with the 200-day moving average positioned slightly above at 83.36.
Support
- 81.58
- 80.00
- 77.50
Resistance
- 83.00
- 84.72
- 85.30
Brent Crude Oil Daily Chart, July 17, 2024
Source: TradingView.com (click to enlarge)
EUR/USD Outlook: Bears Faced Headwinds at Pivotal Fibo Support
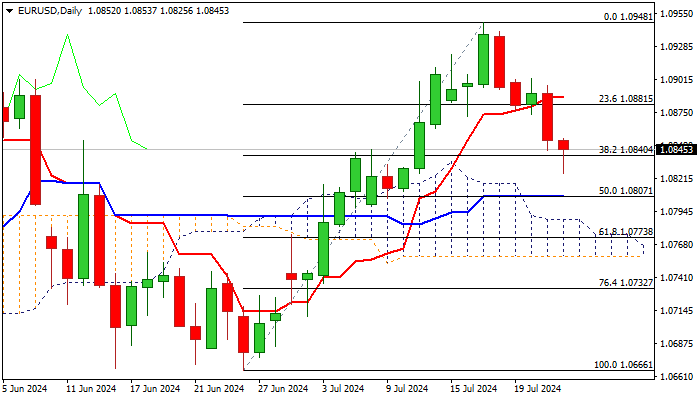
EURUSD extended pullback from a multi-month high (1.0948) and cracked pivotal supports at 1.0840/33 (Fibo 38.2% of 1.0666/1.0948 / 20DMA) but struggling to make a clear break lower.
Oversold conditions on daily chart provided headwinds, suggesting that bears may take a breather, as markets await release of US July PMI data, due later today.
Traders also focus on US Q2 GDP (due on Thursday) and June PCE (Friday) for more details about the condition of the economy and inflation, the key factors to Fed’s decision about the start of rate cutting cycle.
Limited recovery should provide better selling opportunities for extension towards 1.0807/00 (daily Kijun-sen / psychological) and 1.0788 (top of thinning daily cloud).
Only lift and close above daily Tenkan-sen (1.0886) to sideline bears on completion of bear-trap and reversal signal.
Res: 1.0861; 1.0886; 1.0902; 1.0948.
Sup: 1.0840; 1.0825; 1.0807; 1.0788.
AUD/USD: Bears May Pause for Consolidation, Daily Cloud Top to Cap Upticks
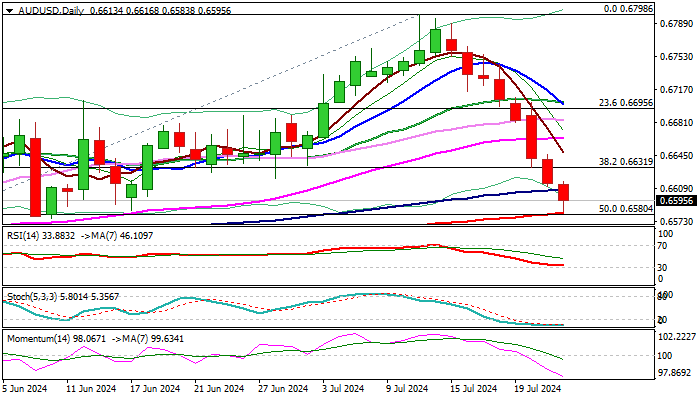
AUDUSD remains in red for the eighth consecutive day and fell to the lowest in six weeks in early Wednesday.
Aussie dollar remains under increased pressure from stronger US dollar, falling prices of commodities and concerns about China’s economic growth.
Bears cracked pivotal support at 0.6580 (200DMA / 50% retracement of 0.6362/0.6798) after Tuesday’s close below Fibo 38.2% and break below 100DMA in early Wednesday’s trading.
The price is holding in the middle of thick daily Ichimoku cloud, with formation of daily Tenkan / Kijun-sen bear cross adding to bearish near term outlook.
However, strongly oversold conditions warn that bears may pause for consolidation, with 200DMA producing headwinds and keeping the price action for now.
Corrective upticks should be capped under cloud top (0.6642) to keep bears in play and offer better selling opportunities for fresh push lower and attack at 0.6538/28 targets (daily cloud base / Fibo 61.8%).
Res: 0.6607; 0.6631; 0.6642; 0.6663.
Sup: 0.6580; 0.6538; 0.6528; 0.6465.
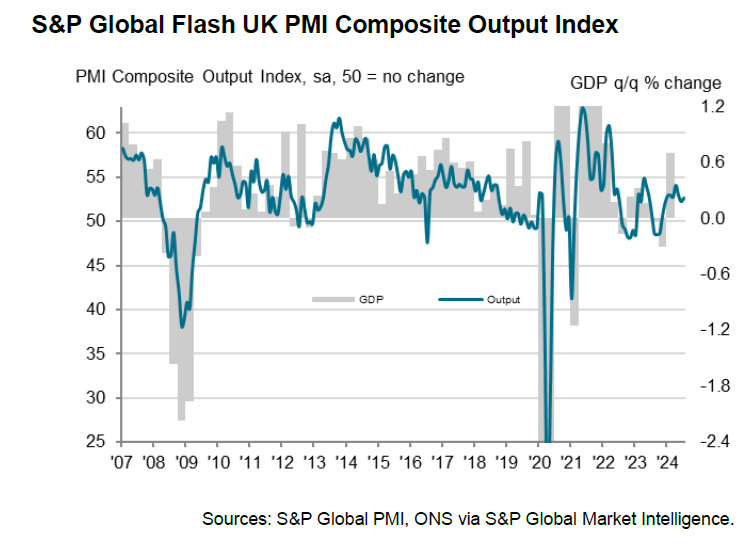
UK manufacturing PMI hits 24-month high, encouraging start to H2
UK PMI data for July reveals a promising start to the second half of the year. PMI Manufacturing rose to 51.8, exceeding expectations of 51.1 and marking a 24-month high. PMI Services also increased slightly from 52.1 to 52.4, though just below the forecast of 52.5. The overall PMI Composite index improved from 52.3 to 52.7.
Chris Williamson, Chief Business Economist at S&P Global Market Intelligence, noted, "The flash PMI survey data for July signal an 'encouraging start' to the second half of the year, with output, order books, and employment all growing at faster rates amid rebounding business confidence, while price pressures moderated."
Post-election business sentiment has surged, with increased demand and hiring in both manufacturing and services sectors. Despite the slowest price rise in three and a half years, suggesting potential for a summer rate cut, caution remains.
"Policymakers will likely take a cautious approach to loosening policy amid signs of inflationary pressures pivoting away from services towards manufacturing, where Red Sea shipping delays and higher freight prices are adding to costs again," Williamson added. The renewed hiring trend could also sustain wage pressures, keeping inflation somewhat persistent.
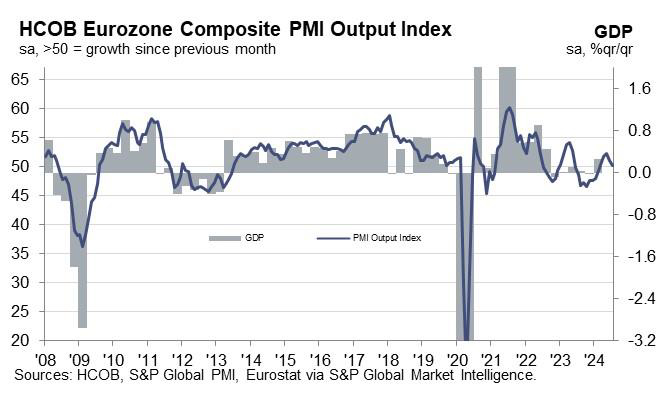
Eurozone PMI composite hits 5-month low at 50.1, ECB’s post-September rate cut path uncertain
Economic activity in Eurozone weakened in July, with PMI Manufacturing dipping from 45.8 to 45.6, a seven-month low, and missing expectations of 46.3. PMI Services also declined from 52.8 to 51.9, below the anticipated 52.9, marking a four-month low. Consequently, PMI Composite fell from 50.9 to 50.1, a five-month low.
Cyrus de la Rubia, Chief Economist at Hamburg Commercial Bank, noted that the Eurozone economy "barely moved" in July. He highlighted that the manufacturing sector "deteriorated significantly," offsetting "moderate growth" in the services sector.
While current growth data might justify a September rate cut by ECB, inflation data complicates this decision. De la Rubia noted that input prices in the services sector rose faster, and selling prices remained steady. Manufacturing input prices, which had fallen for over a year, have increased for two consecutive months. Output prices only marginally decreased.
De la Rubia added "Our conclusion is that while a September rate cut will most probably be exercised, it will be much trickier to follow this path in the months thereafter, unless the downturn morphs into a deep recession."
EUR/CHF Daily Outlook
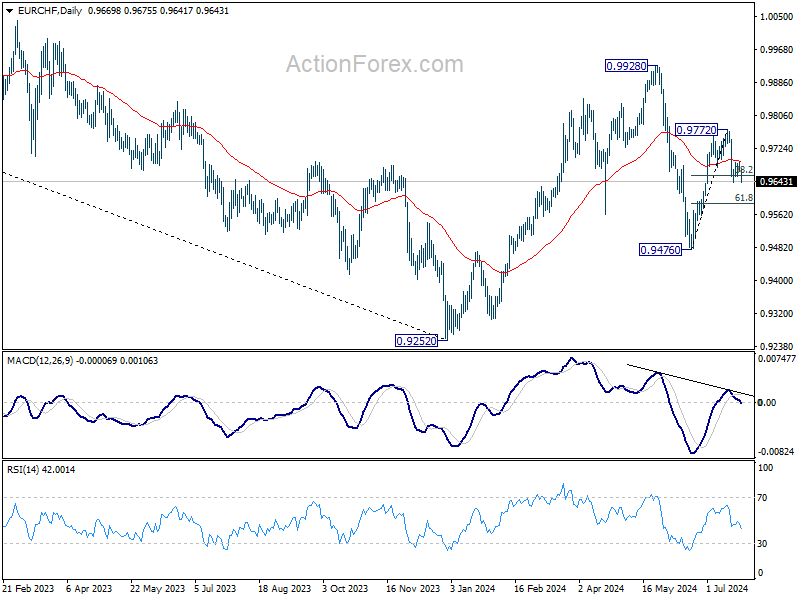
Daily Pivots: (S1) 0.9665; (P) 0.9678; (R1) 0.9688; More....
Immediate focus is now on 0.9641 temporary low in EUR/CHF. Firm break there and sustained trading below 38.2% retracement of 0.9476 to 0.9772 at 0.9659 will extend the fall from 0.9772 to 61.8% retracement at 0.9589 and possibly below. On the upside, above 0.9690 minor resistance will turn bias back to the upside for 0.9972 instead.
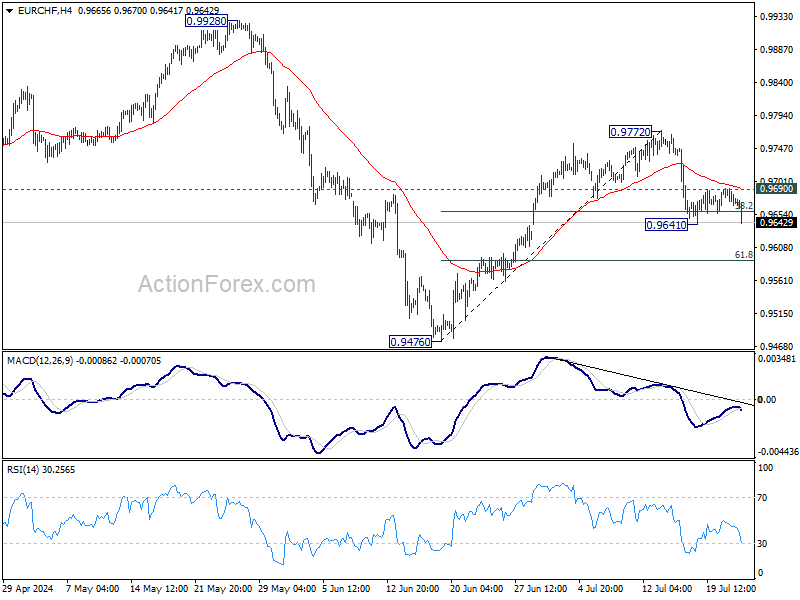
In the bigger picture, rebound from 0.9252 medium term bottom might not be completed yet. But even in case of resumption, strong resistance could emerge from 1.0095 to limit upside. Medium term outlook will be neutral at best as long as 1.0094 structural resistance holds. Meanwhile, break of 0.9476 will bring retest of 0.9252 low.
NZDUSD Plunges to New Multi-Week Low
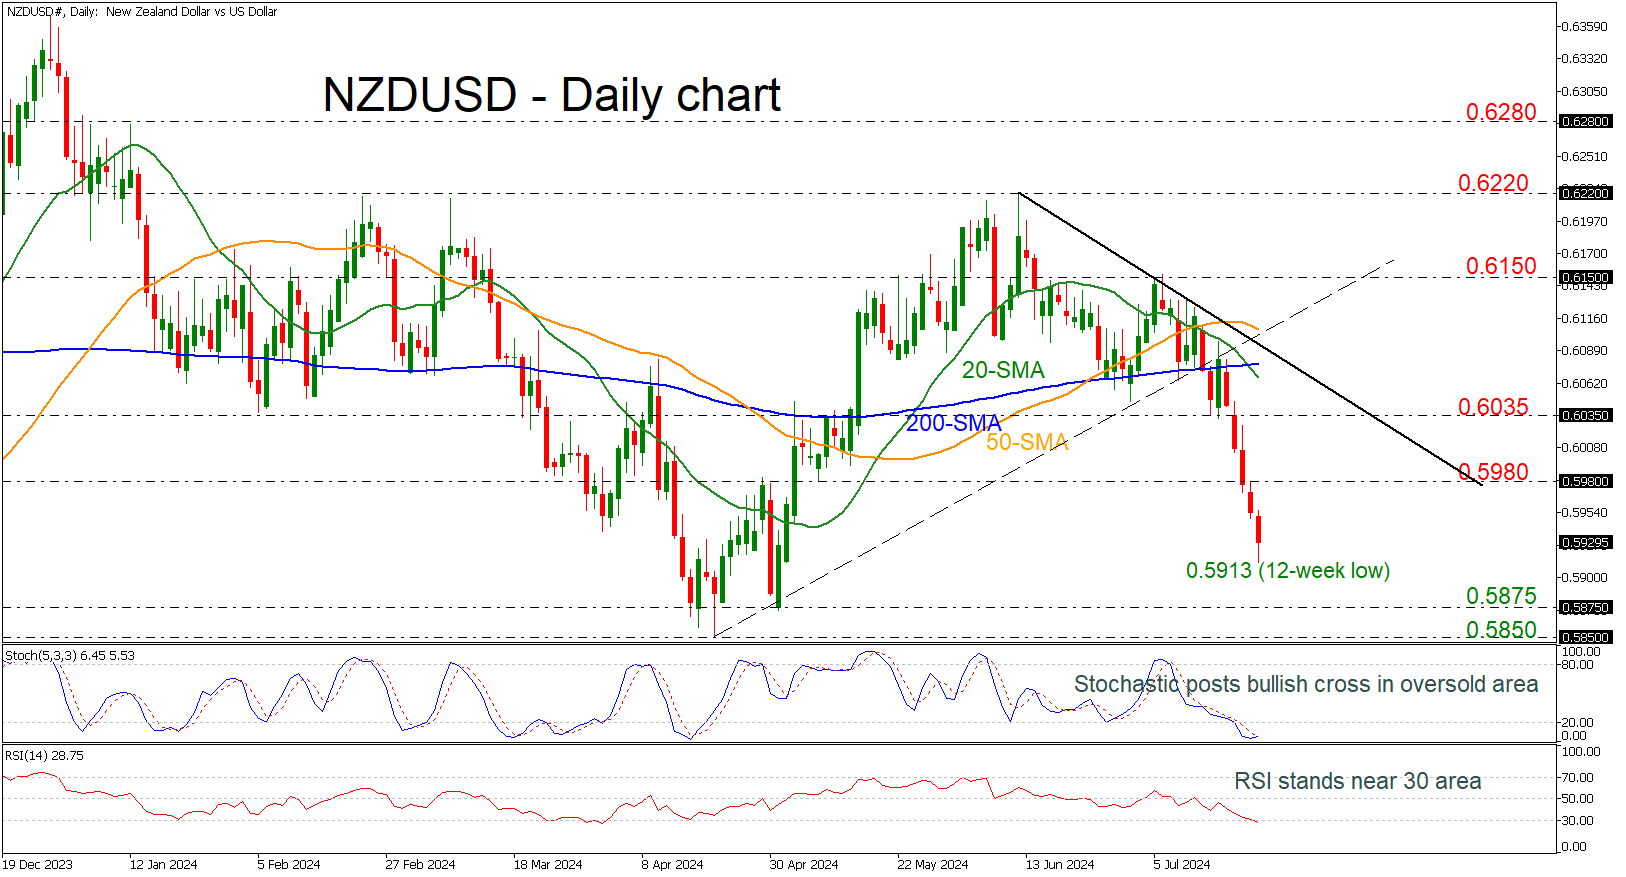
- NZDUSD dives almost 4% from the July high of 0.6150
- Price may rebound off 0.5875
- 20- and 200-day SMAs record a bearish cross
- Momentum oscillators indicate upside correction
NZDUSD has been creating an aggressive bearish rally since the break beneath the short-term uptrend line, diving almost 4% after the pullback from the 0.6150 resistance. The pair posted a fresh 12-week low of 0.5913 today and is also recording its fifth consecutive red day.
The 20- and 200-day simple moving averages (SMAs) established a negative crossover, confirming the recent negative move; however, the technical oscillators indicate an end to the bearish momentum. The stochastic posted a bullish cross within its %K and %D lines in the oversold area, while the RSI has slipped below the 30 level.
More downside pressures could push the bears towards the 0.5875 support level before testing the 0.5850 bar, which was achieved on April 19.
In the positive scenario, a rebound off the latest low could open the way towards the 0.5980 resistance, taken from the inside swing low on May 8, before challenging the 0.6035 resistance and the 200-day SMA at 0.6075.
All in all, the current picture in NZDUSD is bearish unless there is a significant climb back above the SMAs, the new downtrend line, and, more importantly, beyond the previous peak of 0.6220.
GBP/JPY Daily Outlook
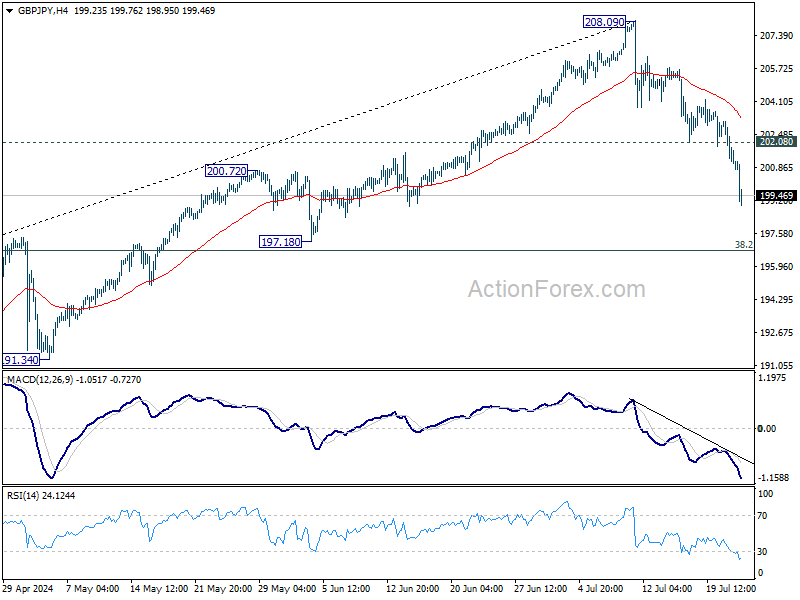
Daily Pivots: (S1) 199.97; (P) 201.57; (R1) 202.38; More...
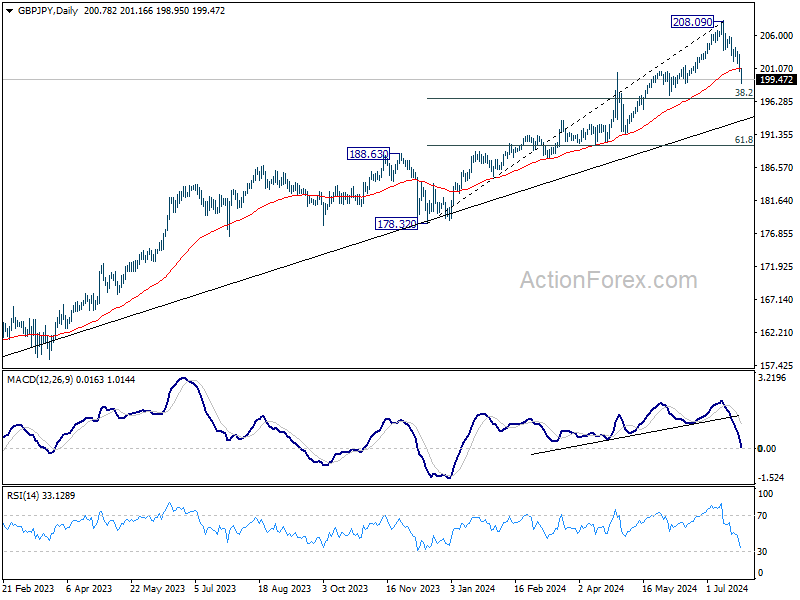
GBP/JPY's fall from 208.09 accelerates to as low as 198.95 so far, breaking through 55 D EMA. Intraday bias stays on the downside for for 38.2% retracement of 178.32 to 208.09 at 196.71 next. For now, risk will stay on the downside as long as 202.08 support turned resistance holds, in case of recovery.
In the bigger picture, medium term outlook will stay bullish as long as 188.63 resistance turned support holds. Long term up trend remains in favor to continue through 208.09 at a later stage. However, firm break of 188.63 will be a strong sign of bearish trend reversal.
EUR/JPY Daily Outlook
Daily Pivots: (S1) 168.13; (P) 169.61; (R1) 170.38; More...
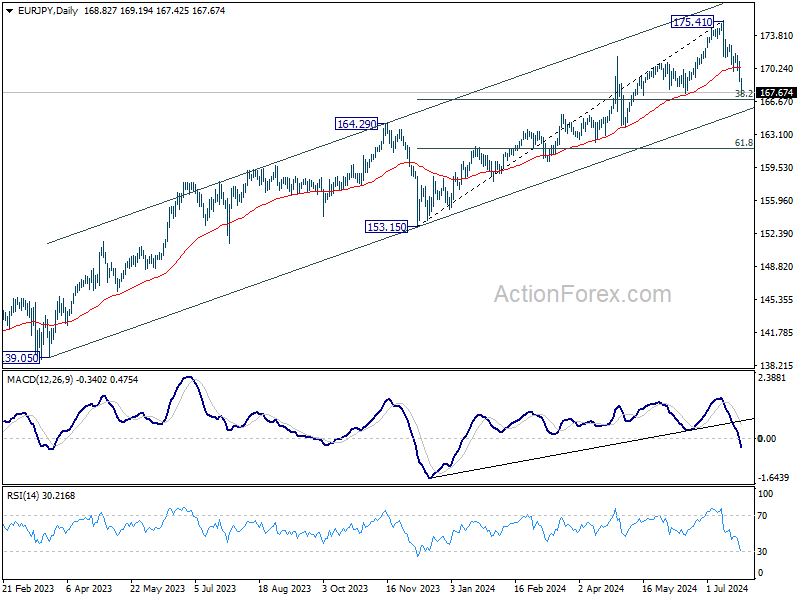
EUR/JPY's fall from 175.41 resumed after brief consolidations and dives to as low as 167.42 so far. Intraday bias is back on the downside for 38.2% retracement of 153.15 to 175.41 at 166.90. Some support could be seen there to bring rebound, on first attempt. But break of 169.98 support turned resistance is needed to signal short term bottoming. Firm break of 166.90 will pave the way to medium term channel support (now at 165.46).
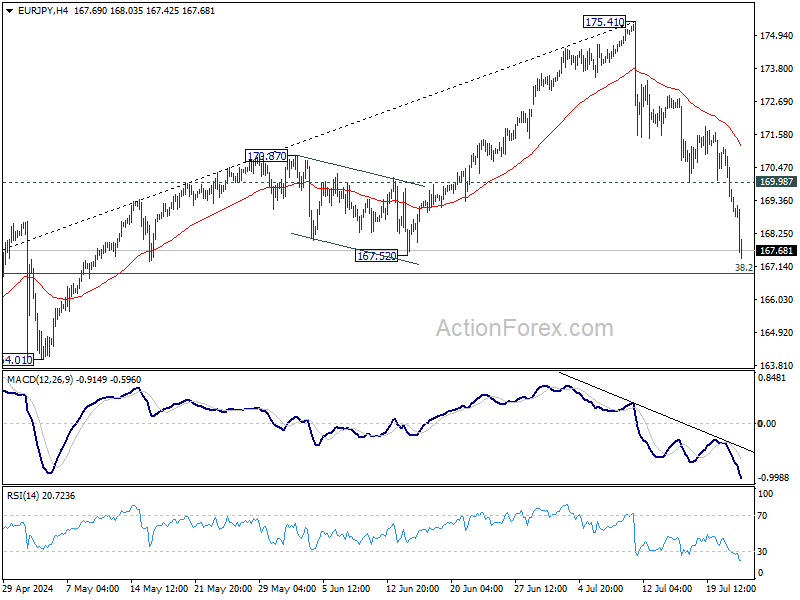
In the bigger picture, medium term outlook will stay bullish as long as 164.29 resistance turned support holds. Long term up trend is still in favor to continue through 175.41 at a later stage. However, firm break of 164.29 will be a strong sign of bearish trend reversal.
EUR/GBP Daily Outlook
Daily Pivots: (S1) 0.8395; (P) 0.8411; (R1) 0.8424; More....
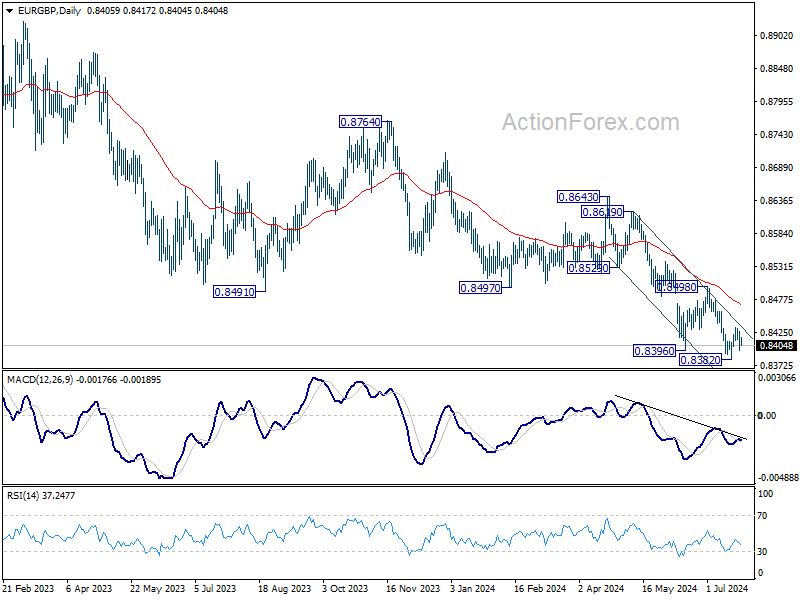
Intraday bias in EUR/GBP remains neutral as consolidations continue above 0.8382 low. While rebound from 0.8382 could extend higher, outlook will stay bearish as long as 0.8498 resistance holds. Larger down trend should resume through 0.8382 at a later stage.
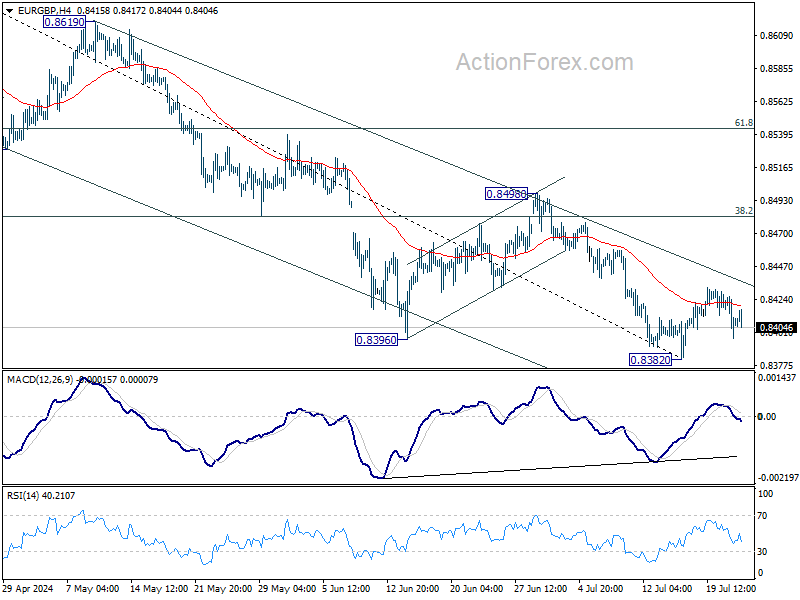
In the bigger picture, down trend from 0.9267 (2022 high) is in progress. Next target is 0.8201 key support (2022 low). For now, outlook will remain bearish as long as 0.8643 resistance holds, even in case of stronger rebound.