Sample Category Title
Crypto Market Cools Off After Spurt
Market picture
The cryptocurrency market has pulled back 0.7% to $2.37 trillion from local extremes in the last 24 hours while remaining around highs. This looks like localised profit-taking after the rally, but not exhaustion.
For Bitcoin, it is technically significant that the current consolidation around $64K is taking place above the 50-day moving average, making it support. The closest technical resistance looks to be the $67-68K area, where the upper boundary of the descending channel from March passes.
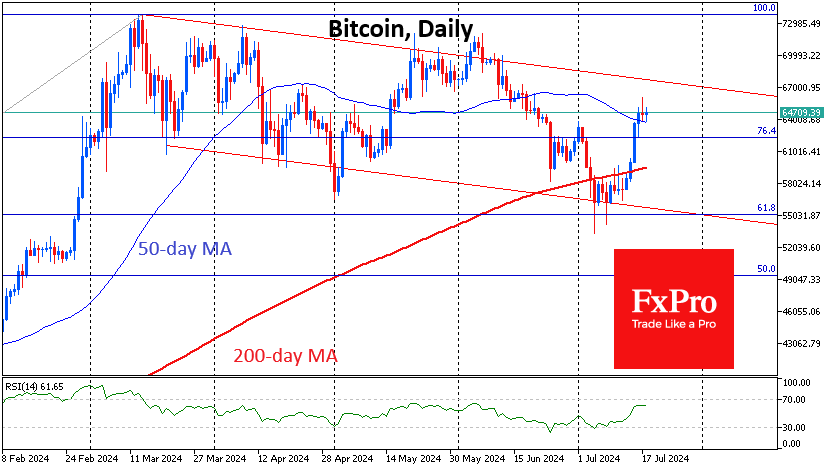
However, in our view, FOMO may come to the markets only after overcoming the $70K level, the last round mark before the historical highs. It looks to be a matter of weeks, but don’t expect a smooth ascent – a definite selling overhang still exists.
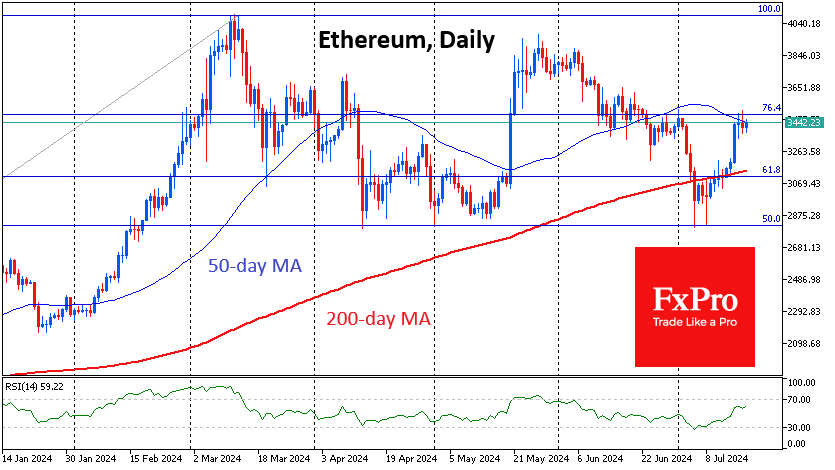
Ethereum remains chained to its 50-day moving average, running just below $3500. News of a spot ETF is not pushing the price up yet. It seems that only actual buying, or rather even its accumulative effect, can do that, which will reduce the circulating supply of coins.
News background
According to CryptoQuant, concerns regarding possible sales of bitcoins distributed by the bankrupt Mt. Gox exchange are exaggerated. Since 2023, $224bn worth of digital gold has been sold during the market’s bull phase, but its price has risen 350% in the process.
German authorities have revealed the price of bitcoins confiscated from the piracy portal Movie2k. After an “emergency sale” of 49,858 BTC, the German government raised an “unprecedented” $2.88bn. The average sale price was $57,760. Local laws require an “immediate” sale of confiscated funds if there is a risk of a 10% depreciation.
Glassnode noted that the bitcoin market has “absorbed” 48,000 BTC linked to German authorities and is expecting a new batch of sales from Mt. Gox customers.
Bankrupt crypto exchange FTX and the Commodity Futures Trading Commission (CFTC) have agreed to a $12.7bn settlement after months of negotiations.
Bitwise expects the launch of spot Ethereum-ETFs to push cryptocurrency quotes to all-time highs above $5,000. Meanwhile, flows into the ETFs will have a greater impact on Ethereum than on the first cryptocurrency.
Ripple CEO Brad Garlinghouse criticised the US Securities and Exchange Commission (SEC) for its strict approach to regulating cryptocurrencies and hinted at the company’s possible departure from the US market.
EURUSD Reaches the Midpoint of a Long-Term Downtrend
- EURUSD rally slows down near 4-month high
- Gets bearish vibes, but positive trend is still alive above 1.0900
- ECB to hold interest rates steady at 12:15 GMT; Will it signal a second rate cut?
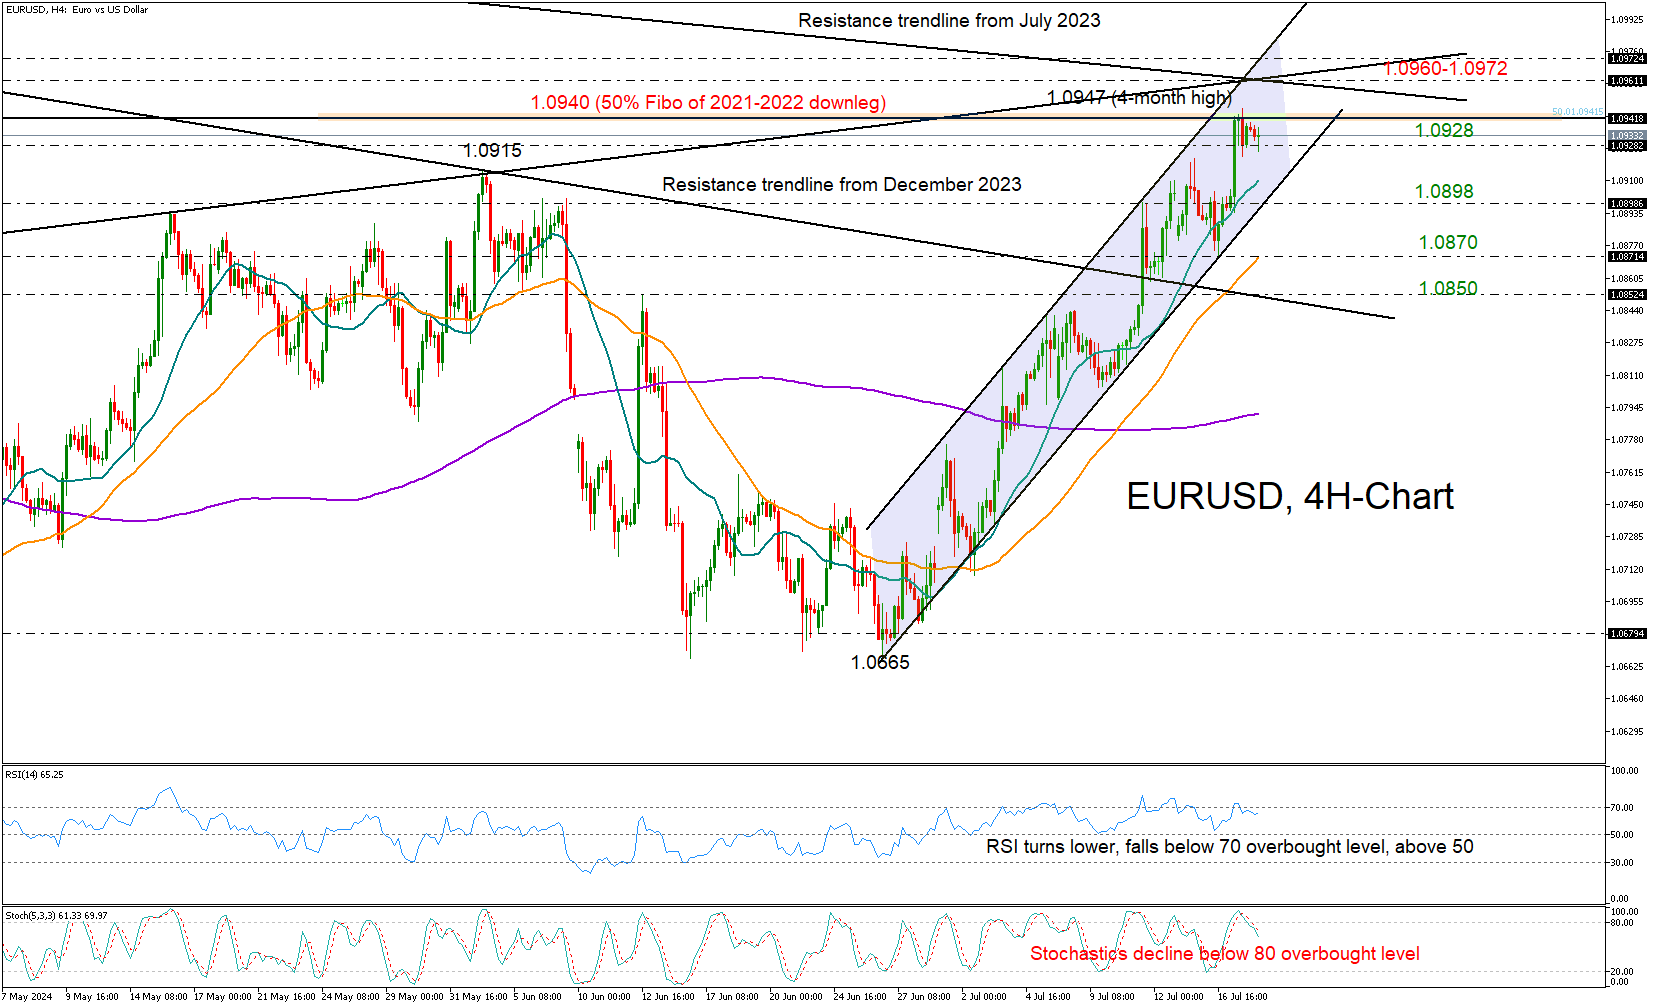
EURUSD took a breather after heightened expectations of a Fed rate cut lifted the pair as high as 1.0947 on Wednesday.
The price has been displaying a pattern of higher highs and higher lows in the past three weeks, but its failure to reach the upper band of the bullish channel on the four-hour chart could indicate a bearish wave approaching. Besides, considering the negative turn in the RSI and the stochastic oscillator, some weakness in the near term cannot be excluded.
If the nearby support zone of 1.0928 cracks, the bears could directly head towards the channel’s lower boundary at 1.0898. The credibility of the uptrend could be undermined if there is a decisive close below the latter, but only a significant drop below the 50-period SMA at 1.0870 would disrupt the positive pattern. If that scenario plays out, the spotlight will fall on the 1.0850 region, where the former resistance trendline drawn from December’s peak is located.
On the upside, the 1.0945 level, which halted bullish movements on Wednesday, might be symbolic for traders as it represents the 50% Fibonacci retracement of the major downtrend from 2021-2022. Slightly higher the 1.0960-1.0972 trendline zone could be another tough obstacle, which the pair needs to pierce in order to touch the 1.1000 number. The 1.1045 mark could be the next target.
In brief, EURUSD is expected to trade with weaker momentum in the coming sessions, though optimism for a bullish continuation may not evaporate unless the price tumbles below 1.0900.
WTI Oil Futures Hold Above 80.00
- WTI futures rebound from a 3-week low
- Next target for the bulls is the July peak of 84.50
- Momentum indicators are cautiously tilted to the upside
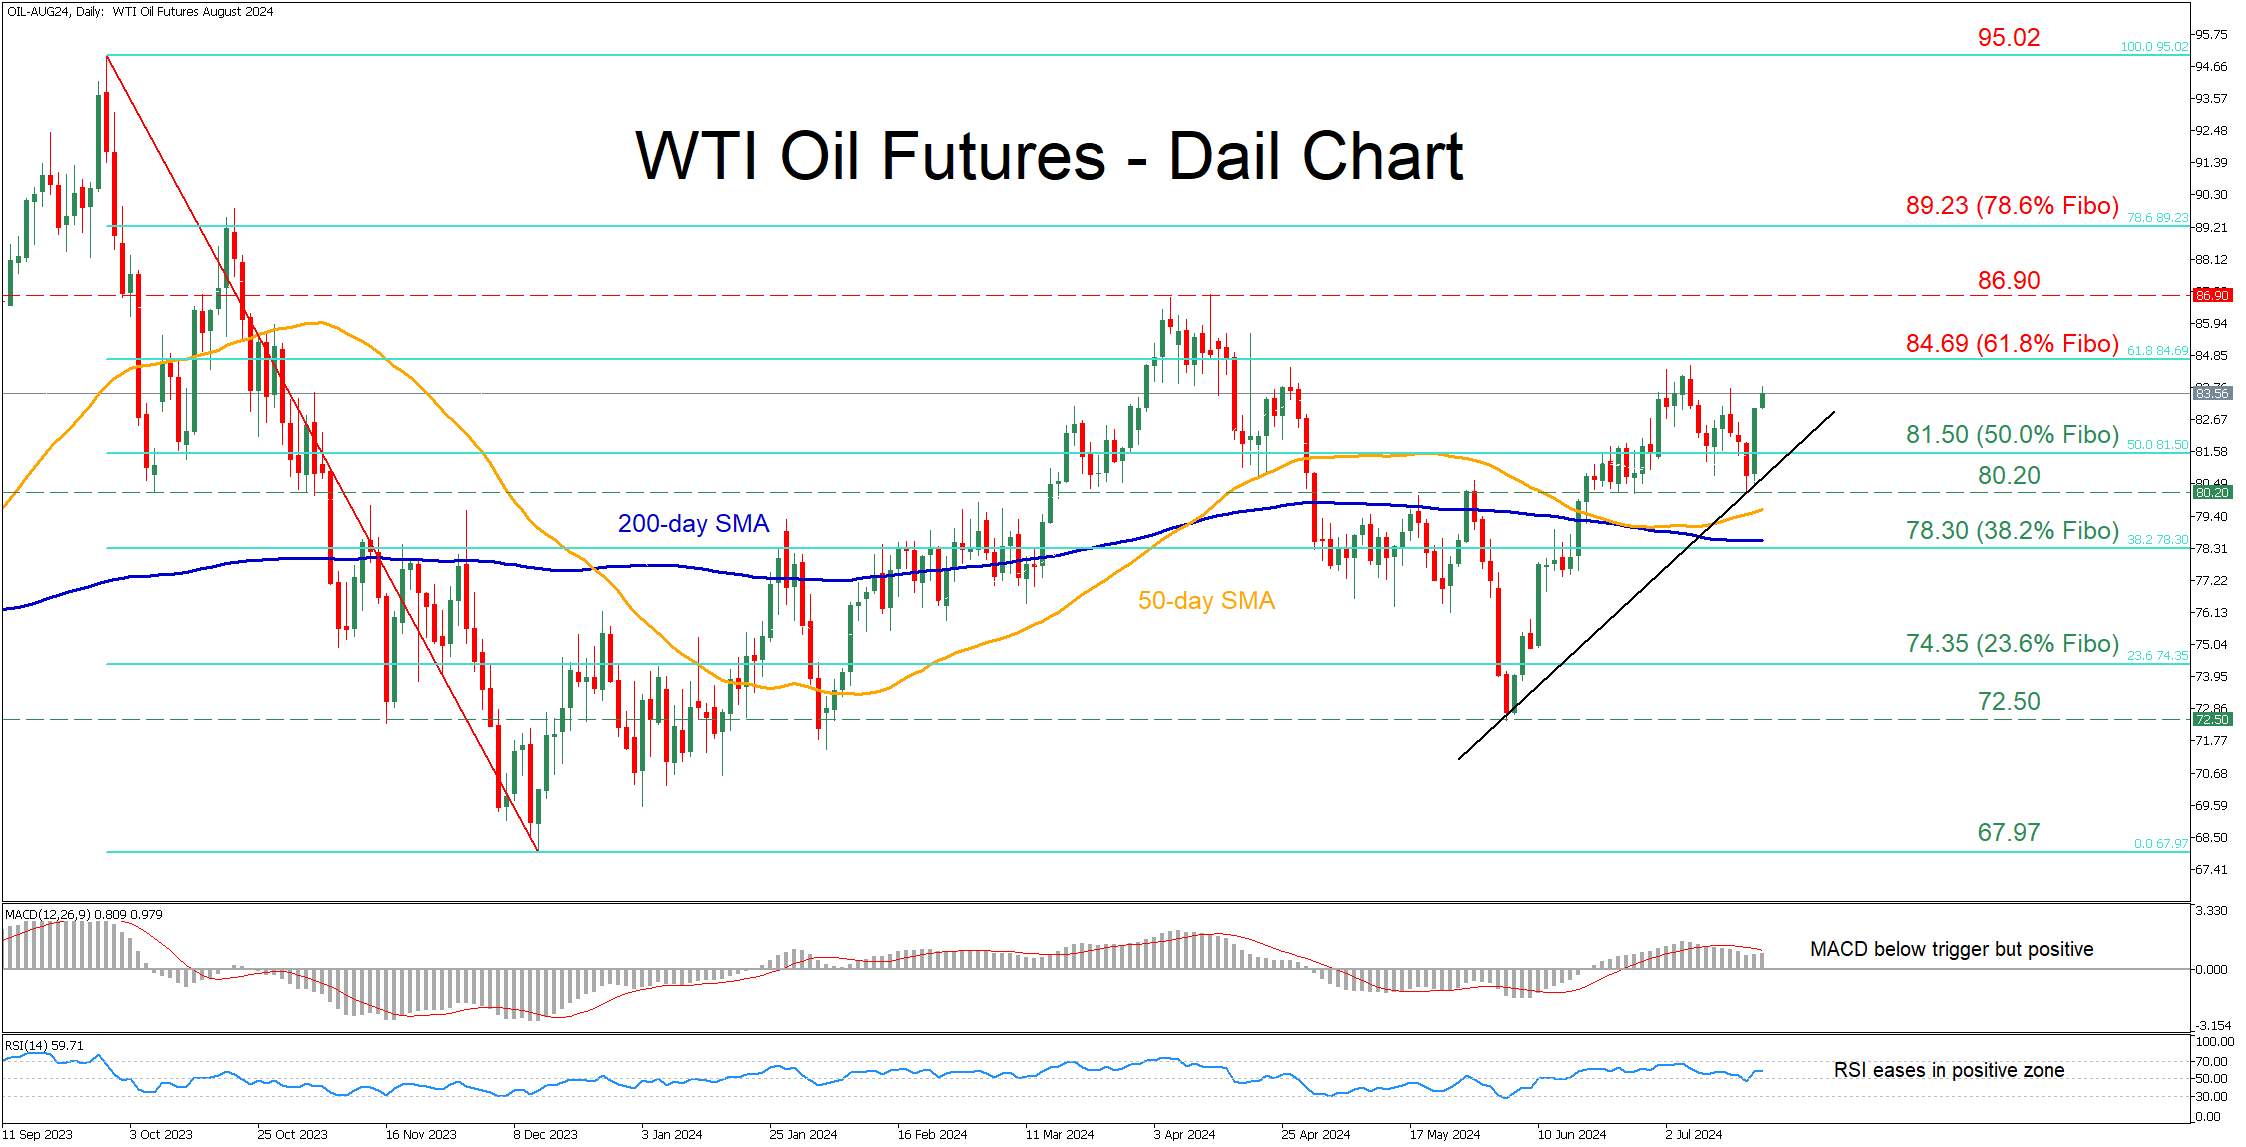
WTI oil futures (August delivery) had been in a steady uptrend since early June before experiencing a pullback following their rejection at a fresh two-month high of 84.50. Although the price fell to its lowest level in three weeks, it quickly bounced back as the 80.00 psychological mark acted as a strong floor.
Should the latest uptick strengthen, immediate resistance could be found at 84.69, which is the 61.8% Fibonacci retracement of the 67.97-95.02 upleg. Conquering this barricade, the bulls may attack the April peak of 86.90. If that hurdle also fails, attention might turn to the 78.6% Fibo of 89.23, a region that provided solid resistance in October 2023.
On the flipside, bearish actions could send the price lower to test the 50.0% Fibo of 81.50 ahead of the recent three-week low of 80.20. A violation of that region could bring the 38.2% Fibo of 78.30 under scrutiny. Failing to halt there, the price may descend towards the 23.6% Fibo of 74.35.
In brief, WTI oil futures managed to erase a significant part of their short-term slide after finding support near the 80.00 psychological mark. However, a break above 84.50 is needed to signal the continuation of the uptrend in place since early June.
USDJPY: What’s Happening With JPY? Scenarios after BoJ Intervention
Bullish Scenario: Buy above 156.45 with targets at 157.16, 157.90, and 158.10 in extension. Set S.L below 155.80 or at least 1% of the account's capital. Apply Trailing Stop.
Bearish Scenario: Sell below 157.16 or 157.90 (where a PAR* forms) with TP1: 156.00, 155.80, 155.00, and 156.56 in extension with S.L above 158.00 or at least 1% of the account's capital.
Fundamental Analysis
The dovish speech by the Fed Chairman has fueled a market sentiment where the federal funds futures price in over a 90% chance of a rate cut by the Fed in September, which has led to a bearish sentiment for the dollar due to increased bond purchases, causing yields to drop.
Additionally, the current account balance data from the Bank of Japan, released on Tuesday, showed a liquidity outflow of about 2.74 trillion yen ($17.3 billion) from the financial system related to various transactions involving the government sector. This follows an earlier forecast of a 600 billion yen drainage, indicating intervention by the Bank of Japan in the forex market.
The movements appear to have occurred on Thursday and Friday, July 11 and 12, 2024.
Technical Analysis, H2. Intraday and Swing Outlook
USDJPY
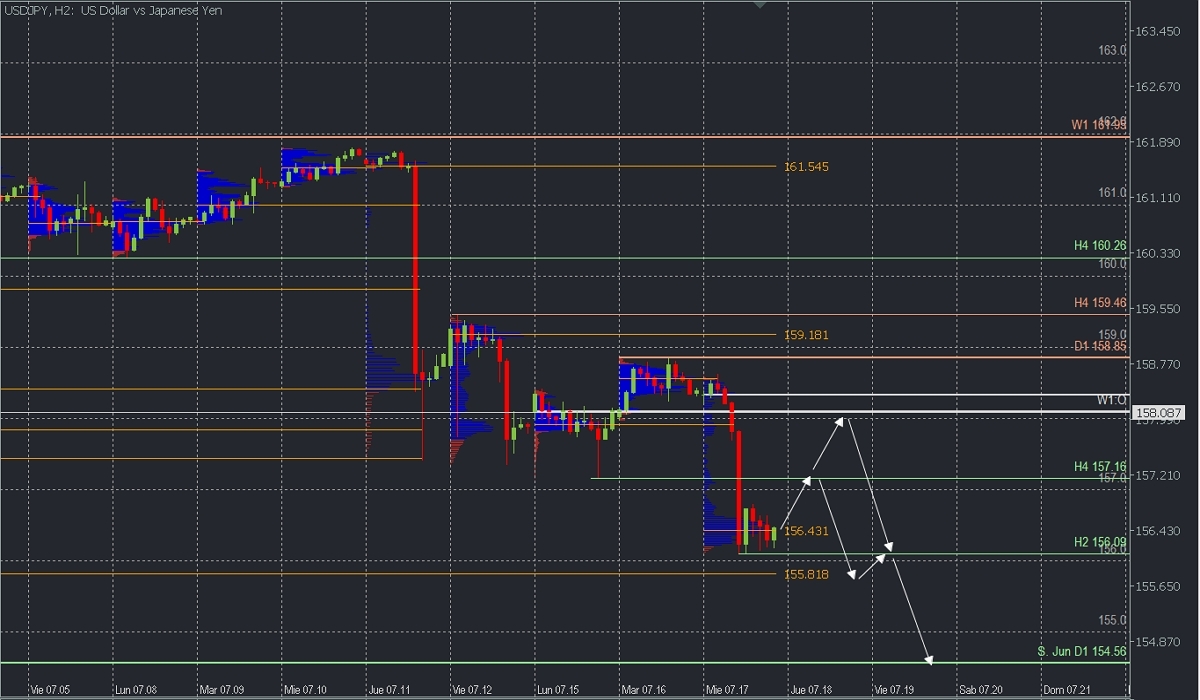
- Supply Zones (Sales): 157.90, 158.56, and 159.18
- Demand Zones (Buys): 156.43 and 155.81
After reaching a forty-year high on July 3 at 161.95, the quotes remained consolidated with the possibility of continuing the ascent until the recent aggressive activity on Thursday, July 11, where the price broke the last relevant support of the bullish trend at 160.26, subsequently confirmed with a new low on Friday, July 12, in what can be considered two consecutive interventions by the Bank of Japan to prevent excessive currency devaluation, causing an intraday trend change of the pair.
Today's sharp decline on July 17 adds a new expansion of weakness, leaving support at 156.09 and a volume concentration at 156.43. Therefore, a correction is expected over this zone with a target at the broken support of 157.16 and with greater volatility at the broken demand zone, now turned into a supply zone, between 157.90 and 158.08, from where it is expected to gain selling liquidity again to extend the descent towards the June support at 154.56 for the rest of the week.
This bearish scenario will remain valid as long as the next correction does not exceed the last relevant resistance of the new bearish trend at 158.85.
*Discovered POC: POC = Point of Control: It is the level or zone where the highest volume concentration occurred. If there was a previous downward movement from it, it is considered a selling zone and forms a resistance zone. Conversely, if there was a previous upward movement, it is considered a buying zone, usually located at lows, thus forming support zones.
Commodity Currencies in Stable Ranges: Should We Expect a Breakout?
The currency pairs AUD/USD and USD/CAD, unlike the pairs with the Euro, Yen, and Sterling, continue to demonstrate long-term stability. These pairs have been trading in narrow price corridors for several months. Given the weakening of the dollar in many directions, there is a high likelihood of increased volatility and a breakout from the flat channels in commodity currencies.
USD/CAD
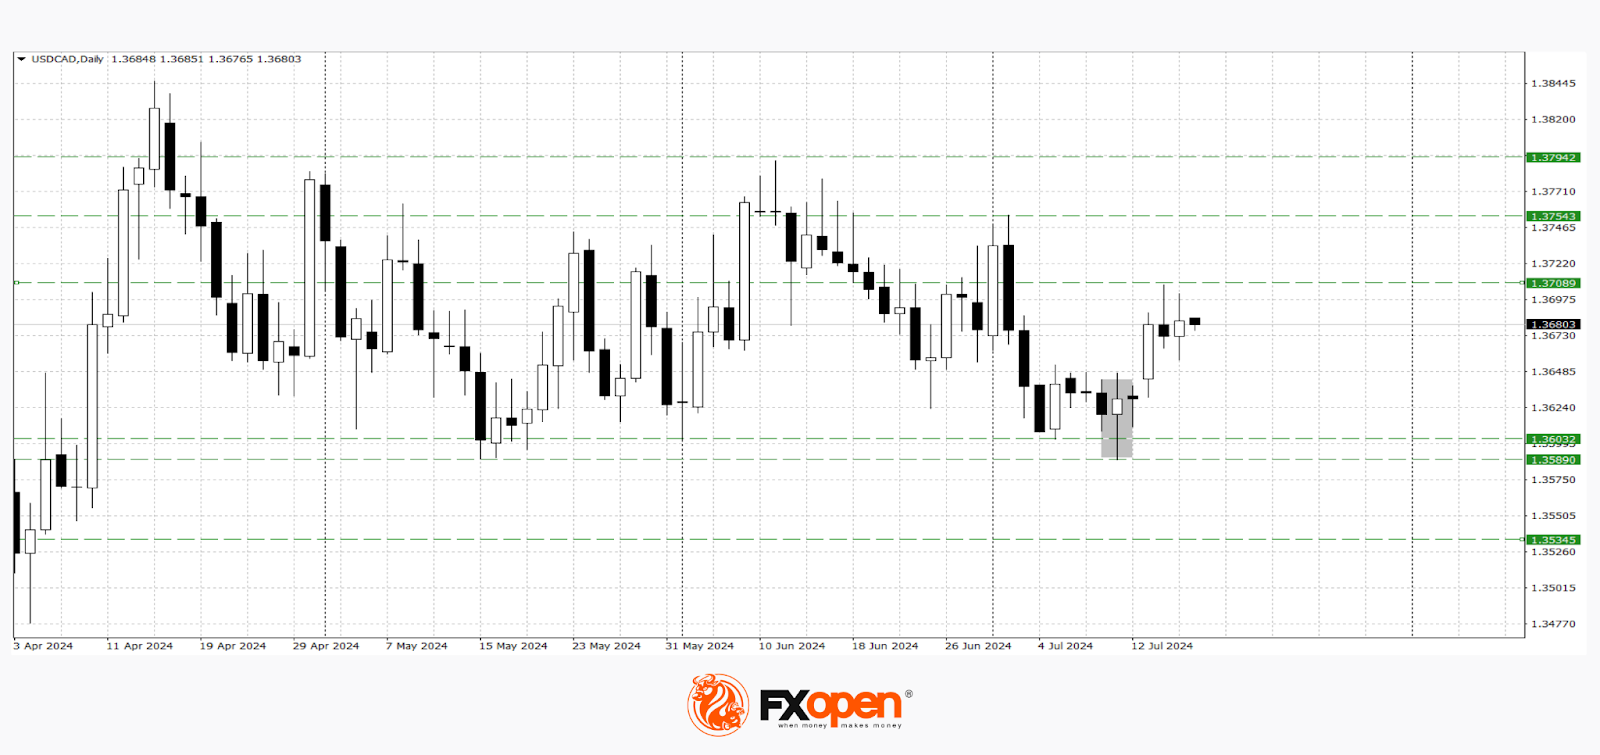
Last week, the USD/CAD pair sharply rebounded from the significant support at 1.3600, forming a bullish "hammer" pattern. Technical analysis of the pair suggests a potential resumption of the upward movement if the buyers manage to consolidate above 1.3700. It is worth noting that the price is testing this level for the second time this week. The inability of dollar bulls to overcome this resistance could push the price back to 1.3600-1.3580.
The upcoming trading sessions will be packed with important events and macroeconomic indicators:
- Today at 15:30 (GMT +3) the Philadelphia Fed Manufacturing Index (USA);
- Today at 15:30 (GMT +3) the initial jobless claims in the USA;
- Tomorrow at 15:30 (GMT +3) the core retail sales index in Canada.
AUD/USD
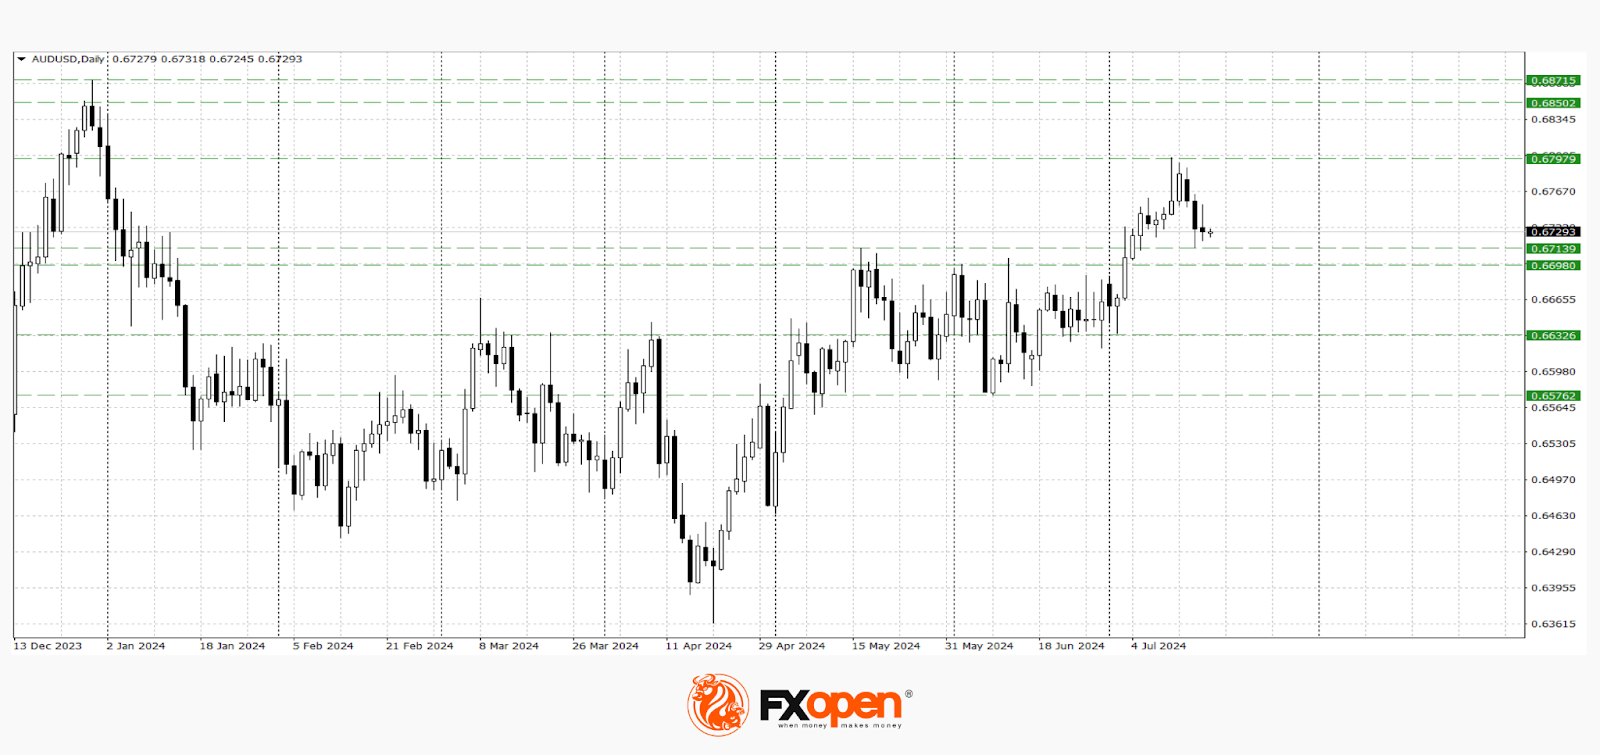
Following the release of inflation data in the USA, the AUD/USD currency pair managed to move above the significant range of 0.6700-0.6680. Buyers of the Australian Dollars have not yet managed to develop a full-fledged upward trend, but if the 0.6700 level remains as support, the price could continue its upward movement towards 0.6850-0.6800. If the price consolidates below 0.6680, it could return to the range of 0.6630-0.6580.
The volatility of AUD/USD could be influenced by speeches from Federal Reserve representatives in the upcoming trading sessions:
- Today at 20:45 (GMT +3) a speech by the Dallas Federal Reserve President Lorie Logan;
- Tomorrow at 19:45 (GMT +3) a speech by Federal Open Market Committee (FOMC) member Raphael Bostic.
Trade over 50 forex markets 24 hours a day with FXOpen. Take advantage of low commissions, deep liquidity, and spreads from 0.0 pips. Open your FXOpen account now or learn more about trading forex with FXOpen.
This article represents the opinion of the Companies operating under the FXOpen brand only. It is not to be construed as an offer, solicitation, or recommendation with respect to products and services provided by the Companies operating under the FXOpen brand, nor is it to be considered financial advice.
Elliott Wave Intraday: Rally in Bitcoin (BTCUSD) Looking Impulsive
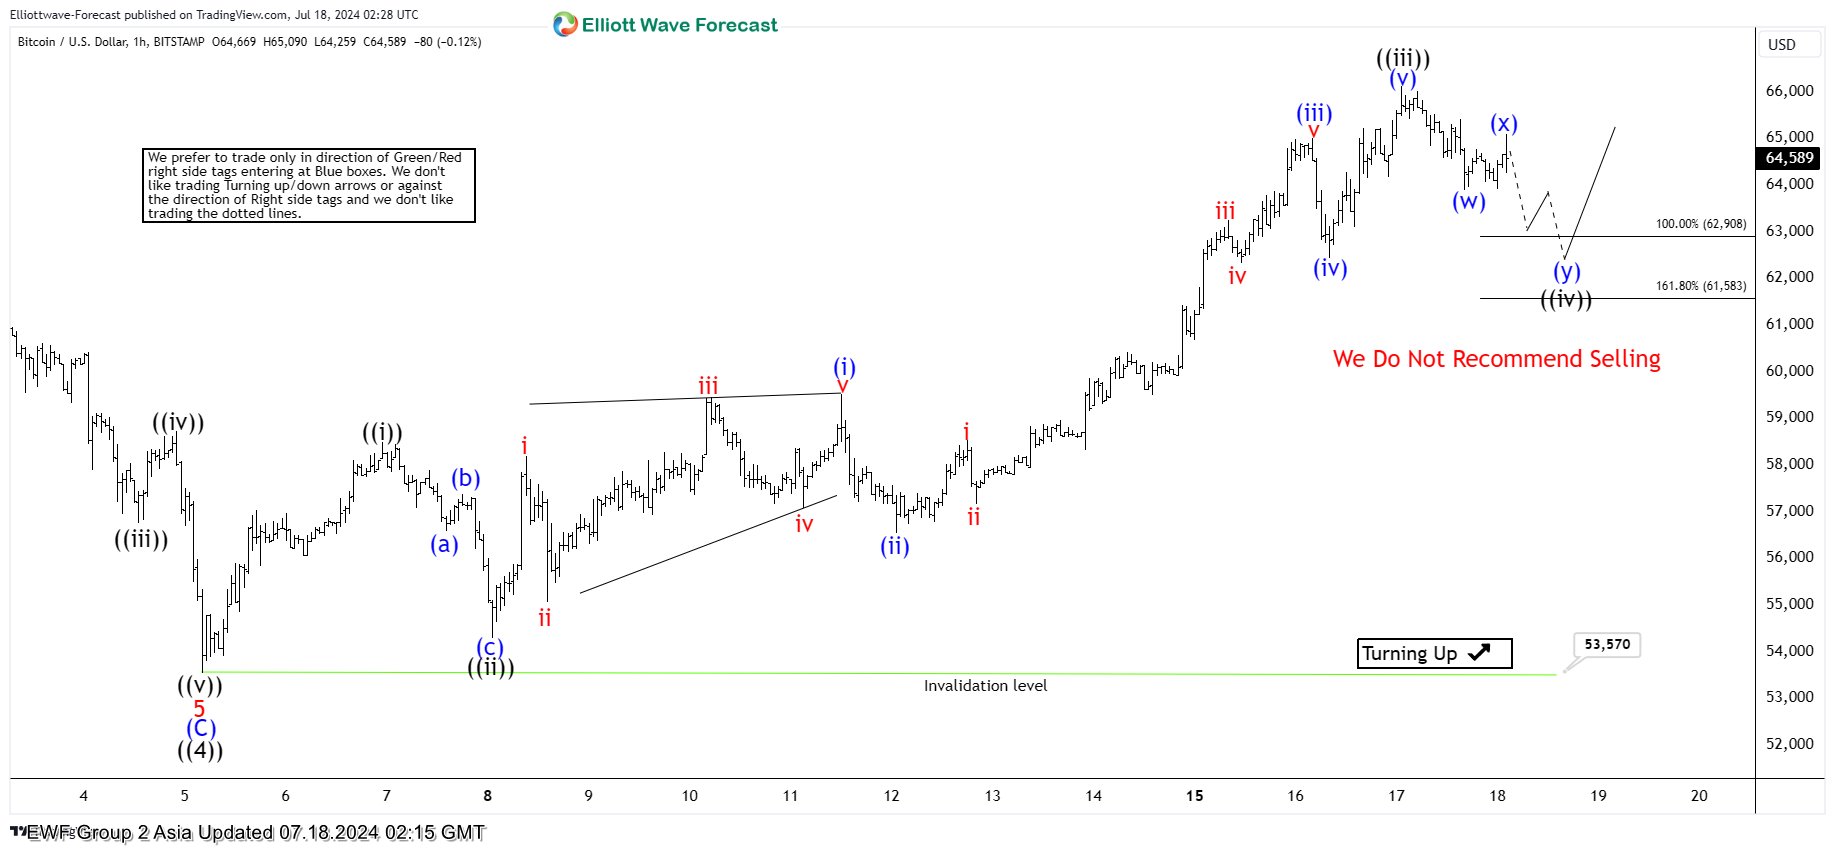
Rally from 7.5.2024 low in Bitcoin (BTCUSD) looks impulsive suggesting further upside. Pullback to 53570 ended wave ((4)) and Bitcoin has turned higher in wave ((5)). The crypto currency still needs to break the previous all-time high on 3.14.2024 high at 73794 to rule out any double correction. Up from wave ((4)), wave ((i)) ended at 58488 and dips in wave ((ii)) ended at 54296 with internal subdivision as a zigzag. Down from wave ((i)), wave (a) ended at 56578 and wave (b) ended at 57376. Wave (c) lower ended at 54296 which completed wave ((ii)).
Bitcoin has turned higher in wave ((iii)). Up from wave ((ii)), wave i ended at 58200 and wave ii ended at 56154. Wave iii higher ended at 59459 and wave iv ended at 57072. Wave v higher ended at 59516 which completed wave (i) in higher degree. Pullback in wave (ii) ended at 56551 and the crypto currency has turned higher again. Up from wave (ii), wave i ended at 58539 and pullback in wave ii ended at 57168. Wave iii higher ended at 63259 and dips in wave iv ended at 62323. Final leg wave v ended at 65012 which completed wave (iii). Pullback in wave (iv) ended at 62446 and wave (v) higher ended at 66129 which completed wave ((iii)). Pullback in wave ((iv)) is in progress to correct cycle from 7.8.2024 low before it resumes higher. Near term, as far as pivot at 53570 low stays intact, expect pullback to find support in 3, 7, 11 swing before it resumes higher.
Bitcoin (BTCUSD) 60 Minutes Elliott Wave Chart
BTCUSD Elliott Wave Video
https://www.youtube.com/watch?v=ickrUKjApyg
Change of Heart from Fed Governor Waller Significant
Markets
We’ve given Fed governor Waller plenty of attention this year. He’s been the voice of the large minority inside the Fed who from the beginning of the year has been pushing to keep policy rates at their peak levels for longer. Markets had to gradually retrace from huge easing bets at the beginning of the year, guided by Waller’s “What’s the rush?” and “There’s still no rush” chorus. Backed by stubborn Q1 inflation figures and a strong labour market, this eventually resulted in a median FOMC forecast of just one 25 bps rate cut this year at the June policy meeting. Benign Q2 CPI prints and fear that we might reach a tipping point in the labour market - from pulling vacancies to effectively reducing headcount – tilted the market balance back in favour of more (at least two) and potentially even bigger (50 bps instead of 25 bps) policy rate cuts. Fed governors welcomed the data, but didn’t commit to a specific timing for pulling the trigger. Fed Waller yesterday joined this majority view. “Current data are consistent with achieving a soft landing, and I will be looking for data over the next couple months to buttress this view. While I don’t believe we have reached our final destination, I do believe we are getting closer to the time when a cut in the policy rate is warranted.” The change of heart from Fed governor Waller is significant and a confirmation towards recent market repricing. While the US 2-yr yield reversed intraday course on his comments (from +6 bps to eventually +2 bps), it’s telling that they didn’t trigger a test of the recent lows around 4.40%. We conclude that at least in the short run, sufficient (or even again too much) Fed policy easing has been discounting. Ceteris paribus, this 4.4% floor should be able to hold going into the July 31 FOMC meeting.
Dollar weakness was yesterday’s main trading theme, with technical breaks in USD/JPY (<157.19), GBP/USD (>1.30) and EUR/USD (>1.0916). These moves occurred despite a modest yield rebound and an ongoing equity market correction. US tech-heavy Nasdaq posted its worst result YTD, correcting 2.77% lower. Hawkish trade/foreign policy comments by president-candidate Trump against Taiwan and the semiconductor sector played a role. EUR/GBP attempted a move below 0.84 after June CPI data (slightly) reduced odds of an August BoE rate cut (40% from 50%). A bang-in-line UK labour market report offers no directional guidance this morning. The ECB meeting is today’s key event. We expect ECB President Lagarde to hint at a potential 25 bps rate cut at the next September meeting. We don’t think that the outcome today will alter market pricing of quarterly rate cuts over the year ahead (Sep24, Dec24, Mar25, Jun25).
News & Views
The Australian labour market remains strong even as the unemployment rate rose from 4% to 4.1% in June. The economy in June added net 50.2k (net) jobs, with the gain mostly due to a second consecutive strong rise of full-time employment (43k). The rise in the unemployment rate mainly was the result from a higher participation rate. At 66.9% (from 66.8% in May) it nears the all-time record high of 67% (Nov 2023). Seasonally adjusted monthly hours worked rose by 0.8%. The Australian Bureau of Statistics said that "The employment-to-population ratio and participation rate both continue to be near their 2023 highs. This, along with the continued high level of job vacancies, suggests the labour market remains relatively tight, despite the unemployment rate being above 4% since April’. The Australian 2-y bond yield rebounds 3.2 bps. Markets currently attach a > 25% probability to the RBA raising its policy rate at the August meeting. June CPI inflation data (July 31) will be important input. The Aussie dollar rebounds slightly after a recent (mild) setback, trading at AUD/USD 0.674.
Japan in June returned to a trade surplus of JPY 224bn compared to a JPY 1220bn deficit the previous month as (nominal) exports rose more than imports. Exports added 5.4% Y/Y while imports only rose 3.2%. Even so, growth in both cases slowed substantially from May and also missed market expectations both for exports (7.2%) and imports (9.6%). Both nominal data were for an important part due to a sharp weakening of the yen compared to last year. In volume terms, merchandise exports declined 6.2% Y/Y with imports where 8.9% lower, suggesting still mediocre domestic demand. Japan recorded a JPY 870bn trade surplus with the US while it had a deficit of JPY 335,49bn with China and a deficit of JPY 185.67bn with the EU.
Graphs
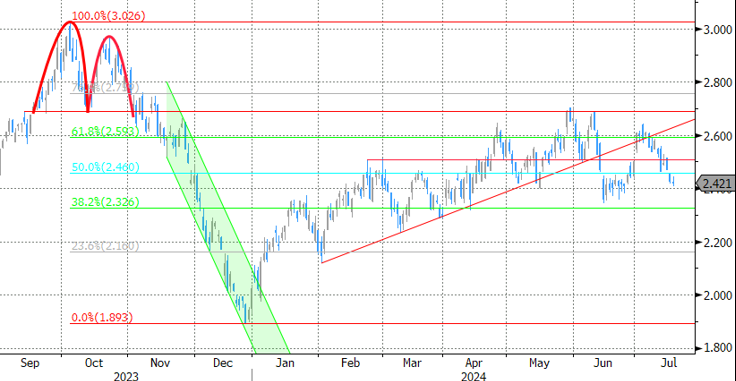
GE 10y yield
The ECB cut its key policy rates by 25 bps at the June policy meeting. A more bumpy inflation path in H2 2024, the EMU economy gradually regaining traction and the Fed’s higher for longer US strategy make follow-up moves difficult. Markets are coming to terms with that. Meanwhile, much of the save haven bids were reversed after the (first round in) the French elections. The 2.34%-2.4% support zone looks solid.
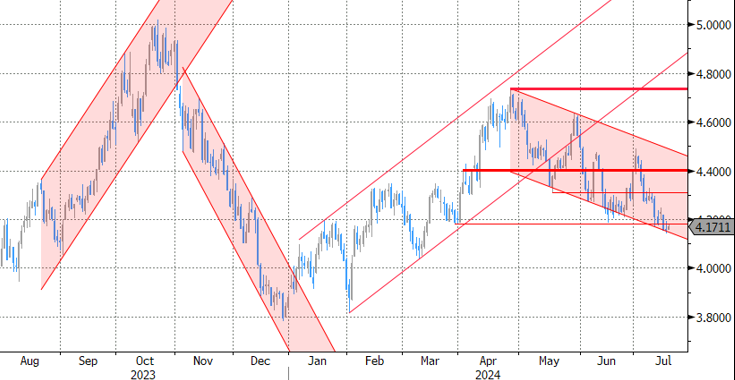
US 10y yield
The Fed indicated that it needs more evidence to lower its policy rate. June dots suggested one move in 2024 and four next year. Disappointing ISM and back-to-back downward CPI surprises put the US money market back on (at least) two rate cuts this year (September/December). The US 10-yr yield tests the recent lows and the downside of the downward trend channel in the 4.2% area.
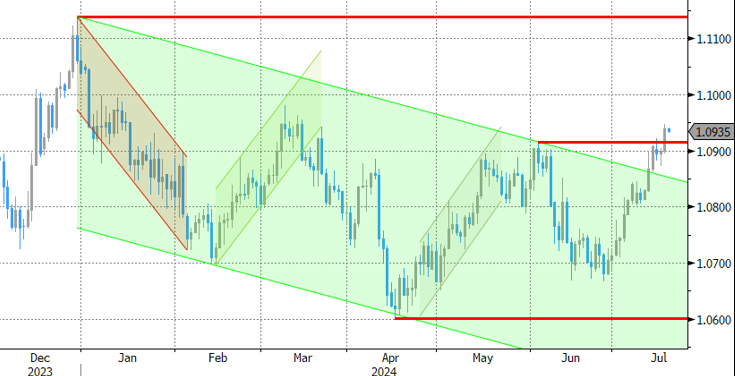
EUR/USD
EUR/USD is testing the topside of the 1.06-1.09 range as the dollar loses interest rate support at stealth pace. Markets consider a September rate cut a done deal and only need confirmation from high-ranked Fed officials. In the meantime, the euro got rid of the (French) political risk premium. Risks of a topside break are high, bringing the psychologic 1.10 and the December 2023 top at 1.1139 on the radar.
EUR/GBP
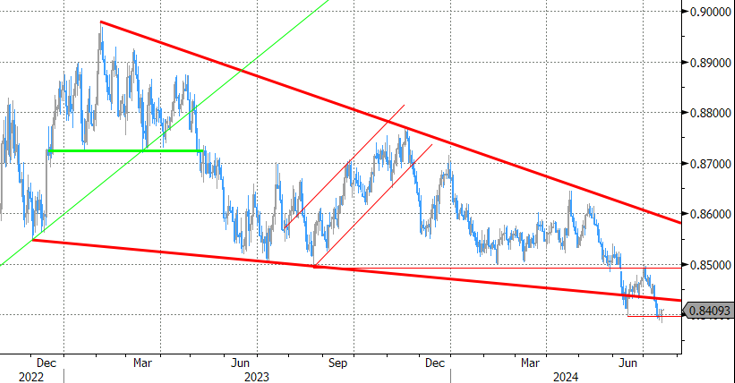
Debate at the BOE is focused at the timing of rate cuts. May headline inflation returned to 2%, but core measures weren’t in line with inflation sustainably returning to target any time soon. Still some BoE members at the June meeting appeared moving closer to a rate cut. Labour has yet to reveal its policy plans after securing a landslide election victory. EUR/GBP 0.84 is support is being tested.
EUR/USD Daily Outlook
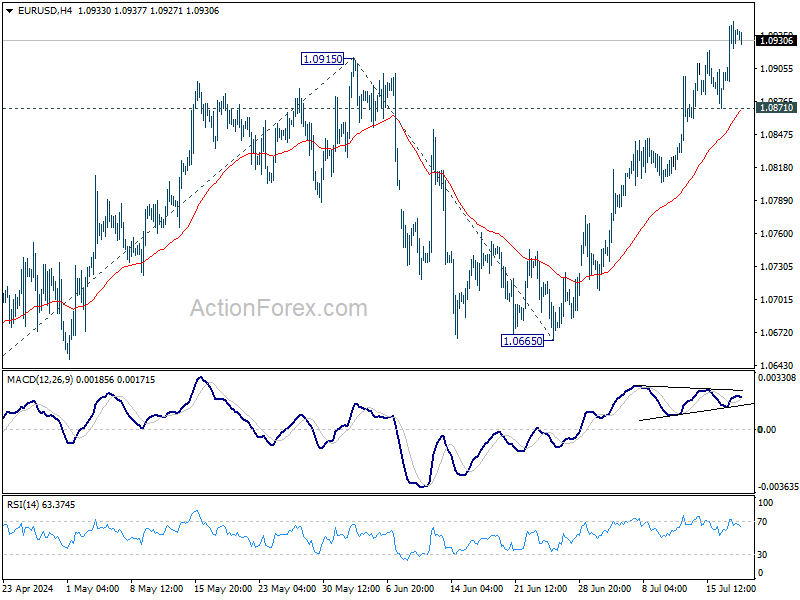
Daily Pivots: (S1) 1.0907; (P) 1.0928; (R1) 1.0960; More....
Intraday bias in EUR/USD remains on the upside for the moment. Rally from 1.0601 is in progress and should target 100% projection of 1.0601 to 1.0915 from 1.0665 at 1.0979. On the downside, below 1.0871 minor support will turn intraday bias neutral gain first.
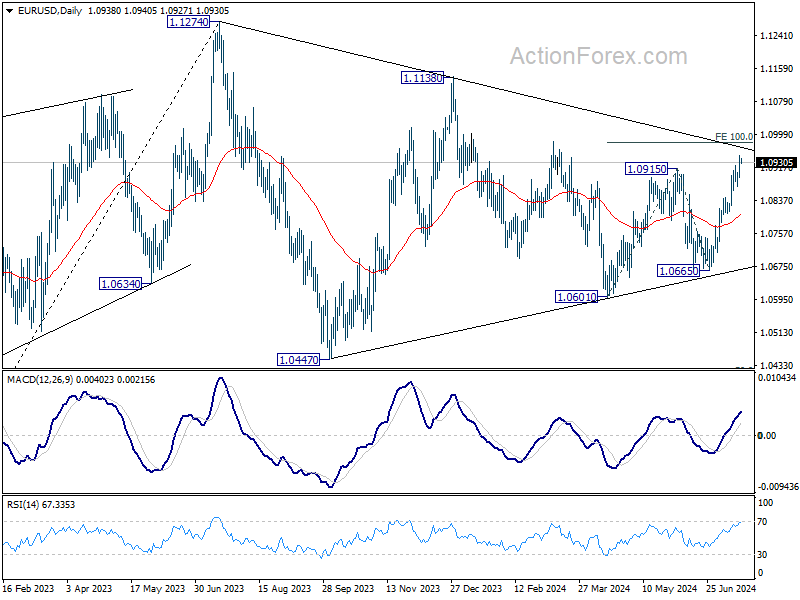
In the bigger picture, price actions from 1.1274 are viewed as a corrective pattern, possibly a triangle, that's still be in progress. Break of 1.1138 resistance will be the first signal that rise from 0.9534 (2022 low) is ready to resume through 1.1274 (2023 high). This will now remain the favored case as long as 1.0601 support holds.
GBP/USD Daily Outlook
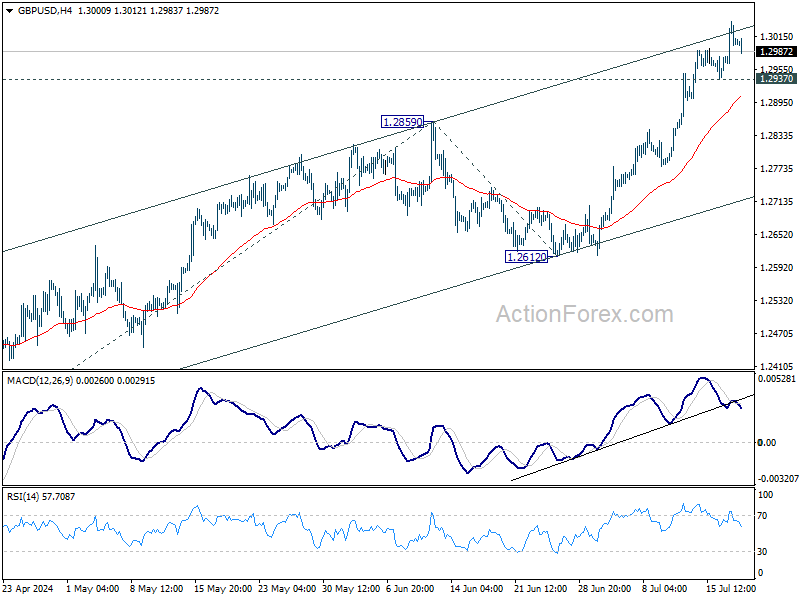
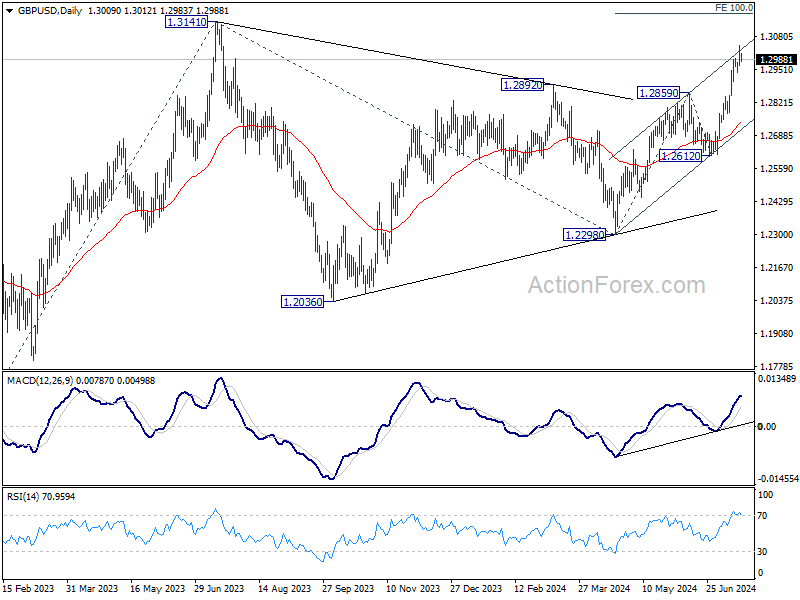
Daily Pivots: (S1) 1.2968; (P) 1.3006; (R1) 1.3048; More...
Further rally is expected in GBP/USD with 1.2937 minor support intact, despite some loss off upside momentum. Current t rise from 1.2298 should target 100% projection of 1.2298 to 1.2859 from 1.2612 at 1.3173, which is slightly above 1.3141 key medium term resistance. On the downside, below 1.2937 minor support will turn intraday bias neutral again first.
In the bigger picture, corrective pattern from 1.3141 medium term top (2023 high) could have completed with three waves to 1.2298 already. This will now remain the favored case as long as 1.2612 support holds. Firm break of 1.3141 will target 61.8% projection of 1.0351 (2022 low) to 1.3141 from 1.2298 at 1.4022.
USD/CHF Daily Outlook
Daily Pivots: (S1) 0.8790; (P) 0.8871; (R1) 0.8915; More…
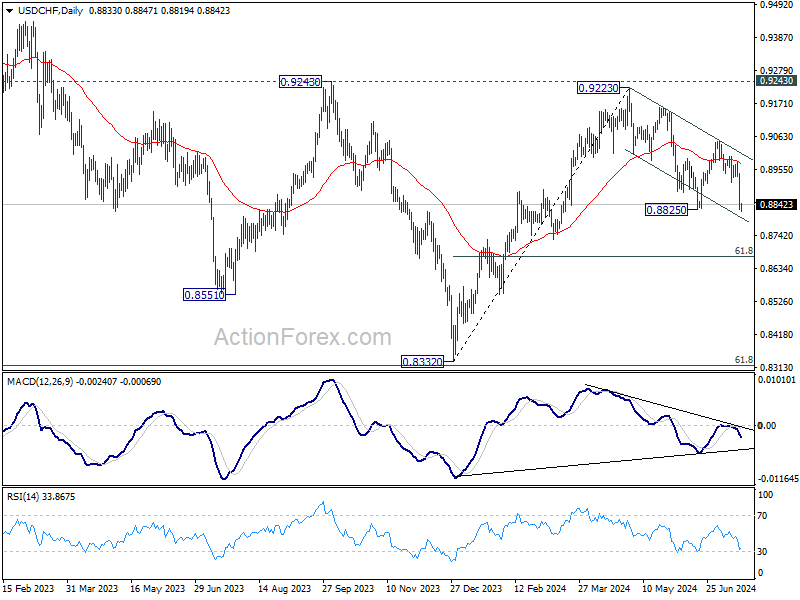
Intraday bias in USD/CHF stays on the downside as this point. Breach of 0.8825 support indicates that whole fall from 0.9223 is resuming. Deeper decline would be seen to 60% retracement of 0.8332 to 0.9223 at 0.8672 next. On the upside, above 0.8914 support turned resistance will turn intraday bias neutral first.
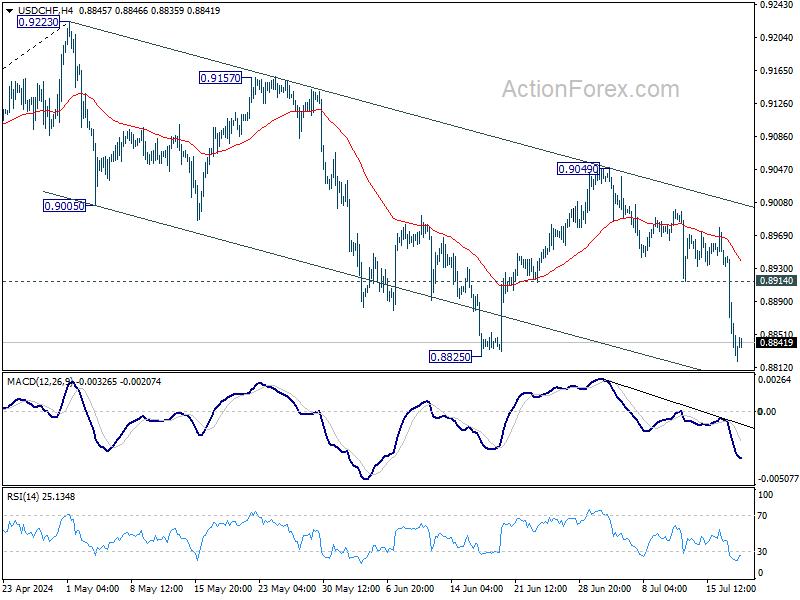
In the bigger picture, with 0.9243 resistance intact, medium term outlook in USD/CHF is neutral at best. For now, more sideway trading is likely between 0.8332/9243. However, firm break of 0.9243 will indicate larger bullish trend reversal.